Background
Left ventricular (LV) ejection fraction (EF) by transthoracic two-dimensional echocardiography is time-intensive and highly dependent on image quality. Mitral annular displacement (MAD) qualitatively correlates with EF and can be measured in patients with poor image quality and dropout. The authors hypothesized that speckle-tracking echocardiography (STE)–derived MAD could quantify EF accurately and tested this hypothesis using cardiac magnetic resonance (CMR) as a reference.
Methods
One hundred eighteen patients undergoing clinical transthoracic echocardiography were screened, and 110 whose mitral annuli was sufficiently well-defined irrespective of LV endocardial visualization underwent CMR within 6 days (85 of 110 in 1 day). Reference CMR EF values were obtained using standard methodology. STE was used to track annular motion throughout the cardiac cycle in the apical 2-chamber and 4-chamber views. To establish the relationship between MAD and CMR EF and to obtain a formula to estimate EF from MAD, regression analysis was performed in a study group of 60 patients with a wide range of EFs. This formula was then used in an independent test group of 50 patients by comparing estimated MAD EF against CMR EF values using Pearson’s correlation and Bland-Altman analyses.
Results
In the study group, STE MAD correlated highly with CMR EF and resulted in a formula relating MAD to EF. In the test group, estimated EF correlated well with CMR EF (4-chamber, R 2 = 0.64; 2-chamber, R 2 = 0.55), with near-zero bias and acceptable limits of agreement. Intraobserver and interobserver variability were between 5.8% and 12.7%.
Conclusions
STE MAD is a clinically useful tool for quick, easy, robust, and accurate estimates of EF irrespective of LV endocardial definition.
Accurate assessment of left ventricular (LV) ejection fraction (EF) by two-dimensional transthoracic echocardiography (TTE) is time-intensive and limited by poor image quality, because of its dependence on endocardial tracing, and by the frequent use of foreshortened apical views. The recognition of these limitations has led to the development of alternative echocardiographic methods for the assessment of LV systolic function. One proposed method involves the use of mitral annular displacement (MAD), which is fast and does not depend on endocardial definition and thus can be easily performed in the majority of patients. However, in previous studies, MAD was measured using angle-dependent techniques, such as M-mode and tissue Doppler, which can detect motion only in the direction of the ultrasound beam and thus may be inaccurate.
The recently developed speckle-tracking echocardiography (STE) provides an alternative technique to measure MAD that is angle independent, because it can track motion in any direction in the imaging plane. STE-derived MAD has previously been shown to correlate with echocardiographic biplane measurements of LV EF but has never been validated against an independent EF reference based on a different imaging modality. Accordingly, this study was designed to test in a large group of patients the hypothesis that STE-derived MAD provides accurate and robust estimates of LV EF using the gold standard EF reference of cardiac magnetic resonance (CMR).
Methods
Patients and Study Design
We enrolled 118 patients in whom TTE was performed within 6 days of CMR. In 85 of 118 patients (72%), the two tests were performed within 24 hours. All patients with visible mitral annuli on TTE were included regardless of LV image quality. This resulted in the exclusion of 8 patients because of poor tracking or visualization of the mitral annulus on TTE.
The remaining 110 patients were divided into a study group (n = 60) and an independent test group (n = 50). Care was taken to ensure that both groups included patients with a wide range of LV EFs. The study group was used to study the relationship between TTE-derived MAD and CMR EF to derive a formula describing this relationship using regression analysis. This formula was then used to prospectively estimate EF in the test group. The agreement between CMR reference EF and the estimated EF values was evaluated using Pearson’s correlation coefficient and Bland-Altman analysis.
To assess the reproducibility of mitral annular motion, 20 randomly chosen studies were selected, and another independent observer and the original observer repeated mitral annular longitudinal motion measurements. Intraobserver variability was defined as the mean of the values obtained by dividing the absolute difference between two measurements by the mean of the two measurements made by a single observer for a given patient. Interobserver variability was similarly defined for the two independent observers.
Echocardiographic Image Acquisition and Analysis
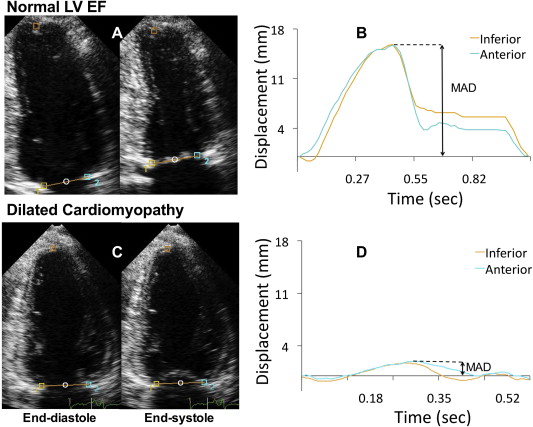
Digital cine loops of the apical 2-chamber and 4-chamber views were obtained in harmonic mode in all patients using the iE33 imaging system equipped with an S5 transducer (Philips Medical Imaging, Andover, MA). Speckle-tracking software (QLAB; Philips Medical Imaging) was subsequently used to measure MAD offline. Initially, 3 points were selected in each view as user-defined anatomic landmarks. In the apical 2-chamber view, the anterior and inferior aspects of the mitral annulus and the apical myocardium were used ( Figure 1 A, left). In the apical 4-chamber view, the hinge point of the mitral valve leaflets with the septal and lateral aspects of the mitral annulus and the apical myocardium were chosen. The longitudinal displacement of both annular points and a calculated midpoint between the 2 annular points was tracked throughout the cardiac cycle in each view ( Figure 1 A, right). The speckle-tracking software automatically plotted the measured mitral annular longitudinal displacement of each tracked point frame by frame. Subsequently, maximum displacement was determined by measuring the amplitude of each time curve ( Figure 1 B). Each study was assessed for quality using a 3-grade scale. The scale was as follows: grade 1 if ≥2 ventricular walls had poor endocardial definition, grade 2 if only 1 ventricular wall had poor endocardial definition, and grade 3 if there were no visualization problems.
CMR Image Acquisition and Analysis
CMR images were obtained using a 1.5-T scanner with a phased-array cardiac coil (Intera Achieva; Philips Medical Systems, Best, The Netherlands). In each patient, retrospective electrocardiographically gated localizing spin-echo sequences were used to identify the long axis of the heart. Steady-state free precession dynamic gradient-echo cine loops were then obtained using retrospective electrocardiographic gating and parallel imaging techniques during 10-second to 15-second breath holds with a temporal resolution of 30 frames/cardiac cycle. In all patients, cine loops of 8-mm-thick short-axis slices with 2-mm gaps and 2.0 × 2. -mm in-plane spatial resolution were obtained from just above the ventricular base to just below the apex.
CMR images were analyzed using commercial software (ViewForum; Philips Medical Imaging). Analysis included slices from the first basal slice that showed ≥50% of the circumference of the LV cavity surrounded by myocardial tissue through the last apical slice that showed the LV cavity. The LV endocardial boundary was then semiautomatically traced with the papillary muscles and trabeculae included in the LV cavity in every slice at end-diastole (first frame in the sequence) and end-systole (smallest LV cavity, as visually determined from 2 to 3 different slices) and manually adjusted when necessary. The EF was calculated from the end-systolic and end-diastolic volume using a standard formula.
Results
Among the 110 patients, 61 were men (40 men in the study group and 21 men in the test group). The mean age was 50 ± 18 years (54 ± 18 years in the study group and 45 ± 18 years in the test group). The mean CMR reference LV EFs were 41 ± 20% in the study group and 43 ± 16% in the test group. Twenty-two patients (37%) in the study group and 24 (48%) in the test group had regional wall motion abnormalities. Seventeen study group patients (28%) and 8 test group patients (16%) had global wall motion abnormalities. Basal wall motion abnormalities were seen in 24 study group patients (40%) and 23 test group patients (46%).
Image quality was graded 3 in 27 patients (24%) who had excellent image quality with clear visualization of all ventricular walls, 2 in 49 patients (44%) in whom 1 ventricular wall was poorly visualized, and 1 in 34 patients (32%) with poor visualization of ≥2 ventricular walls.
Mitral annular tracking and quantification of MAD were achieved in all patients within 10 seconds. In patients with low EFs, mitral annular longitudinal displacement was visually reduced ( Figure 1 C) and quantitatively confirmed by reduced amplitude of the time curves, resulting in lower MAD values ( Figure 1 D).
In the study group of 60 patients, a curvilinear relationship between CMR EF and MAD was found. MAD from each of the 6 tracked points obtained from the apical 2-chamber and 4-chamber views correlated well with CMR EF. In both views, the best correlation was found with the midpoint values, although the differences were small: R 2 = 0.77 for the 4-chamber midpoint and R 2 = 0.75 for the 2-chamber mid-point compared with R 2 values of 0.73 lateral, 0.71 septal, 0.72 anterior, and 0.73 inferior mitral annular points. Consequently, further analysis was solely performed on the midpoint values for both apical views. The regression equations obtained for both views were similar ( Figure 2 ): y = −0.074 × MAD 2 + 5.6 × MAD + 0.34 in the 2-chamber view and y = −0.055 × MAD 2 + 5.2 × MAD + 3.3 in the 4-chamber view. The use of second-order polynomial regression resulted in slightly higher correlations in both views than the linear regression, despite the small magnitude of the second-order terms.

Stay updated, free articles. Join our Telegram channel

Full access? Get Clinical Tree


