MEASURING ACCURACY WITH CORRELATIVE EXAMINATIONS
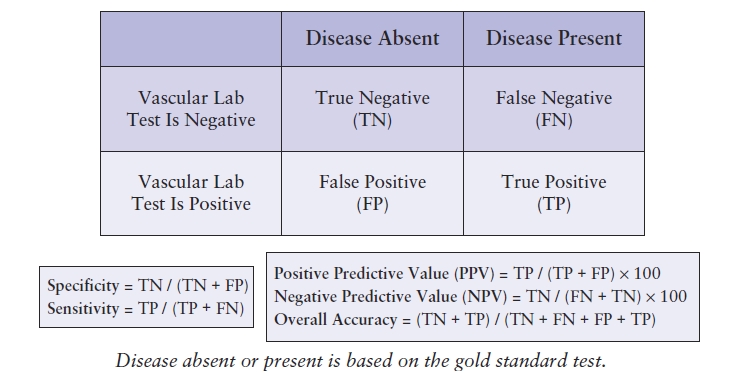
Specificity, sensitivity, and accuracy are used to describe the results of a diagnostic test in comparison with a standard examination (reference standard).6 These measures express the quality of an examination in different ways. Sensitivity is the probability that a test will be positive when disease is present (true positive). Specificity is the probability that a test will be negative when disease is absent (true negative). These relationships are shown in Table 4.2. The predictive value of a test is a measure of the number of times that the value obtained (positive or negative) is the true value. Thus, the percentage of all positive tests that are true positives is the positive predictive value, and the percentage of all negative tests that are true negatives is the negative predictive value. Accuracy is the number of correct findings whether a patient has disease or not. All of these measures are expressed as percentages. It is important to understand these definitions in order to precisely identify what the source of an overall low accuracy may be or to recognize trends that could potentially necessitate a change in one or more laboratory processes.
TABLE 4.2 Calculating Specificity, Sensitivity, and Predictive Values
A matrix is generally the best method for calculating the overall accuracy of a test and identifying any outliers or inaccurate test results. To create a matrix, use the categories for reporting disease from the noninvasive vascular examination for both the x and the y axes. The results that correlate exactly will fall on the diagonal axis within the grid, which represents agreement between the vascular laboratory test and the standard test (Table 4.3). To complete the matrix, locate the category reported for the noninvasive vascular examination on the y axis on the far left of the matrix and indicate the correlative examination categories along the top x axis. Using the duplex findings, locate the appropriate category (row) and place the mark under the category located on the horizontal axis (column) representing the correlative examination findings. Keep in mind that the correlative examination findings often are not reported using the same categories as the vascular laboratory test, so the findings may need to be reclassified to fit into the matrix. Table 4.4 demonstrates a comparison of carotid duplex findings with angiographic findings. All occurrences of exact correlations are tallied within the yellow boxes falling along the diagonal axis within the grid, whereas those findings that do not correlate fall either to the left or to the right of the diagonal axis.
TABLE 4.3 Sample Matrix for Correlating Results of Vascular Lab TEST and Gold Standard Test
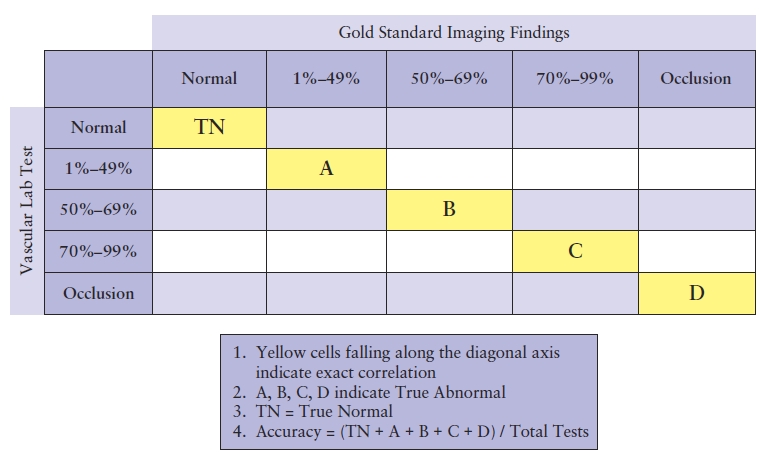
TABLE 4.4 Sample Matrix for Correlating Results of Carotid Duplex with Angiography
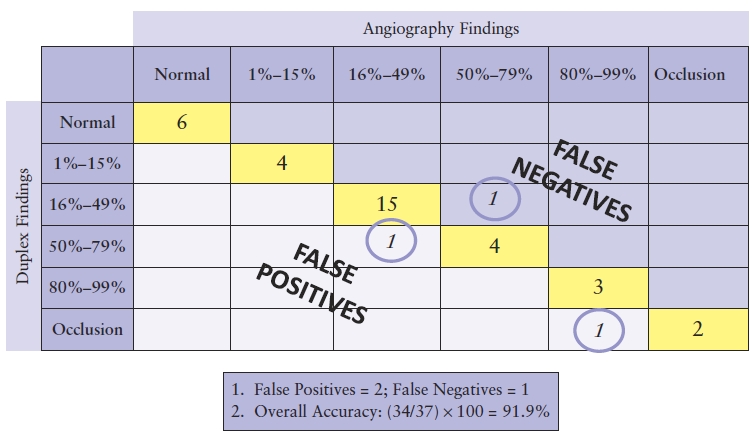
Table 4.4 demonstrates two occurrences in which findings were overestimated by duplex ultrasound, falling to the left side of the diagonal as false positives. There was a single instance in which the duplex underestimated findings and is counted as a false negative along the right side of the diagonal axis. Both of these types of outliers affect not only the overall accuracy of the test but the sensitivity and specificity as well. In calculating the overall accuracy, the true normal and abnormal examinations (those on the diagonal axis of the matrix) are added together and then divided by the total number of entries within the matrix. Table 4.4 shows a total overall accuracy of 91.9%.
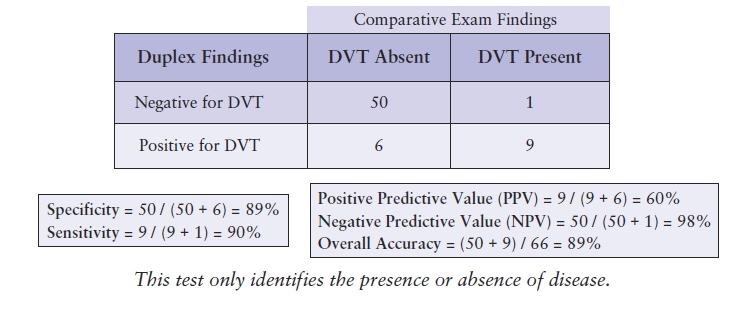
The accuracy of examinations that do not utilize criteria quantifying the severity of disease, but rather identify only the presence or absence of disease, such as peripheral venous duplex testing, can be tracked using a modified matrix. Inserting the examination results into this modified grid will identify the true positives, false positives, true negatives, and false negatives, as described in Table 4.2. This documentation will also provide the information needed to calculate the sensitivity, specificity, predictive values, and overall accuracy (Table 4.5).
TABLE 4.5 Sample Matrix for a Test to Detect DVT
WHEN CORRELATIVE EXAMINATIONS ARE NOT AVAILABLE
Historically, noninvasive vascular tests have been regularly correlated with imaging methods such as standard contrast angiography, digital subtraction angiography (DSA), and more recently, MRA and CTA. However, with advances in the technology of duplex ultrasound equipment and increased confidence in the ultrasound findings, patients are often treated based upon the noninvasive examination results alone; other imaging is not always performed. This is particularly true in peripheral venous testing for DVT in which ultrasound has become the “gold standard” and contrast venography or other imaging is rarely performed. In addition, patients regularly undergo carotid endarterectomy based on the carotid duplex findings alone.
Because of these changes in clinical practice, the number of alternative imaging examinations performed on patients undergoing vascular laboratory tests has decreased, and therefore, opportunities to correlate examination results have become less frequent. However, this increased confidence in ultrasound does not negate the need to monitor the accuracy of the noninvasive examination findings. In fact, when vascular laboratory tests are used in this way, it becomes even more imperative to regularly assess the image quality and the final interpretation. This can be accomplished through a variety of approaches that do not involve correlative examinations.
One method of assessing test validity is to compare the noninvasive examination findings with clinical outcomes or surgical findings. Clinical correlation refers to reviewing the treatment plan prescribed for the patient based on the noninvasive test results and the patient’s subsequent management to see whether the clinical course was generally consistent with the vascular laboratory diagnosis. Correlation with operative findings involves reviewing the operative report and determining whether the severity of a lesion found at surgery was consistent with the noninvasive test findings. It is also possible to correlate the location of lesions or other abnormalities using this approach. Correlation with operative findings, however, can be imprecise, and there is a potential for reporting bias without independent, objective adjudication of the findings. Thus, IAC Vascular Testing now strongly discourages correlation with operative findings.
Another QA tool is the “over-reading” of the examination results by a second physician. This can be used as a method of QA that compares the final interpretation of each reader and ensures that conclusions are consistent among all of the interpreting physicians. Repeat testing by two separate examiners can provide valuable information regarding the technical consistency of the examination. After the first technologist completes the test, another technologist who is not provided with the findings of the initial test performs a second examination. The findings of the two examinations are compared for test accuracy and adherence to protocol. Although these approaches do not provide the information necessary to calculate detailed QA statistics, they do provide additional ongoing assessments of laboratory quality when correlative examinations are unavailable.
It is worth noting that analyses for correlation of vascular laboratory studies may be skewed by a selection bias. Patients with negative studies and benign clinical courses are less likely to have additional imaging performed. If correlations are available for only a selected cohort, calculated sensitivity and specificity for tests may be different than the values that would be obtained if all tested patients had correlative studies. Further, the predictive value of a test will be less if the test is performed for indications that are different than those used for validation studies.
PEER REVIEW
A system of peer review provides regular feedback that assists in improving or maintaining the consistency of the laboratory. The peer review process evaluates the quality of examinations and interpretations and should include all members of the medical and technical staff. A specified number of random cases for each staff member are collected at intervals stated in the laboratory policy (e.g., monthly or quarterly). The reviews for these cases should be anonymous whenever possible, and the anonymity maintained by the individual responsible for collecting the QA data. Discrepancies should be defined as minor or major, and discrepancy trends should be tracked. All inconsistencies are noted, forwarded to the appropriate personnel, and discussed at the laboratory QA meeting.
Physician Peer Review
The physician review will include a review of the examination findings and comparison with the final report by another member of the medical staff. Inconsistencies between the test findings and the final report should be documented. As well, the reports should be evaluated for adherence to the diagnostic criteria, report content and format, and timeliness of report availability. A worksheet can be developed that will aid in this process (Fig. 4.1).
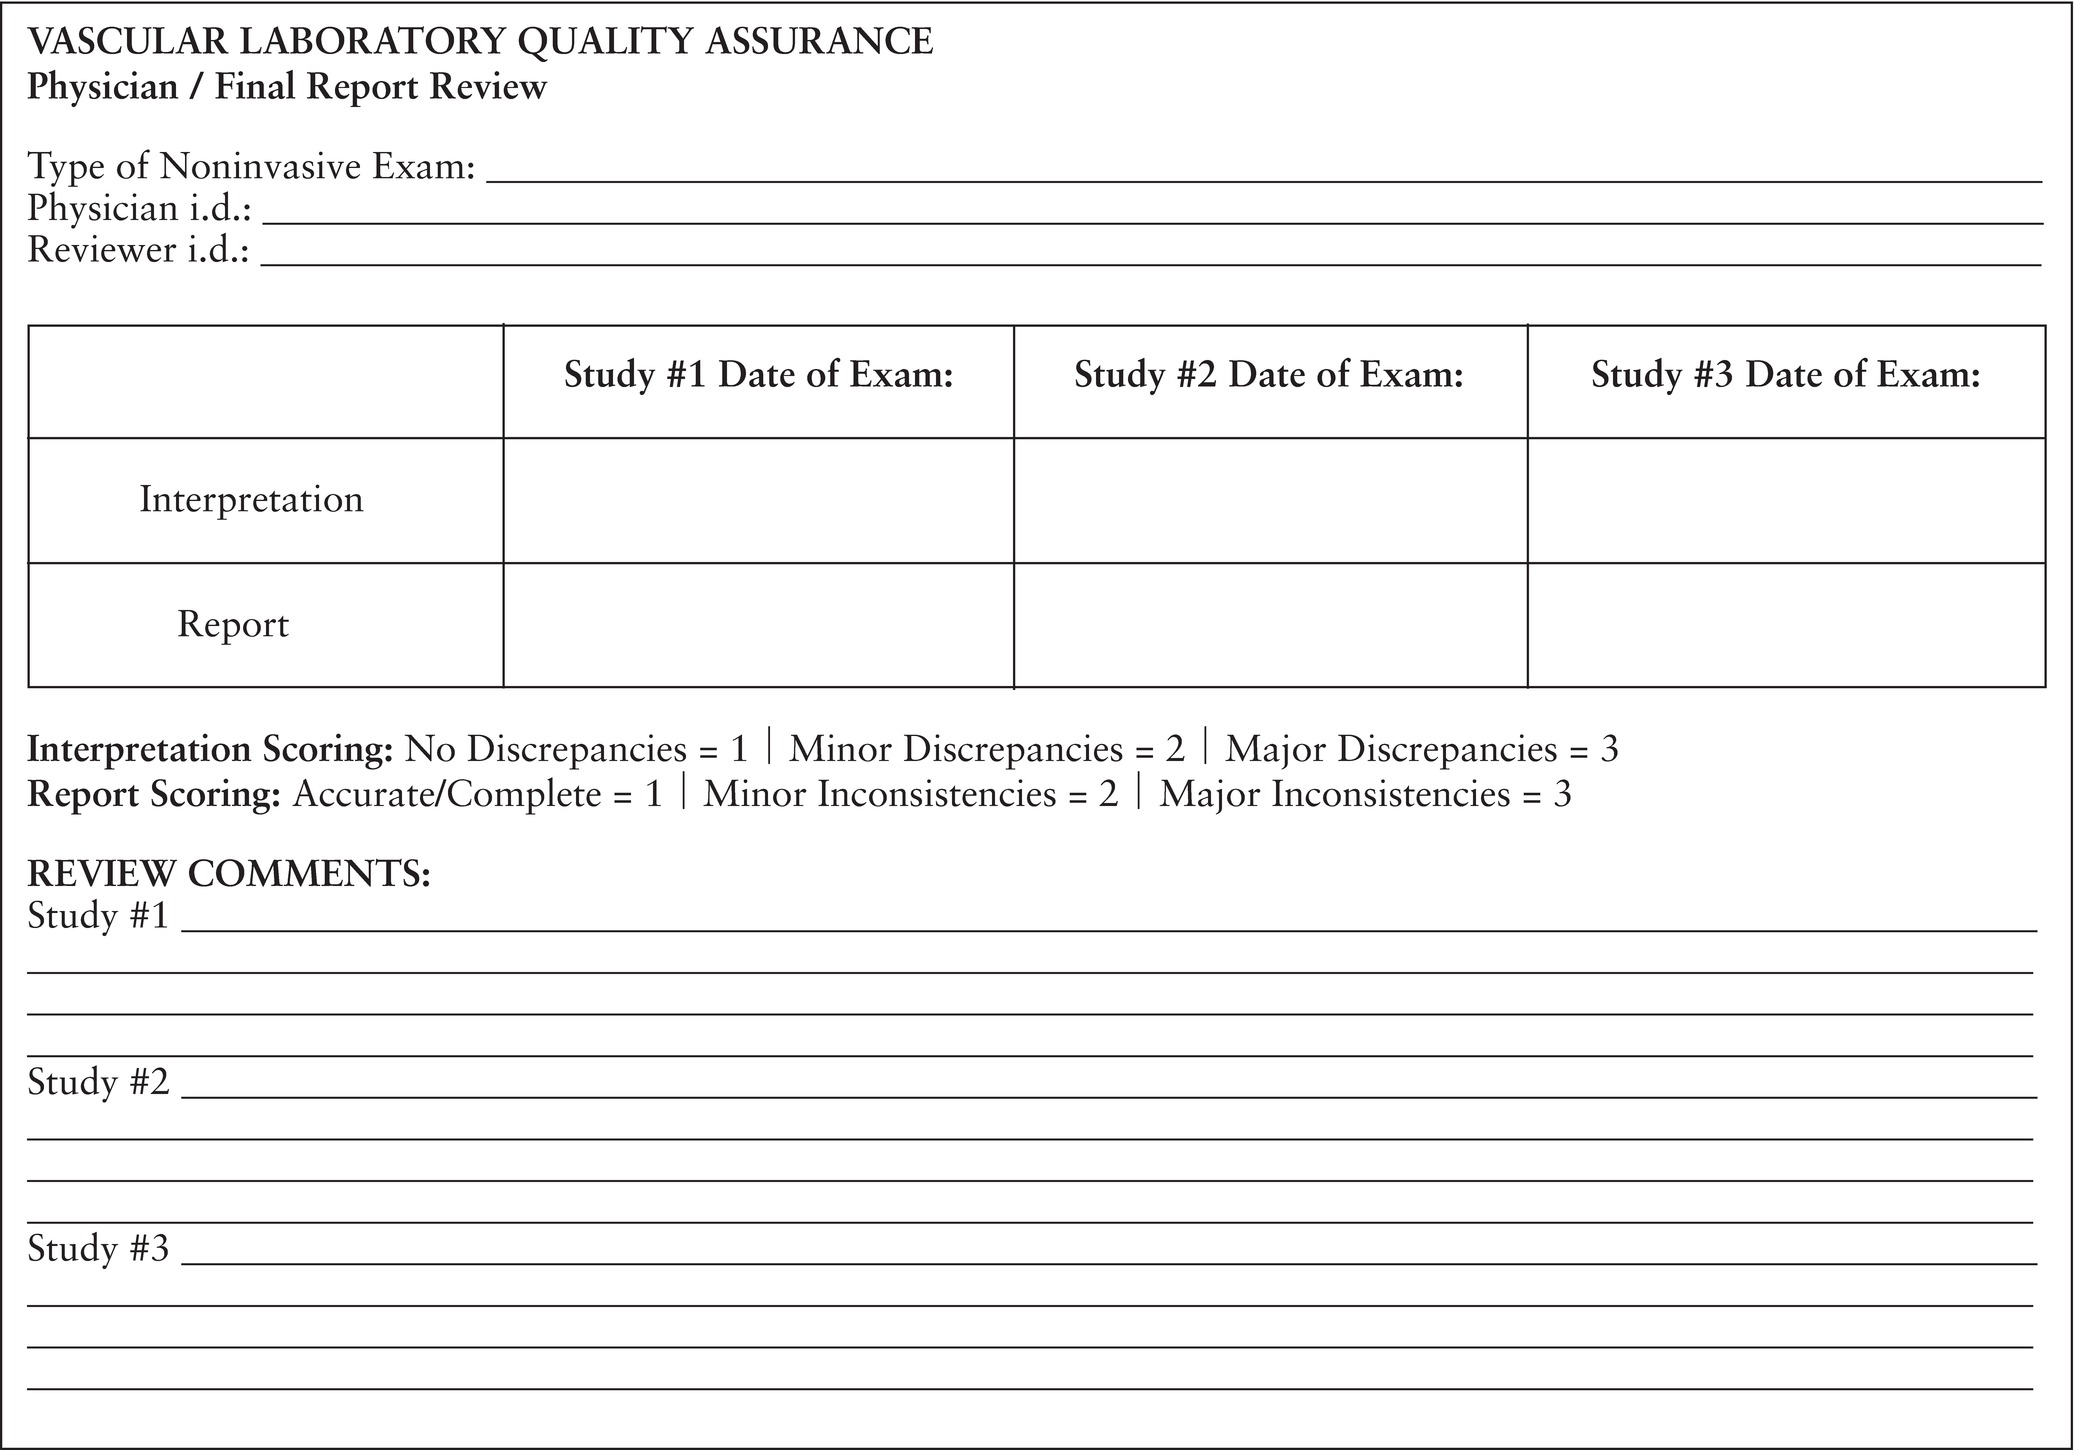
FIGURE 4.1. Sample worksheet for physician peer review.
Stay updated, free articles. Join our Telegram channel

Full access? Get Clinical Tree


