and Mark C. Mammel2, 3
(1)
Division of Neonatal-Perinatal Medicine, C.S. Mott Children’s Hospital University of Michigan Health System, Ann Arbor, MI, USA
(2)
Neonatal Medicine, Children’s Hospitals and Clinics of Minnesota, St. Paul, St. Paul, MN, USA
(3)
University of Minnesota, Minneapolis, MN, USA
Keywords
Pressure-volume loopFlow-volume loopComplianceResistanceOverdistensionAn erratum to this chapter is available at 10.1007/978-1-4939-2017-4_9
4.1 Introduction
Whereas pulmonary waveforms are time-based and relate changes in pressure, flow, and volume to time, these parameters may also be presented relative to each other. These are commonly referred to as loops. The two most frequently used in clinical practice are the pressure-volume (P-V) loop and the flow-volume (F-V) loop. The interpretation of these loops can provide valuable information about the mechanical properties of the lung, how it is “performing” on a breath-to-breath basis, and how it responds to changes in pathophysiology, mechanical ventilation, and their inter-relationship.
Interpretation of pulmonary loops involves a degree of pattern recognition. Unfortunately, the shapes of both P-V and F-V loops can be distorted if the axes are improperly scaled. Not every device automatically adjusts the axes, so care must be taken by the clinician to do so. Axes should completely contain the limits of the loop and should be as close to 1:1 as possible. Another problem is the lack of convention among device manufacturers in the way in which the F-V loop is drawn. Most use a clockwise direction, but some use a counterclockwise direction, so clinicians need to be aware of this and to properly orient themselves to the loop’s direction.
4.2 The P-V Loop
The P-V loop displays the relationship of pressure and volume during a single breath. Pressure is displayed on the x-axis and volume is displayed on the y-axis. The anatomy of a P-V loop is shown in Fig. 4.1. Note that the origin of the loop does not start at the origin of the graph because of the application of positive end-expiratory pressure (PEEP). As inspiration begins, there is a rise in pressure and subsequently volume. This describes the inflation limb of the loop and terminates at the peak inspiratory pressure (PIP). As the lung deflates, pressure and volume decrease, and the deflation limb terminates at zero volume and the PEEP level.
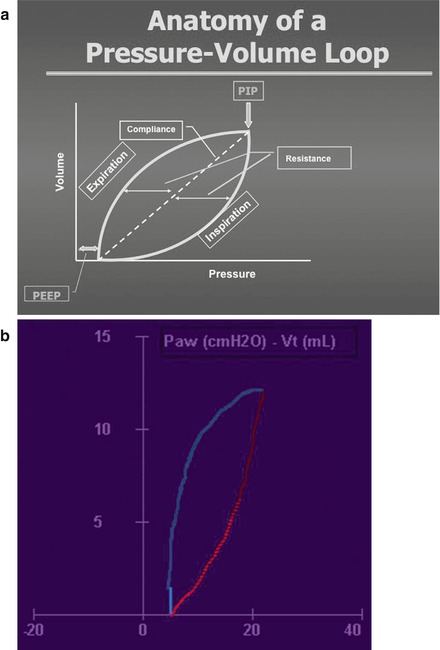
Figure 4.1
The pressure-volume (P-V) loop (a, schematic; b, actual). Changes in pressure and volume during a single breath are shown. The dotted line on the schematic represents the compliance axis. This graphic enables inferences about compliance, resistance, and lung inflation (Used with permission from Fanaroff and Martin’s Neonatal-Perinatal Medicine, edn 10, Martin R et al., editors, Copyright Elsevier, 2015)
The P-V loop provides valuable information about lung mechanics. The dotted line is the compliance axis, a measure of the stiffness or elasticity of the lung. Compliance is defined as the change in volume divided by the change in pressure. Thus, if a 1 cm H2O increase in pressure results in a 1 mL increase in lung volume, the axis will be 45°. As compliance decreases, the axis will shift downward and to the right. Conversely, as compliance improves, the axis will shift upward and to the left.
The work of breathing can be qualitatively estimated by the P-V loop. It is the area bounded by the inflation limb and a horizontal line connecting the PIP with the y-axis. As the compliance decreases and the loop shifts downward and to the right, this area increases and more pressure must be applied to achieve the same lung volume.
This loop also provides information about resistance. A line drawn from the midpoint of the inflation limb to the compliance axis is a measure of inspiratory resistance; a line drawn from the midpoint of the deflation limb to the compliance axis is a measure of expiratory resistance. Hysteresis is a term that is used to describe the difference between the inflation and the deflation limbs and is determined by the elastic properties of the lung. Under normal circumstances, the shape of the P-V loop is oval, resembling a football. Hysteresis thus represents the resistive work of breathing.
Finally, inflection points may be seen in both the inflation and the deflation limbs anywhere that the slope of these change. These are described in detail later.
4.2.1 Decreased Compliance
Decreased compliance is encountered frequently in neonatal practice. It may be seen in respiratory distress syndrome (RDS), pulmonary edema, pneumonia, or other conditions marked by surfactant inactivation or depletion. When compliance is low, the lung is stiff, requiring more pressure to deliver the same tidal volume (Vt) compared to normal compliance.
The relationship of pressure and volume help us to understand differences in the way mechanical ventilatory targets work. Figure 4.2 shows the changes in Vt delivery during pressure-targeted ventilation. Both breaths were delivered at the same pressure but at different compliance. The upper loop has a compliance axis of about 45° (compliance = 1.0 mL/cm H2O), whereas the lower loop has a compliance of about 30° (compliance = 0.67 mL/cm H2O). Because pressure is held constant, the delivered volume is considerably less at lower compliance.
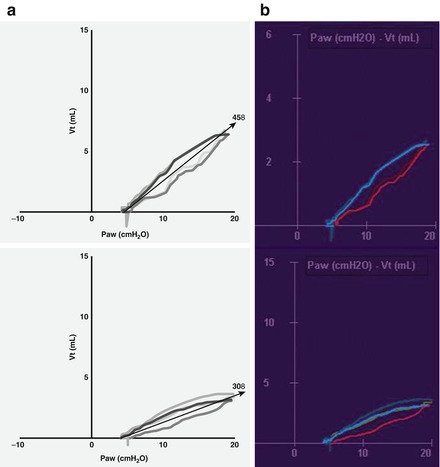
Figure 4.2
P-V loops demonstrating changes in compliance during pressure-targeted ventilation (a, schematic; b, actual). The P-V loop on the bottom demonstrates poor lung compliance. The compliance axis is only 30°. The top loop demonstrates improved compliance. Note that the compliance axis is 45°. Because pressure is constant, a larger tidal volume is delivered at better compliance (Used with permission from Fanaroff and Martin’s Neonatal-Perinatal Medicine, edn 10, Matin et al., editors, Copyright Elsevier, 2015)
In volume-targeted ventilation, the ventilator will maintain volume delivery by allowing pressure to fluctuate. Figure 4.3 schematically demonstrates this difference. Pressure targeting is on the left, volume targeting on the right. With pressure targeting, volume delivery depends primarily on lung compliance. The lower loop demonstrates poor compliance. When compliance improves (upper loop), delivered volume increases, even though pressure is constant. With volume targeting, volume delivery is constant, and pressure is varied. As shown, the loop on the right demonstrates volume delivery at lower compliance. When compliance improves (smaller loop on the left), pressure is automatically decreased to maintain consistent volume delivery. These changes will also occur in the reverse situation. If compliance suddenly decreases, volume delivery will decrease during pressure targeting, and pressure will increase during volume targeting.
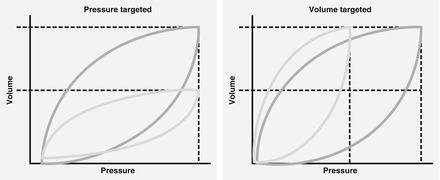
Figure 4.3
Schematic diagram demonstrating the differences between pressure and volume targeting when lung compliance changes. See text for explanation
The converse process during volume-targeted ventilation is known as auto-weaning. As compliance improves, the pressure is automatically decreased to maintain constant volume delivery (Fig. 4.4). In pressure-targeted ventilation, improving compliance will lead to larger volume delivery unless the clinician is vigilant and decreases the inspiratory pressure.
Figure 4.4
Graphic trend screen during volume targeted ventilation. Note the reduction in peak inspiratory pressure over time. The increase in tidal volume resulted from less compressible volume loss as compliance improved
4.2.2 Lung Inflation
The advent of real-time graphics has greatly contributed to our understanding of lung inflation and can enhance the safety of mechanical ventilation. In the past information about lung inflation was limited to the occasional chest radiograph, observation of chest excursions, and auscultation of breath sounds, which are all crude measures.
4.2.3 Hyperinflation
Figure 4.5 is a schematic representation of the P-V relationship. Note that the inflation limb is not linear over the entire range. However, the compliance axis (slope of ΔV/ΔP) is linear over the normal range of Vt around the functional residual capacity (FRC) of the lung. Over this linear range, Vt will increase proportionally to lung compliance (ΔV = C × ΔP). Lung compliance and the P-V relationships are determined by the interaction of the elastance of the lung and alveolar surface tension. As the lung approaches maximum filling and tissue distensibility becomes more limited, the compliance will decrease, resulting in less volume gain per unit of incremental pressure, and the slope of the compliance axis will shift downward. This creates an upper inflection point on the P-V inflation limb and graphically creates a “penguin beak” or “duck bill” appearance to the loop. This pattern is indicative of hyperinflation, and it can be quantified by using a metric known as the C20/C ratio (Fisher, 1988). The C20/C ratio examines the slope of the last 20 % of the inflation limb and compares it with the linear portion of the curve. If the curve remained linear to the peak pressure, the ratio would remain at 1.0; if the loop begins to bend to the right, the slope will decrease and the ratio will decrease to <1.0. Most present-day ventilators have the capability to display this measurement.
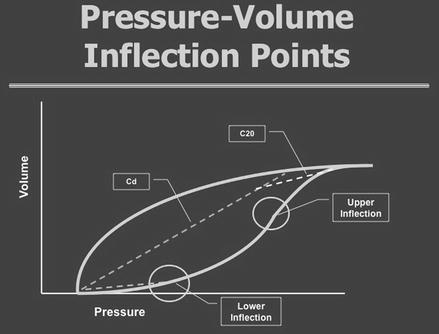
Figure 4.5


Schematic representation of the P-V relationship demonstrating the concept of upper and lower inflection points and the C20/C concept. See text
Stay updated, free articles. Join our Telegram channel
Full access? Get Clinical Tree
