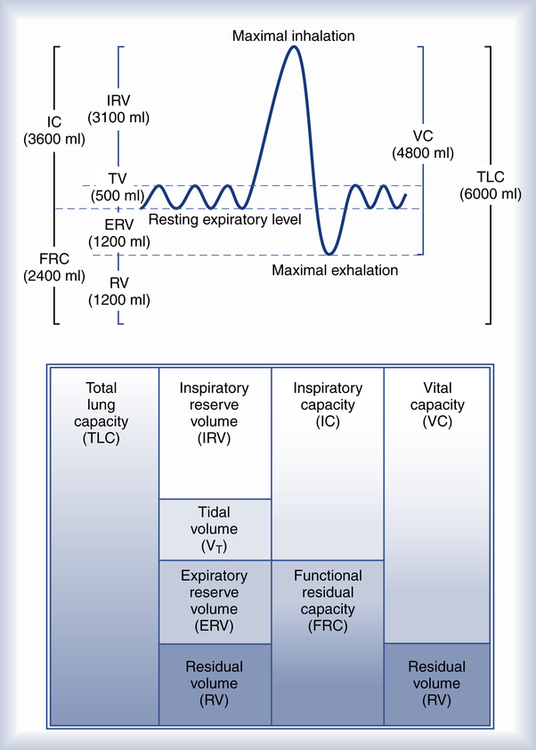
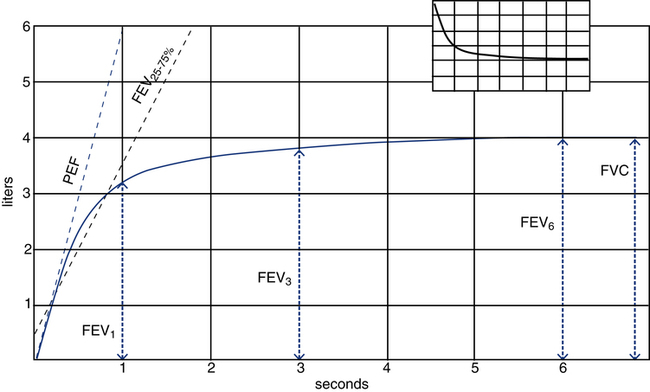
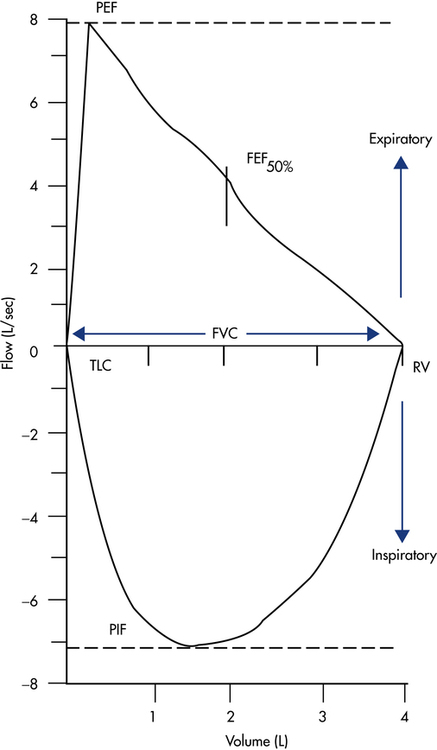
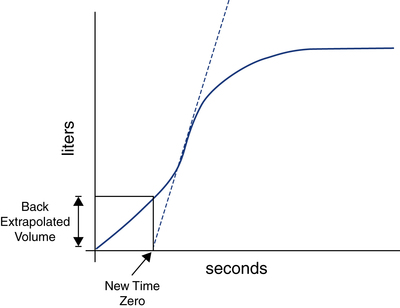
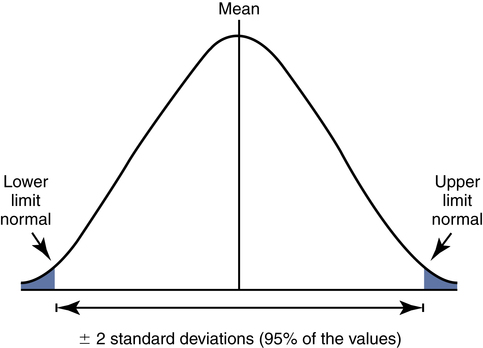
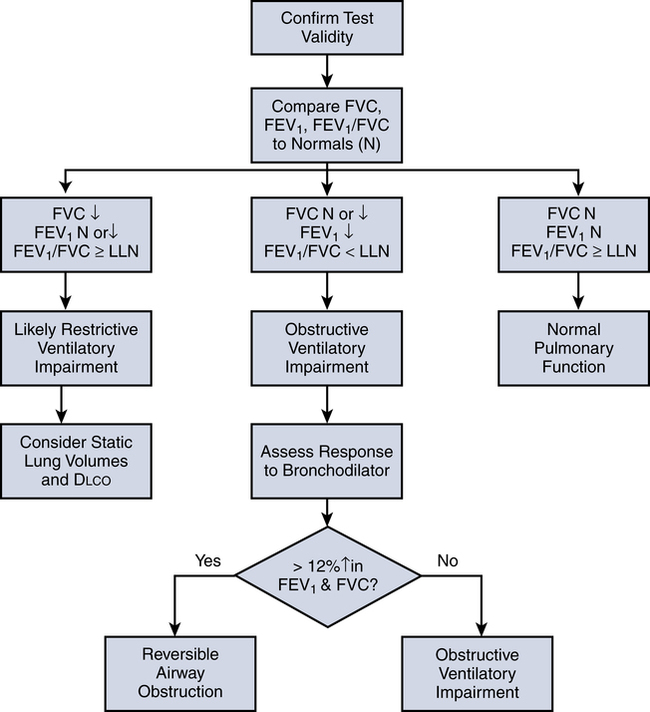
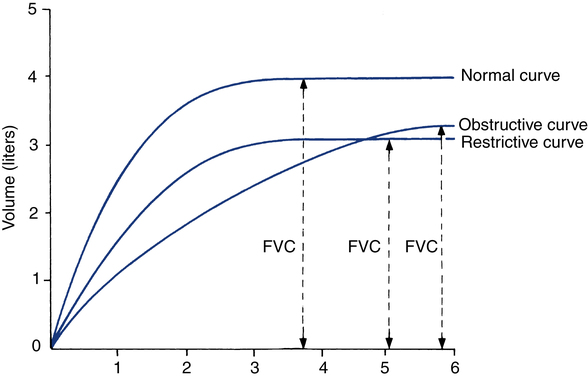
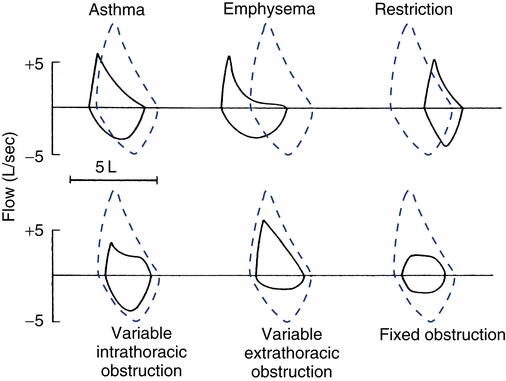
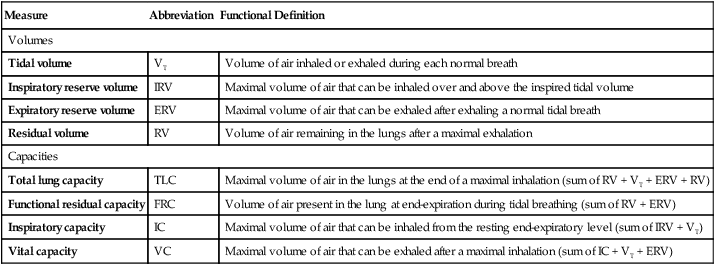
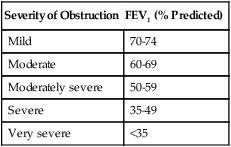
After reading this chapter, you will be able to: 1. Define and cite typical values for and differentiate among the lung volumes and capacities. 2. Compute any lung capacity based its constituent parts. 3. Specify the indications and contraindications for basic spirometry. 4. Differentiate between the measurement and use of the slow and forced vital capacity. 5. Define the parameters typically derived from a forced vital capacity (FVC) maneuver, plotted as volume versus time. 6. Describe the appropriate use of the peak expiratory flow measure. 7. Define the parameters typically derived from the maximal inspiratory-expiratory flow-volume curves and their use in identifying patterns of ventilatory impairment. 8. Define, describe the utility, and specify how to estimate the maximal voluntary ventilation. 9. Identify the necessary calibration tests and accuracy standards for spirometry equipment. 10. Outline the key procedural elements required to obtain accurate spirometry data. 11. Specify the acceptability and repeatability criteria for FVC measurements. 12. Apply the concept of reference ranges and upper and lower limits of normal to the interpretation of spirometry data. 13. Given a subject’s basic spirometry test parameters, classify the results as representing normal function or an obstructive or restrictive ventilatory impairment. 14. Describe how to use basic spirometry to assess for reversibility of an obstructive ventilatory impairment. 15. Specify the indications and contraindications for static lung volume determination. 16. Differentiate among the principles employed, equipment used, and quality assurance standards associated with the three primary methods for measuring functional residual capacity. 17. Compare and contrast the patterns of lung volumes and capacities in normal subjects and those with either an obstructive or restrictive ventilatory impairment. 18. Specify the indications for measuring the diffusing capacity of the lung (Dlco). 19. Identify the equipment needed and test and quality assurance procedures used to measure Dlco. 20. In combination with spirometry and lung volume values, apply Dlco measurements to differentiate among blood/pulmonary vascular disorders and potential causes of restrictive and obstructive ventilatory impairments. 21. Describe three methods used to measure airway resistance and its commonly cited normal reference range. 22. Describe how lung compliance is measured and the commonly cited normal values for lung, thorax/chest wall, and total compliance. 23. Identify the indications for methacholine bronchoprovocation testing, the basic procedure used, and how results are interpreted to classify airway responsiveness. 24. Describe the indications, equipment needed, and quality assurance procedures for measuring expired nitric oxide (FENO). 25. Apply recommended FENO cut-off points to the diagnosis and management of patients with asthma. 26. Outline the basic steps in the 6-Minute Walk Test, specify the cut-off points associated with abnormal functional capacity, and stipulate the percentage change needed to indicate improvement due to medical or surgical interventions. 27. Specify the indications and contraindications for cardiopulmonary exercise testing. 28. Define the measurements made when assessing exercise capacity and their typical values at peak capacity. 29. Apply the results of exercise testing to differentiate among patients with poor conditioning and those with cardiovascular or pulmonary limitations to exercise. 30. Outline the key infection control standards that apply to pulmonary function testing airway hyperresponsiveness (AHR) expiratory reserve volume (ERV) functional residual capacity (FRC) inspiratory reserve volume (IRV) interstitial lung disease (IDL) lower/upper limit of normal (LLN/ULN) maximal expiratory flow-volume curve (MEFV) maximal inspiratory flow-volume curve (MIFV) maximal midexpiratory flow (FEF25-75%) maximal voluntary ventilation (MVV) metabolic equivalent of task (MET) obstructive ventilatory impairment restrictive ventilatory impairment. specific conductance (Gaw/TGV) Fundamental to understanding pulmonary function testing is knowledge of the lung’s volumes and capacities. Figure 9-1 portrays the four lung volumes and four lung capacities both as a graphic plot of inspired and expired volumes over time (called a spirogram) and as a block diagram. Each measure includes its standard abbreviation, with the spirogram also providing average values for the lung volumes and capacities for a healthy young 70-kg adult male. Reference ranges for these measures vary primarily with the height of the individual but are also affected by gender, age, and race. As indicated in Figure 9-1, the four lung volumes (inspiratory reserve volume [IRV], tidal volume [VT], expiratory reserve volume [ERV], and residual volume [RV]) are separate from each other and do not overlap. On the other hand, a lung capacity consists of two or more lung volumes. For example, the total lung capacity (TLC) represents the sum of all four lung volumes. As such, lung capacities do overlap with each other. Note that the residual volume (RV) and the capacities that include it (functional residual capacity and total lung capacity) are not recorded on the spirogram plot in Figure 9-1. This is because the residual volume remains in the lungs at all times. Table 9-1 provides functional definitions for each of these volume and capacities. TABLE 9-1 • Detect abnormalities in the lung function suggested by patient history, physical examination, or related diagnostic tests such as chest radiograph. • Quantify the severity or stage of a known lung disease. • Follow the course of a patient’s disease and response to treatment. • Assess the risk for perioperative pulmonary complications. • Evaluate patients for the presence of pulmonary-related disabilities. • Monitor the effects of exposure to drugs or toxins affecting the lungs. The most common spirometry test is the FVC. Table 9-2 summarizes the parameters typically measured and evaluated during this test. TABLE 9-2 Parameters Typically Measured During Spirometry Figure 9-2 illustrates these parameters on a typical volume-versus-time spirogram. Note that the forced expiratory volume in 1, 3, and 6 seconds (FEV1, FEV3, and FEV6) are all volumes measured at specific times during the forced exhalation. Note also that a normal individual is able to exhale more than 75% of the FVC in 1 second and generally 95% or more in 3 seconds. However, the minimal time needed to assure a valid FVC measurement is 6 seconds, with some patients requiring more than 10 seconds to fully empty their lungs. Most electronic spirometers also can display and record the FVC maneuver as a plot of flow versus volume, typically referred to as a flow-volume loop (Fig. 9-3). To produce a complete flow-volume loop, the patient must be instructed to take a full forced inspiration to TLC before and after the forced exhalation maneuver. The spirometer then records both the inspiratory and expiratory efforts. The expiratory component of the maneuver, called the maximal expiratory flow-volume curve (MEFV), is plotted above the horizontal zero flow line, with the maximal inspiratory flow-volume curve (MIFV) recorded below the zero flow line. The FVC equals the maximal width of the loop along the zero flow line. The PEF equals the maximal positive deflection on the flow axis, with the peak inspiratory flow (PIF) represented as maximal negative deflection on this axis. The FEF at any point in the FVC can also be measured directly. Typically, spirometers record the FEF at 25%, 50%, and 75% of the FVC. For example, the FEF50% mark on the flow-volume loop in Figure 9-3 represents the instantaneous forced expiratory flow at 50% of the FVC. Differences in flow between any of these points can also be computed, with the most common being the FEF25-75%, which is equivalent to the same measure plotted on a volume-versus-time spirogram. To assure spirometry accuracy, regular calibration tests are required. Table 9-3 summarizes these tests as recommended by the ATS and European Respiratory Society (ERS). TABLE 9-3 Calibration Tests for Spirometry Equipment Box 9-1 outlines the key elements in the measurement of FVC using an electronic bedside spirometer. Most elements also pertain to spirometry measurement in the pulmonary function laboratory. The goal is to obtain at least three acceptable and error-free maneuvers that are repeatable. An acceptable maneuver must be free from artifacts, exhibit a good and forceful start, and achieve complete exhalation. To assure repeatability, the therapist must confirm that the key volume measures (FVC and FEV1) are free of significant variability. Although many computerized spirometers automatically perform validity checks on each FVC maneuver, the clinician still must manually inspect each plot to confirm that it is acceptable and that the multiple measures are repeatable. A summary of the acceptability and repeatability criteria recommended by the ATS/ERS for FVC maneuvers (plotted as volume vs. time) appear in Box 9-2. Spirometry software programs typically identify a slow start to forced exhalation by detecting a delay in time to peak flow (>120 msec) or by calculating the back-extrapolated volume. Figure 9-4 demonstrates how the back-extrapolated volume is calculated, normally by the spirometer’s microprocessor. If the back-extrapolated volume is more than 5% of FVC or more than 150 mL, the FVC is unacceptable, and a repeat maneuver is required. On the other hand, if the back-extrapolated volume falls below this quality threshold, the FVC breath still can be used, but with the breath starting point adjusted to the new extrapolated zero time point. The pulmonary function community has adopted ±2 standard deviations (SD) from the predicted mean as the normal reference range. With ±2 SD encompassing 95% of the values in a normal distribution (Fig. 9-5), one can define the boundaries of this range as cut-off points, outside of which results are abnormal. These cut-off points are called the lower limit of normal (LLN) and (if applicable) the upper limit of normal (ULN). Figure 9-6 outlines the basic process for interpreting spirometry test results. After ensuring that the test results are valid (three acceptable maneuvers, with two of them being repeatable), one compares the patient’s FVC, FEV1, and FEV1/FVC to the predicted reference ranges. If all three values fall within the reference ranges, the results are deemed normal. If, however, the FEV1 is reduced and the FEV1/FVC ratio falls below its LLN (below the 5th percentile of predicted), an expiratory flow limitation exists, and the patient is classified as having an obstructive ventilatory impairment. Often, the severity of obstruction is quantified according to magnitude of reduction in FEV1/FVC, as outlined in Table 9-4. TABLE 9-4 Severity Classification of Airway Obstruction Interpretation is enhanced by review of the graphic plots obtained by spirometry. Figure 9-7 portrays typical volume-versus-time curves for a normal subject, one with an obstructive impairment and one with a restrictive disorder. Note that the obstructive pattern is characterized by a decrease in the slope of the curve (indicating reduction in expiratory flow) and a longer time to empty the lungs. On the other hand, in the restrictive pattern, the lung empties as fast or faster than normal but to a smaller volume. Inspection of the patient’s flow-volume loop can aid in interpretation, especially in identifying the presence and location of large airway obstruction. Figure 9-8 provides six examples of flow-volume loops representing distinct patterns of abnormal function. Disorders causing generalized expiratory obstruction—like asthma and emphysema—mainly affect the MEFV curve, with both exhibiting a reduction in peak flow and FEF50%. Note also that the MEFV portion of the loop on the patient with emphysema is markedly concave and positioned left of the normal loop, indicating greater flow obstruction at lower lung volumes as well as air trapping and hyperinflation. On the other hand, a patient with a restrictive ventilatory impairment typically produces a flow-volume loop with the same shape as normal, but one that is markedly narrower on the volume axis, consistent with the smaller FVC. The bottom three flow-volume loops in Figure 9-8 portray different types of large airway obstruction. The variable intrathoracic obstruction loop reveals a markedly reduced peak flow on expiration despite near-normal inspiratory flows. This typically is the result of expiratory flow obstruction in the large airways, as may occur with tracheomalacia or tumors of the trachea or bronchi. The opposite pattern is seen in variable extrathoracic obstruction, that is, reduced inspiratory flow and relatively normal expiratory flow. Vocal cord dysfunction and laryngeal edema are common causes of variable extrathoracic obstruction. An equal reduction in inspiratory and expiratory flows suggests a fixed large airway obstruction. Causes of fixed large airway obstruction include tracheal stenosis, tracheal tumors, and foreign body aspiration. After the basic pattern is identified, additional testing may be indicated. If the spirometry results indicate that the patient has an expiratory obstructive impairment, the doctor typically will want to determine whether the obstruction is reversible with treatment, that is, if it responds to bronchodilator therapy (see Fig. 9-6). This is accomplished by measuring spirometry values before and after administration of the selected bronchodilator. Normally, the baseline spirometry should be conducted at least 4 hours after any prior use of a short-acting β-agonist (e.g., albuterol) and at least 12 hours after any administration of a long-acting bronchodilator (e.g., salmeterol). Box 9-3 outlines the key elements in the procedure for assessing reversibility. If after bronchodilator administration, the FEV1 or FVC increases by more than 12% and at least 200 mL, the obstructive impairment is considered reversible. A lesser response indicates that airflow limitation is not reversible. However, some patients who do not meet the criteria for reversibility may still experience improvement after bronchodilator therapy, such as a decrease in dyspnea. This response likely is due to a decrease in hyperinflation occurring without a significant decrease in airway resistance. As indicated in Figure 9-6, a reduced FVC in the presence of a normal or high FEV1/FVC suggests that the patient may have a reduction in lung volumes. However, this same pattern can occur among patients who fail to completely inhale or exhale during the maneuver. For this reason, confirmation of a reduction in lung volumes and the presence of a restrictive disorder requires measurement of static lung volumes (FRC, RV, TLC). Moreover, if it is suspected that the restrictive condition is due to an interstitial disease processes, most doctors will also request a diffusing capacity study (Dlco). Static lung volume measurements are indicated to: • Confirm a suspected restrictive disease pattern (low FVC, normal or high FEV1/FVC) • Assess the impact of or response to medical or surgical interventions such as lung-volume reduction, lobectomy, lung transplantation, and radiation or chemotherapy • Provide an index of gas trapping (requires comparison of FRC by gas dilution to plethysmographic thoracic gas volume)
Pulmonary Function Testing
Lung Volumes and Capacities
Measure
Abbreviation
Functional Definition
Volumes
Tidal volume
VT
Volume of air inhaled or exhaled during each normal breath
Inspiratory reserve volume
IRV
Maximal volume of air that can be inhaled over and above the inspired tidal volume
Expiratory reserve volume
ERV
Maximal volume of air that can be exhaled after exhaling a normal tidal breath
Residual volume
RV
Volume of air remaining in the lungs after a maximal exhalation
Capacities
Total lung capacity
TLC
Maximal volume of air in the lungs at the end of a maximal inhalation (sum of RV + VT + ERV + RV)
Functional residual capacity
FRC
Volume of air present in the lung at end-expiration during tidal breathing (sum of RV + ERV)
Inspiratory capacity
IC
Maximal volume of air that can be inhaled from the resting end-expiratory level (sum of IRV + VT)
Vital capacity
VC
Maximal volume of air that can be exhaled after a maximal inhalation (sum of IC + VT + ERV)

Spirometry
Indications and Contraindications
Forced Vital Capacity
Parameter
Abbreviation
Definition
Forced vital capacity
FVC
Total volume of air that can be exhaled during a maximal forced expiration effort
Forced expiratory volume in 1 second
FEV1
Volume of air exhaled in the first second after a maximal forced inhalation
Ratio of FEV1 to FVC
FEV1/FVC
Proportion or percentage of the FVC expired during the first second of the maneuver
Forced expiratory volume in 3 seconds
FEV3
Volume of air exhaled in 3 seconds after a forced maximal inhalation
Forced expiratory volume in 6 seconds
FEV6
Volume of air exhaled in 6 seconds after a forced maximal inhalation
Peak expiratory flow
PEF
Maximal expiratory flow, typically achieved within 120 msec of the start of the forced exhalation
Maximal midexpiratory flow
FEF25-75%
Average flow occurring between 25% and 75% of the FVC
Flow-Volume Loops
Spirometry Quality Assurance
Equipment Calibration
Test
Minimum
Interval
Action
Volume
Daily
Calibration check with a calibrated 3-L syringe
Volume linearity
Quarterly
1-L increments with a calibrated syringe over entire volume range
Flow linearity
Weekly
Test at least three different flow ranges
Software
New versions
Log installation date and perform test using biologic controls and known subject
Technique Validation
Interpretation of Spirometry Test Results
Severity of Obstruction
FEV1 (% Predicted)
Mild
70-74
Moderate
60-69
Moderately severe
50-59
Severe
35-49
Very severe
<35
Static Lung Volumes
Indications and Contraindications
Pulmonary Function Testing