Fig. 15.1
Simplified representation of “unfolded circulation” with representation of right atrium (RA), right ventricle (RV), lungs, left atrium (LA), left ventricle (LV) and systemic organs. Concepts related to coupling and matching between different physiological and anatomical entities are designed and an arrow indicate their relative location (Reproduced with permission from Laboratory of Surgical Research of the Marie Lannelongue Hospital)
Historical Perspective
Suga and Sunagawa et al. were one of the first to introduce the concept of ventriculo-arterial coupling [5] derived from pressure-volume loop analysis using conductance catheterization. This method allows quantifying, in a same set of acquisition, a load-independent indice of venricular contractility, the end systolic elastance (Ees); and an integrative indices of ventricular afterload, the arterial elastance (Ea). The ratio of these elastances provides a value of ventricular–arterial coupling. The major breakthrough of PV loops evaluation was to provide load independent indices of ventricular elastance using multiple pressure-volume points during acute load variations, which is the current gold standard to quantify the ventricular contractility. The end-systolic ventricular elastance is computed from a slope of linear regression of at least 2 end-systolic pressure-volume points. The linearity of the multibeat end-systolic pressure –volume relationship (ESPVR) during acute load variation was first suggested by Suga et al. from isolated heart and later verified in the clinical settings by Wallace et al. [6]. However, Kass et al. showed ESPVR being closer from a quadratic relationship [7]. The second important metric derived from PV-loop analysis was arterial elastance (Ea) which represents a measure of ventricular afterload. It is usually calculated as end-systolic pressure divided by stroke volume (Ea = ESP/SV). Other authors recommend subtracting RV end-diastolic pressure from end-systolic pressure. These differences in Ea must be considered when comparing results from different studies. Unlike impedance spectrum analysis of RV afterload, Ea is easier to quantify and relates well to lumped quantification of ventricular afterload [8].
The concept of ventriculo-arterial coupling relates to a measure of contractility corrected for afterload and is measured using the ratio of Ees/Ea. One of the points of confusion is that the term “load independency” refers to the beat-to-beat stability of the end-systolic pressure over volume ratio during acute loading variation used to measure Ees; while the contractility will adapt within 20–30 s or few minutes to an afterload variation due to homeometric regulation, sometimes refered to as the “Anrep effect.” One of the strong advantages of Ees/Ea ratio, having no dimension, is that it decreases the influence of volume and pressure calibration errors and allows comparison between individuals without requiring scaling. Initially, the ventricular-arterial coupling was referred as the ventriculo-arterial matching [9] and the value of Ees/Ea = 1 was considered as to be the perfect match. From theoretical models, the ratio Ees/Ea = 1 corresponded to the optimal mechanical coupling. Currently, there is no definition of normal values of ventriculo-arterial coupling nor is there a well-established threshold defining uncoupling. However, based on the literature the range of the right ventricular-pulmonary artery (RV-PA) coupling in healthy individuals is situated between 1 and 2 depending on the methods used for determinations of Ees and Ea, and appears to be comparable for both the right and left ventricle. Also the optimal ratio of ventricular energy production transmitted to the arterial system occurs for RV-PA coupling values of 1.5–2 [10]. In our experience in large animal model of pulmonary hypertension, the Ees/Ea values may vary from 0.3 in the setting of severe chronic pressure overload, to about 4 in the setting of dobutamine infusion in healthy animals. This range of dynamic coupling has also been shown in different experimental models as well as in several human studies.
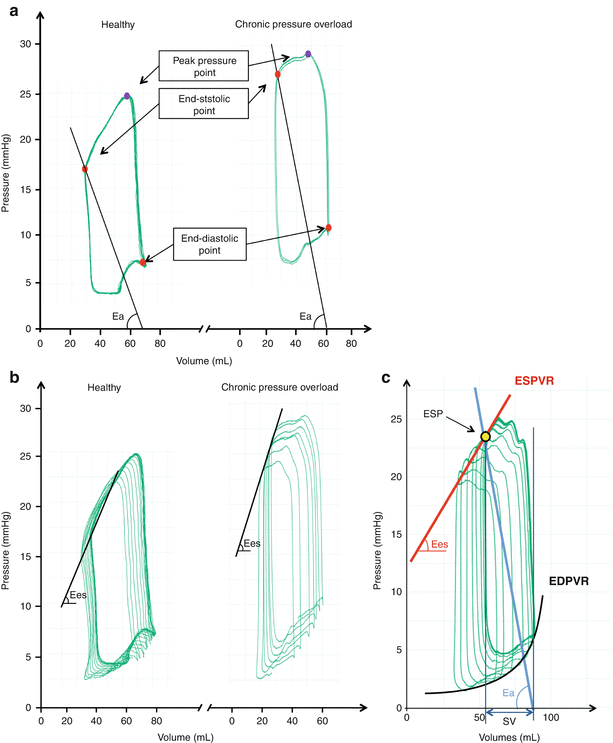
The methodology of PV loop analysis was first introduced in the left ventricle and then applied to the right ventricle. The differences between RV- and left ventricular (LV)-PV loop interpretation are mainly due to the differences in the systolic pressure definition to determine the end-systolic elastance as well as in ventricular geometries. Due to relatively low resistance in the pulmonary circuit, normal RV ejection continues past peak pressure in contrast to the LV-systemic system (Fig. 15.2a, b). In the left ventricle, both the end-systolic point or the peak pressure point have been shown to be valid to quantify contractility variations [11]. Dell’Italia showed using RV PV-loops in normal subjects that evaluation of RV systolic elastance was different using the systolic point of maximal pressure/volume ratio compared with the end-ejection point [12]; the end-ejection PV relationship being less correlated to the time varying elastance determined from linear regression of simultaneous acquired PV points in 3 different loading conditions. In the setting of PH, ejection occurs closer to peak pressure and the shape of beat to beat PV loops could approximates the LV [13, 14].


Fig. 15.2
(a–c) Basic representation of steady pressure-volume (PV−) loops with the right ventricular (RV) pressure in Y axis and RV volume in Y axis. (a) Representation of steady PV-loops in healthy (left panel) and chronic pressure overload (right panel) settings. End-systolic and end-diastolic points are represented in red. The peak pressure point during systole is represented in blue in both cases. The pulmonary arterial elastance (Ea) is the slope of the black line which represents the end-systolic pressure over stroke volume ratio. (b) Representation of multibeat RV-PV loops during inferior vena cava (IVC) occlusion in healthy (left panel) and chronic pressure overload (right panel). The RV end-systolic elastance (Ees) is the slope of the end-systolic pressure-volume relationship (ESPVR) determined from the multibeat PV-loops during IVC occlusion. (c) Integrative representation of PV-loops derived parameters, end-systolic pressure (ESP), ESPVR, Ees, Ea, end-diastolic pressure-volume relationship (EDPVR), stroke volume (SV) (Reproduced with permission from Laboratory of Surgical Research of the Marie Lannelongue Hospital)
Several assumptions of RV-PA coupling models were tested. The linear relationship of the beat to beat RV ESPVR was verified on isolated hearts by Maughan et al. [15], and in dogs by Karunanithi et al. [16]. Also in humans Dell’Italia et al. [12] and Brown et al. [17] reported linear relationship of ESPVR using time varying elastance, using steady PV-loops at baseline and during different loading conditions [12]. Currently, the slope of the linear relationship of ESPVR during beat to beat pre-load reduction is the most reported for quantification of multibeat RV ESPVR. The linear relationship of RV ESPVR derived from beat-to-beat analysis during acute load variation is shown in Fig. 15.2c. Another difference between RV- and LV-PV loops analysis is the determination of ventricular volumes that may not be as accurate in RV as in LV due to the crescent shape of the RV. If volume variations may be well calibrated using stroke volume determinations with external methods such as thermodilution or echocardiography, the calibration of absolute volume values may be more difficult at time of PV loops acquisition because based on ventricular shape. As a consequence, indices based on the accurate volume values such as end-diastolic volumes, end-systolic volumes and ejection fraction are not as well quantified as in left ventricles using RV PV-loops and external methods such as MRI have been used to address this issue [13, 14].
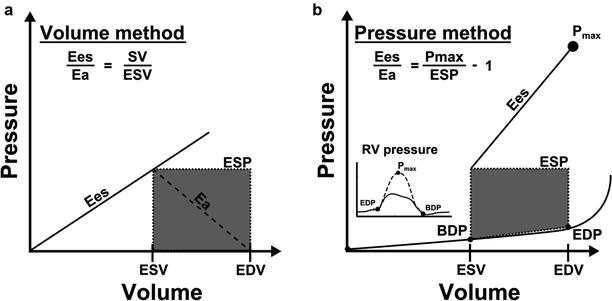
More recently, less invasively determined indices of RV-PA coupling have been described, either based on single beat PV-loops or base on imaging analysis [18] (Fig. 15.3).


Fig. 15.3
Illustration of two methods for RV-PA coupling determination using single beat PV-loops (a) A volume method, using the ratio mean pulmonary artery pressure (MPAP) to end-systolic volume (ESV) to measure Ees and the ratio MPAP to (EDV-ESV) to measure Ea; this method assumes end-systolic pressure = MPAP; (b) A pressure method using Pmax measurement or extrapolation from PA clamping or RV pressure curve; the ESP may be assimilated to MPAP (method 2) or to systolic RV pressure (sRVP) (method 3). (Reproduced from Rebecca et al. [18], with permission from BMJ Publishing Group Ltd.)
RV-PA Coupling – Which Applications?
One important question that emerges is what is the utility of measuring RV-PA coupling when more simple measures of ventricular function exist. Currently, PV loops analysis and RV-PA coupling analysis is mainly performed during pathophysiological studies or when comparing the effects of different therapeutic interventions in the experimental setting. In this context, the ability to determine the precise changes in metrics of contractility, load and coupling provides useful informations.
In the clinical setting, it is unclear whether measures of RV-PA coupling will bring additional prognostic information for the clinical care of patients with pulmonary arterial hypertension. Due to the invasive nature of multibeat PV-loops acquisitions, non-invasive surrogates of RV-PA coupling were evaluated. Recent animal studies have shown that common non-invasive measures of RV function such as RV ejection fraction (RVEF), fractional area change (RVFAC), tricuspid annular plane systolic excursion (TAPSE) or isovolumic acceleration (IVA) are more closely associated with ventriculo-arterial coupling than with RV contractility [19]. Interestingly, isovolumic indices such as the IVA are thought to be less load dependent [20] indices of contractility or coupling. As will be discussed in the next section, non-invasive single beat methods to estimate RV elastance and contractility have also been suggested. Thus, RV-PA coupling is not an esoteric concept but may rather be used daily in clinical practice in the future. Kuehne et al. validated in 2004 a single beat method for RV PV-loops acquisitions and RV-PA coupling quantification using RV catheterism for pressure measurement and MRI for volumes [21]. Sanz et al. more recently quantified the RV-PA coupling using a volumetric method with MRI using the ratio stroke volume over end-systolic volume [22]; a significant prognosis value of this indices was demonstrated in patients with PAH [23].
One important pearl to keep in mind is that metrics of systolic function used in clinical practice do not reflect contractility or the potential of recovery after unloading. Quantification of contractility and recovery potential may be more complex to measure than RV-PA coupling which is only a hemodynamic parameter. Useful measurement of ventricular contractility could require correction for cardiomyocyte quantity and metabolism to provide prognostic information. Recovery potential evaluation of a right ventricle could integrate contractility and RV-PA coupling parameters associated with others such as fibrosis and capillary content or metabolic changes [4]. Thus RV-PA coupling is a part of the RV phenotyping that should be used in addition to other parameters to provide information on contractility or recovery potential.
The transition from RV adaptation to RV maladaptation may be illustrated by coupling methods. The study of Kuehne et al. shows that RV-PA coupling in patients with PAH and without overt RV failure or enlargement may be decreased relative to normal controls. This observation suggests that decreased RV-PA coupling may precede RV dilation in patients with PH. In early stage pulmonary hypertension, decreased RV-PA coupling may mainly reflect the increase in RV afterload and potentially a failure from myocardial adaptation (i.e. insufficient augmentation of ventricular contractility); in end-stage pulmonary hypertension, continued worsening RV-PA coupling may reflect more a decrease in RV contractility resulting in the clinical development of RV failure.
Practical Aspects of PV-Loops Acquisition and Interpretation
This section describes practical aspects of standard PV-loops acquisition and interpretation used to determine Ees and Ea as well as less invasive single beat methods.
Signal Acquisition and Calibration
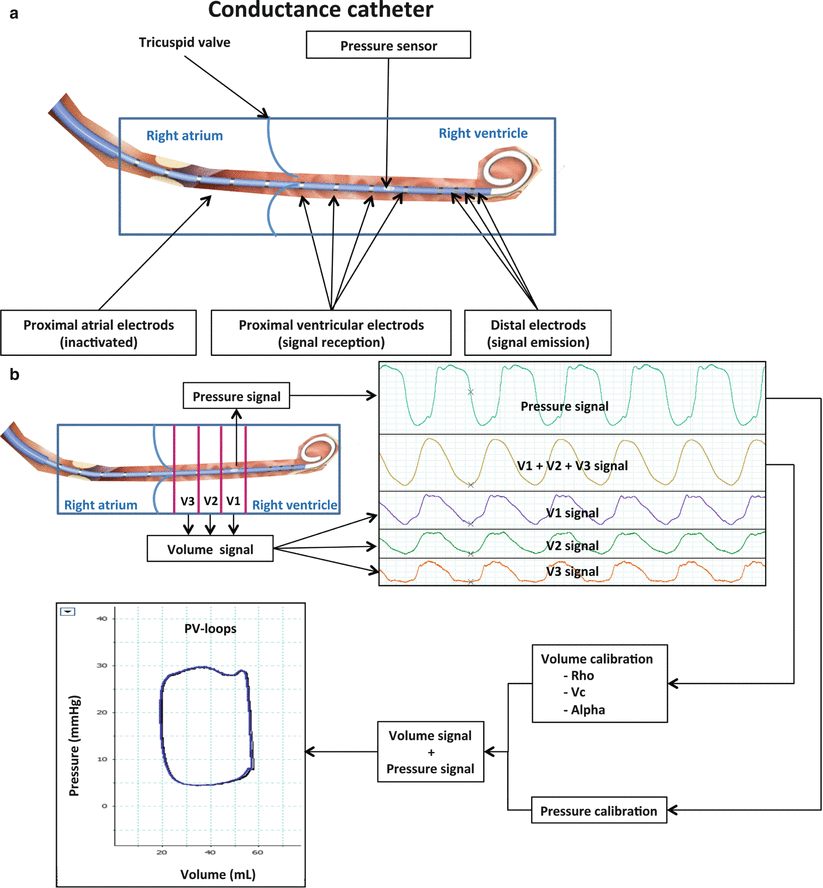
PV loops are acquired using a conductance catheter (Fig. 15.4a) allowing concomitant, continuous and high fidelity blood pressure and volume measurements into the ventricle. The ventricular pressure is continuously measured with a micromanometer. For volume signal acquisitions, a distal electrode of the catheter emits an electrical signal transmitted through the ventricular blood to different proximal electrodes situated into the ventricle creating an axial segmentation of the ventricle along the catheter axis (Fig. 15.4b). Each volume variation of a ventricular segment is continuously acquired and the global volume variation of the ventricle is represented as a sum of each segment volume. To determine the “real” volume values, volume calibration is usually performed in 3 steps including determination of blood electrical resistivity (Rho); determination of the parallel conductance volume (Vc) which represents the volume of conducting tissues surrounding the ventricular blood (myocardium and mediastinal tissues); finally the cardiac output or the SV quantified by the conductance catheter is corrected with a factor α which is determined from external methods of CO or SV determination (thermodilution, Fick method, echocardiography or magnetic resonance imaging) [24].


Fig. 15.4
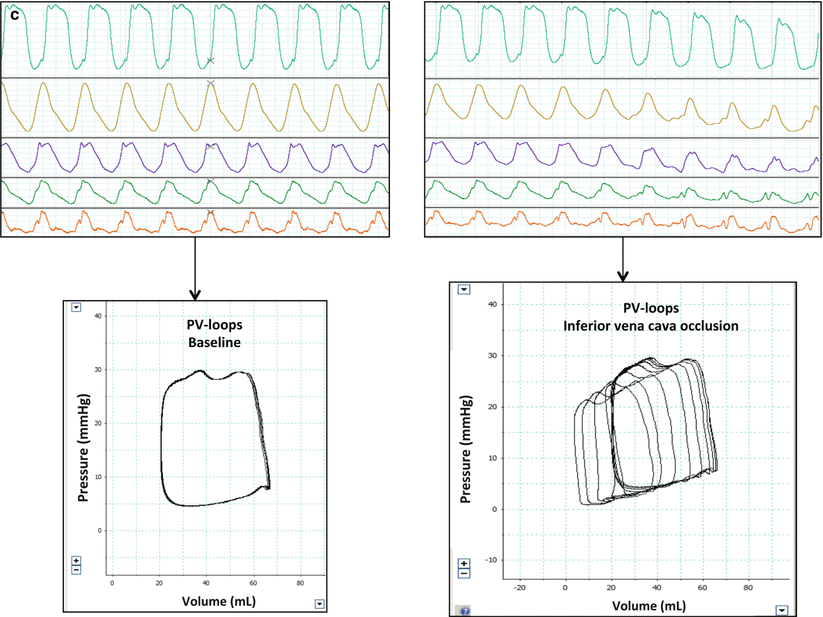
(a–c) Methodological and practical aspects of RV PV-loops acquisitions. (a) Conductance catheter represented in the right heart cavities (blue rectangle). Distal electods emits an electrical signal which is conducted by the ventricular blood and surrounding tissues, proximal electrods recept the electrical signal. The pressure sensor is a micromanometer that captures the pressure variations simultaneously with the volume signal derived from proximal electrods. Atrial proximal electrods are deactivated. (b) Step by step PV-loops acquisition. In the right upper corner, the conductance pressure and volume signals are transmitted a hardware and software unit providing real time pressure and volume signals (right upper corner). The pressure signal is the first lin (top, green line) and the second line (yellow) is the sum of the ventricular volume segments corresponding to cylindres between ventricular signal electrodes (V1, V2 and V3). In the right lower corner, volume and pressure calibration step. The volume calibration takes into account the blood electrical resistivity (Rho), the volume measured from electrical signal corresponding to tissues surrounding the ventricular blood (ventricle, mediastinum) referred as Vc (volume of the parallel conductance) and Alpha which is the ratio between the stroke volume measured from the conductance catheter and the volume measured simultaneously with an external method (echocardiography, thermodilution), it takes into account ventricular “dead space” of the ventricle not quantified with the conductance catheter such as the apex for example. (c) Final PV-loops used for interpretation after calibration steps. In the left panel, steady PV loops used to measure Ea for example: in the right panel, multibeat PV-loops during IVC occlusion used to measure Ees (slope of ESPVR) or β (curvature of EDPVR) (Reproduced with permission from Laboratory of Surgical Research of the Marie Lannelongue Hospital)
Procedure for PV-Loops Acquisition
The conductance catheter is placed into the right ventricle through a jugular or femoral vein and its position at the apex and parallel to the interventricular septum is verified using fluoroscopy. Then, the distal electrodes corresponding to ventricular signals are acquired and those, more proximal corresponding to atrial signals are deactivated. The atrial ventricular segments are recognized because being in inverted phase compared to the ventricle. After obtaining optimal counterclockwise ventricular PV-loops, pressure and volume calibration is performed (Fig. 15.4b). Finally PV-loops are recorded during end-expiratory periods during baseline conditions and during inferior vena cava occlusion (Fig. 15.4c) allowing beat-to-beat determination of PV-loops variations. The “steady loops” are used to determine Ea and the loops acquired during preload variation are used to determine Ees. Usually, 3 sets of IVC occlusions are performed and analyzed for internal quality control.
Single Beat Method Estimations
To obviate Ees quantification using IVC occlusion, different single beat methods were investigated that would estimate or extrapolate an ESPVR. We listed in the Table 15.1 the different methods that have been used in humans for PV-loops acquisitions, including single beat methods. In these methods, a “real” end-systolic PV point is determined in baseline condition. There are two main methods to determine a second theoretical point to draw an end-systolic pressure volume line [25]. The Pmax method is the most used in PAH and consists in determining maximal pressure point by extrapolation from the pressure signal (Pmax) or measured during pulmonary artery clamping during one beat. In this method the end-systolic elastance is the ratio (Pmax – end-systolic pressure)/SV (Fig. 15.3). The other single beat method is the maximal elastance method where the ESPVR corresponds to the ratio of the end systolic pressure over the end systolic volume (maxima pressure over volume ratio) and thus the extrapolated volume intercept is 0. This is often termed the volume method; this method was shown to be a poor estimate of contractility because of underestimation of Ees in sicker patients due to RV dilation [26]. There may be some advantages of the volume method, because of its ease of acquisition. Also, recent data suggest that this method to be sensitive to changes in clinical outcomes-mortality and/or transplant in patients with PAH [23].
Table 15.1
Listing methods used to create multibeat PV-loops to determine RV-PA coupling
Invasive | Non-invasive |
|---|---|
Pressure signal | |
Micromanometer Fluid-filled catheter | Echocardiography |
Volume signal | |
Conductance catheter Admittance catheter Myocardial markers Cineventriculography | MRI 3D echocardiography |
RV ESPVR slope determination | |
IVC occlusion | Valsalva maneuver Single beat method (Pmax) Single beat method (V0) |
Insights into Clinical and Experimental Pulmonary Hypertension Pathophysiology Using RV-PA Coupling Evaluation
RV-PA coupling evaluation has been used in several experimental and clinical studies providing insights into ventricular dynamics in PH including changes induced by increased RV afterload and effects of different therapeutics. Clinical studies mainly focused on RV adaptation to increased afterload in different PH groups using single beat methods. Therapeutic studies were mainly performed using animal models of acute and chronic PH, allowing evaluation of inotropic drugs and pulmonary vascular disease targeted therapies on RV-PA coupling. In animal models, RV-PA coupling evaluation provided also better characterization of the different PH models.
Changes in RV-PA Coupling with PH in Experimental and Clinical Studies
Experimental Models of PH
Table 15.2 summarizes changes in ventricular and arterial elastance as well as RV-PA coupling that were reported in the literature to characterize experimental models of acute and chronic PH. Wauthy et al. showed that RV-PA coupling was preserved after 10 min of acute hypoxia (PaO2 = 40 mmHg) due to proportional increase in Ea and Ees in 3 different species (pigs, goat and dogs) [27]. This study also highlighted different hemodynamic and myocardial responses to acute hypoxia between these species. Pigs showed a worse adaptation to hypoxia with a higher increase in Ea and Ees and no increase in cardiac output, whereas dogs seemed to adapt better with a higher increase of cardiac output and lower Ea and Ees increase; goat showed an intermediate response. Rex et al. confirmed these findings in pigs [28], in their study a twofold increase in MPAP (18–36 mmHg) induced by acute hypoxia (PaO2 = 40 mmHg) was associated with a significant decrease in stroke volume (47–31 mL, P < 0.05), a threefold increase in Ea (0.5–1.5 mmHg/mL) and a matched increase in Ees allowing RV-PA coupling to be preserved. The RV adaptation to acute pulmonary embolism was reported by Kerbaul et al. [29]. In their study, Ea increased up to six times baseline values associated with hemodynamic compromising above 4 time increased Ea baseline values. These studies highlight that the limits of the acute RV adaptation to an acute increase in afterload is due to limits in acute contractility reserve. In pig models evaluating the chronic RV adaptation to chronic pressure overload, RV-PA coupling seemed to be preserved after 3 months of systemic to pulmonary artery shunt [30, 31], whereas after 3 months of chronic PA occlusions, RV-PA coupling seem to be decreased [19]. Also Lambert et al. showed in a pig model of pulmonary valve regurgitation associated with PA banding in pigs that Ees increased up to 3 months then decreased between 3 and 4 months [32]. In rodent models, RV-PA coupling was preserved after 1 month of PH induced by sugen-hypoxia [33] or monocrotaline [34]; whereas chronic RV-PA coupling decreased in rats between 10 and 20 weeks after aorto-caval shunt creation [35]. Taken together, these studies suggest that the RV-PA coupling is more altered secondary to an acute and massive increase in pulmonary resistances; while slowly progressive and moderate increase in RV afterload allows RV-PA coupling preservation for weeks or months due to progressive RV adaptation. In most of the models, RV-PA coupling alteration was observed after a 3 months period of RV pressure overload. Chronic models including PA banding or occlusion seemed to show earlier decrease in Ees.
Table 15.2
RV-PA coupling characteristics of animal models of acute and chronic pulmonary hypertension
Authors (Table 15.1) | Animals | PH or RV failure model | Time of evaluation | MPAP or RVSP | Ees | Ea | Ees/Ea |
|---|---|---|---|---|---|---|---|
Acute models | |||||||
Kerbaul et al. [38] | dogs | Acute PA constriction | Minutes/hours | RVSP 31 ± 3 (mse, n = 8) | ↓ | ↑ | ↓ |
Rex et al.[28] | Pigs | Acute hypoxia
Stay updated, free articles. Join our Telegram channel
Full access? Get Clinical Tree
 Get Clinical Tree app for offline access

| |||||