Concentric left ventricular (LV) hypertrophy develops in response to a chronically increased LV afterload and is associated with increased cardiovascular events. Although the progression to systolic and diastolic heart failure is a known consequence of LV hypertrophy, few data are available on the frequency of deterioration to systolic dysfunction in patients with LV hypertrophy who originally had a normal LV ejection fraction. We evaluated the baseline and follow-up characteristics in 1,024 patients with concentric LV hypertrophy and a normal ejection fraction who had paired echocardiograms that were separated by ≥1 year. Systolic dysfunction occurred in 134 patients (13%) after a mean follow-up of 33 ± 24 months. The most common associated variable was interval myocardial infarction, which occurred in 43% of patients. Other risk factors for developing LV systolic dysfunction included QRS prolongation (>120 ms) and elevated follow-up arterial impedance defined as a value >4.0 mm Hg/ml/m 2 . Patients with either a prolonged QRS interval or an elevated follow-up arterial impedance had twice the likelihood of developing LV systolic dysfunction, and, if both factors were present, there was a greater than fourfold increased risk of developing systolic dysfunction. Blood pressure measurements alone did not adequately reflect an elevated arterial impedance. In conclusion, 13% of patients with a normal ejection fraction and concentric LV hypertrophy progress to systolic dysfunction during approximately 3 years of follow-up. The risk factors for loss of function were interval myocardial infarction, prolonged QRS, and chronically elevated arterial impedance.
Left ventricular (LV) hypertrophy develops as a target organ response to arterial hypertension and in response to other cardiovascular conditions that cause a chronic increase in LV afterload. Although LV hypertrophy might initially be considered beneficial by reducing LV wall stress, in the long term, LV hypertrophy is associated with an increase in most cardiovascular diseases, including heart failure, coronary heart disease, stroke, and sudden cardiac death. Abnormal LV geometry is associated with a poor cardiovascular prognosis, particularly with concentric LV hypertrophy. Although it is postulated that over time, patients with concentric LV hypertrophy and a normal ejection fraction (EF) can often progress to systolic dysfunction, there are scant data describing the frequency and predictors of what Osler described as “broken compensation” or a subsequent decrease in systolic function. We therefore sought to describe the frequency and associated risk factors for the development of LV dysfunction in patients who present with concentric LV hypertrophy and normal EF.
Methods
We retrospectively evaluated the echocardiographic and clinical data that were prospectively collected at the Ochsner Clinic Foundation during a 12-year period (June 1998 to June 2010) and maintained in a relational database (CardioVascular Information System). The inclusion criteria included a normal EF (≥50%), a United States residence, and the absence of significant aortic stenosis or mitral regurgitation. The survival status was obtained from the National Death Index in the entire cohort. From this group, we obtained a cohort of patients with concentric LV hypertrophy who had ≥2 echocardiographic examinations separated in time by ≥1 year. The institutional review board of the Ochsner Clinic Foundation approved the study.
Two-dimensional imaging examinations were performed in the standard fashion. End-diastolic LV dimensions were used to calculate the LV mass using an anatomically validated formula. LV hypertrophy was considered present when the LV mass index was >116 g/m 2 for men and >104 g/m 2 for women, as previously described. The relative wall thickness (RWT) was calculated as 2 × (posterior wall thickness in diastole)/(LV internal diameter). An increased RWT was present when this ratio was >0.430, represents the 97.5th percentile in normal subjects. Normal geometry was present when the LV mass index and RWT were normal. An increased RWT and normal LV mass index were classified as concentric remodeling, an increased LV mass index but normal RWT as eccentric LV hypertrophy, and increases of both variables as concentric LV hypertrophy. Systolic dysfunction was defined as an EF of <50%.
Systemic arterial pressure was measured at each echocardiogram using an arm cuff sphygmomanometer at the same time as the Doppler measurement of the stroke volume measured in the LV outflow tract. Although input impedance of the systemic circulation would offer a precise measurement of the LV afterload, its application is not feasible in practice. Alternatively, LV loading was evaluated by estimating the arterial impedance (IMP), which was approximated by the systolic arterial pressure/stroke volume index ratio. Systemic arterial compliance was estimated by the stroke volume divided by the pulse pressure.
Electrocardiograms were obtained within 3 months of the first echocardiogram. All electrocardiograms were recorded using a GE MAC 5000 (GE Healthcare, Milwaukee, Wisconsin). The 12-standard electrocardiographic leads were recorded simultaneously during spontaneous rhythm. The duration measurements pertaining to the QRS complex (QRS onset and offset), and the offset of the T wave were determined using data from all 12 leads.
Statistical analysis was performed using Statistical Package for Social Sciences, version 16.0 (SPSS, Chicago, Illinois). The results are expressed as the mean ± SD or numbers (percentage), as appropriate. The analysis of differences between groups was performed using Student’s t test for continuous variables, the chi-square test for categorical variables, and analysis of variance for differences among frequencies for several groups. Univariate Cox analysis was used to determine the potential predictive variables, and stepwise Cox regression analysis was used to develop a multivariate model. In all analyses, 2-sided p <0.05 was considered significant.
Results
A total of 1,024 patients met the inclusion criteria, of whom 57% were women, 58% were white, and 38% were black. The baseline characteristics are listed in Table 1 . With an average interval of 33 ± 24 months between echocardiograms (median 24 months), 134 patients (13%) demonstrated systolic dysfunction (mean EF 36 ± 11%). The baseline characteristics between the patients with stable EF and reduced EF are listed in Table 2 .
| Characteristic | Value |
|---|---|
| Age (years) | 67 ± 14 |
| Women | 57% |
| Black | 38% |
| Body mass index (kg/m 2 ) | 30.7 ± 7.5 |
| Heart rate (beats/min) | 71 ± 16 |
| Systolic arterial pressure (mm Hg) | 146 ± 26 |
| Diastolic arterial pressure (mm Hg) | 77 ± 15 |
| Pulse pressure (mm Hg) | 69 ± 21 |
| Left ventricular mass index (g/m 2 ) | 137 ± 119 |
| Relative wall thickness | 0.52 ± 0.11 |
| Ejection fraction (%) | 61 ± 6 |
| Systemic arterial compliance (ml/m −2 /mm Hg −1 ) | 0.63 ± 0.27 |
| Arterial impedance (mm Hg/ml/m 2 ) | 4.1 ± 1.4 |
| PR interval (ms) | 150 ± 71 |
| QRS duration (ms) | 101 ± 25 |
| Left bundle branch block | 1.8% |
| Right bundle branch block | 5.8% |
| QT interval (ms) | 405 ± 54 |
| Parameter | Stable EF (n = 890) | Reduced EF (n = 134) | p Value |
|---|---|---|---|
| Age (years) | 66 ± 14 | 69 ± 13 | 0.02 |
| Women | 59% | 43% | <0.0001 |
| Black | 36% | 39% | 0.005 |
| Body mass index (kg/m 2 ) | 30.8 ± 7.7 | 30.3 ± 6.0 | NS |
| Heart rate (beats/min) | 72 ± 16 | 69 ± 14 | 0.03 |
| Systolic arterial pressure (mm Hg) | 146 ± 27 | 145 ± 22 | NS |
| Diastolic arterial pressure (mm Hg) | 77 ± 16 | 77 ± 14 | NS |
| Pulse pressure (mm Hg) | 69 ± 21 | 68 ± 20 | NS |
| Left ventricular mass index (g/m 2 ) | 137 ± 29 | 139 ± 23 | NS |
| Relative wall thickness | 0.52 ± 0.11 | 0.50 ± 0.07 | 0.02 |
| Ejection fraction (%) | 62 ± 5 | 58 ± 6 | <0.0001 |
| Left ventricular end-diastolic diameter (cm) | 4.7 ± 0.5 | 4.9 ± 0.5 | 0.001 |
| Posterior wall thickness (cm) | 1.2 ± 0.15 | 1.2 ± 0.12 | NS |
| Systemic arterial compliance (ml/m −2 /mm Hg −1 ) | 0.63 ± 0.27 | 0.59 ± 0.25 | NS |
| Arterial impedance (mm Hg/ml/m 2 ) | 4.0 ± 1.4 | 4.3 ± 1.3 | 0.03 |
| PR interval (ms) | 148 ± 69 | 161 ± 77 | 0.09 |
| QRS duration (ms) | 100 ± 24 | 111 ± 30 | <0.0001 |
| Left bundle branch block | 1.3% | 5.2% | <0.0001 |
| Right bundle branch block | 5.3% | 9.7% | <0.0001 |
| QT interval (ms) | 403 ± 51 | 419 ± 66 | 0.004 |
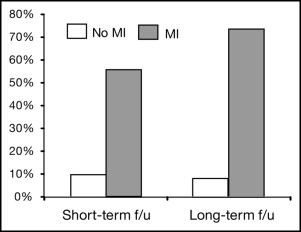
The patients with reduced EF developed interim myocardial infarction (MI) more frequently (42.5% vs 2.9%; p <0.0001) than did those with stable EF ( Table 3 ). The rate of progression to low EF in subjects without interval MI was 8%. The development of low EF is shown in subjects stratified by the length of follow-up (time split by the median follow-up duration) and by the incidence of interval MI ( Figure 1 ). Despite greater reductions in systolic, diastolic, and mean arterial pressure over time, patients with reduced EF had increased IMP (+9.3%; p <0.01) and showed a trend toward a reduction in arterial compliance (−1.7%) during the interval follow-up period, in contrast to the improvement in vascular hemodynamics (i.e., decreased IMP [−2.5%; p <0.01] and increase in arterial compliance [+7.9%; p <0.0001]) observed in patients with stable EF ( Figure 2 ). Patients with stable EF demonstrated significant reductions in the LV mass index (−16.8%; p <0.0001) but those with a reduced EF did not ( Figure 3 ).
| Parameter | Stable EF (n = 890) | Reduced EF (n = 134) | p Value |
|---|---|---|---|
| Ejection fraction (%) | 61 ± 5 | 36 ± 11 ⁎ | <0.0001 |
| Interim myocardial infarction (%) | 2.9 | 42.5 | <0.0001 |
| Change in mean arterial pressure (%) | −5.0 ⁎ | −9.1 ⁎ | 0.02 |
| Change in systolic blood pressure (%) | −5.5 ⁎ | −11.0 ⁎ | 0.02 |
| Change in diastolic blood pressure (%) | −3.9 ⁎ | −9.1 ⁎ | 0.07 |
| Change in arterial impedance (%) | −2.5 † | +9.3 † | <0.0001 |
| Change in systemic arterial compliance (%) | +7.9 ⁎ | −1.7 | <0.0001 |
| Change in left ventricular mass index (%) | −16.8 ⁎ | −2.2 | <0.0001 |
| Relative wall thickness at follow-up | 0.46 ± 0.12 | 0.41 ± 0.12 | <0.0001 |
| Change in relative wall thickness (%) | −11.5 ⁎ | −18.0 ⁎ | 0.001 |
| Change in left ventricular end-diastolic diameter (%) | +1.1 | +7.9 | 0.001 |
| Change in posterior wall thickness (%) | −12.0 | −14.6 | NS |
⁎ p <0.01 compared to baseline;