Chronic kidney disease (CKD) is associated with cardiovascular (CV) events caused by advanced atherosclerosis. Computed tomographic coronary angiography (CTA) can accurately diagnose coronary artery disease (CAD) and predict CV outcomes. The aim of the present study was to evaluate whether moderate CKD provides prognostic information for CV events in patients undergoing CTA. In total 885 patients with suspected CAD underwent CTA and were stratified to moderate CKD (85 patients) or no CKD (770 patients) based on a cut-off estimated glomerular filtration rate of 60 ml/min/1.73 m 2 . After 896 days of follow-up, 42 patients developed CV events. Annualized CV event rates were 1.2% in patients with no CKD and no CAD, 2.5% in patients with moderate CKD alone, 2.5% in patients with obstructive CAD alone, and 3.7% in those with moderate CKD and obstructive CAD. Multivariate models demonstrated that moderate CKD (hazard ratio 2.39, confidence interval 1.09 to 5.21, p = 0.03) and obstructive CAD (hazard ratio 2.76, confidence interval 1.40 to 5.44, p <0.01) were independent predictors of CV events. Importantly, moderate CKD provided incremental prognostic information in addition to clinical characteristics and obstructive CAD (chi-square 49.4, p = 0.04). In conclusion, moderate CKD was associated with CV events and provided incremental prognostic information.
Recently, computed tomographic coronary angiography (CTA) has emerged as an increasingly used technique for the diagnosis of significant coronary artery disease (CAD). Importantly, data are accumulating supporting the prognostic value of CTA to predict cardiovascular (CV) events. However, thus far the impact of decreased renal function on risk stratification has not been investigated in patients undergoing CTA. Therefore, the aim of the present study was to evaluate whether the presence of moderate chronic kidney disease (CKD) could provide additional prognostic information for CV events in patients undergoing CTA.
Methods
The study population consisted of 923 patients who underwent CTA for suspected CAD. Patients were enrolled at (1) the University of Zurich (Zurich, Switzerland) and (2) the Leiden University Medical Center (Leiden, the Netherlands) as part of an ongoing registry assessing the predictive value of CTA. Exclusion criteria included cardiac arrhythmias, renal insufficiency (defined as an estimated glomerular filtration rate [eGFR] <30 ml/min/1.73 m 2 ), known hypersensitivity to iodine contrast media, and pregnancy. Moreover, 38 uninterpretable scans were excluded for analysis (29 because of motion artifact/poor scan quality, 8 because of high coronary calcification leading to blooming artifact, and 1 because of nondiagnostic computed tomographic coronary angiographic stent image quality). The remaining 885 patients were included in the final analysis. In each patient presence of CAD risk factors was recorded. Diabetes mellitus was defined according to the World Health Organization criteria. Systemic hypertension was defined as systolic or diastolic blood pressure >140 or >90 mm Hg at rest, respectively, at 2 different clinical visits or prescription of antihypertensive medication. Hypercholesterolemia was defined as a fasting total plasma cholesterol level ≥4.9 mmol/L or prescription of medication. Obesity was defined by a body mass index >30 kg/m 2 .
Serum creatinine levels were used to assess eGFR calculated with the Modified Diet in Renal Disease Equation. To avoid contrast-induced renal dysfunction affecting the analysis, only serum creatinine levels obtained before computed tomographic coronary angiographic examination (up to 180 days before CTA) were used. Of note, patients with suspected acute renal failure (defined by an increase in serum creatinine ≥0.5 mg/dl in <2 weeks or an increase >20% above baseline if baseline serum creatinine was ≥2.5 mg/dl) were excluded.
The definition of moderate CKD was based on the recommendation from the National Kidney Foundation using an eGFR from 30 to 59 ml/min/1.73 m 2 . Mean duration from renal function assessment to CTA was 39 ± 12 days.
Examinations were performed using a 320-row computed tomographic coronary angiographic scanner (Aquilion One, Toshiba Medical Systems, Otawara, Japan) in 97 patients (11%) or a 64-row computed tomographic coronary angiographic scanner (Lightspeed VR 64, General Electrics, Milwaukee, Wisconsin; or Aquillion 64, Toshiba Medical Systems, Tokyo Japan) in 758 patients (89%). Patients’ heart rate and blood pressure were monitored before each computed tomographic coronary angiographic scan. In the absence of contraindications patients with a heart rate >65 beats/min were administered β-blocking medication (metoprolol 50 to 100 mg orally or 5 to 10 mg intravenously) for heart rate optimization. If tolerated, sublingual nitroglycerin (0.4 or 0.8 mg sublingually) was administered 5 minutes before examination. A description of all scan parameters has been published previously. To prevent contrast-induced nephropathy, strict precautions were implemented including adequate hydration before and after the procedure and cessation of nephrotoxic medication 1 day before and after contrast administration. None of the studied patients developed contrast-induced nephropathy as defined by a 25% increase in baseline serum creatinine that occurred within 48 hours after contrast exposure.
Postprocessing of coronary calcium score and computed tomographic coronary angiogram was performed on dedicated workstations (Vitrea 2, Vital Images, Minneapolis, Minnesota; or Advantage, GE Healthcare, Waukesha, Wisconsin). Coronary calcium score was calculated using the Agatston score method. Coronary anatomy was assessed in a standardized method by dividing coronary arteries into 17 segments according to the modified American Heart Association classification. Computed tomographic coronary angiographic results were defined as no obstructive CAD (<50% luminal narrowing) or obstructive CAD (≥50% luminal narrowing).
Follow-up data were collected by clinical visits or standardized telephone interviews. A combined CV end point was defined as nonfatal myocardial infarction, cerebrovascular accident, and all-cause mortality. Nonfatal myocardial infarction was defined based on criteria of typical angina, increased cardiac enzyme levels, and typical changes on electrocardiogram.
Continuous variables are presented as mean ± SD and were compared using Student’s t test or Wilcoxon rank-sum test as appropriate. Categorical data are presented as frequency and percentage and were compared using chi-square or Fisher’s exact test if ≥1 cell had an expected cell count <5. Cox regression model and a stepwise elimination approach were adopted to determine independent predictors of combined events. Factors including gender, age, CV risk factors (diabetes, hypercholesterolemia, hypertension, current smoking, and obesity with body mass index >30 kg/m 2 ), presence of obstructive CAD, and moderate CKD were entered in the model. The least significant variable was removed each time until all remaining variables in the model had a p value <0.1. All statistical analyses were performed using SPSS 15.0 for Windows (SPSS, Inc., Chicago, Illinois). A p value <0.05 was considered statistically significant.
Results
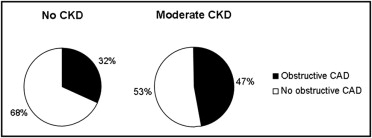
Baseline characteristics of the patient population are listed in Table 1 . Patients with moderate CKD were more likely to be older, men, obese, and have a history of hypertension. Of the entire study population, 67% of patients had no obstructive CAD and 33% had obstructive CAD. Patients with moderate CKD had more atherosclerosis as evidenced by a higher incidence of obstructive CAD compared to those without CKD ( Figure 1 ) .
| Variables | All (n = 855) | CKD | p Value | |
|---|---|---|---|---|
| No (n = 770) | Yes (n = 85) | |||
| Age (years) | 57 ± 12 | 57 ± 12 | 65 ± 11 | <0.01 |
| Men | 465 (55.8%) | 430 (55.8%) | 35 (58.8%) | 0.01 |
| Mean estimated glomerular filtration rate (ml/min/1.73 m 2 ) | 84.4 ± 21.2 | 88.2 ± 18.6 | 50.8 ± 9.9 | 0.01 |
| Diabetes mellitus | 255 (29.8%) | 234 (30.4%) | 21 (24.7%) | 0.32 |
| Hypertension | 442 (51.7%) | 382 (49.6%) | 60 (70.6%) | <0.01 |
| Hypercholesterolemia | 351 (41.1%) | 314 (40.8%) | 37 (43.5%) | 0.64 |
| Current smoker | 209 (24.4%) | 194 (25.2%) | 15 (17.6%) | 0.14 |
| Obesity | 175 (20.5%) | 149 (19.4%) | 26 (30.6%) | 0.02 |
| Previous myocardial infarction | 99 (11.6%) | 89 (11.6%) | 10 (11.8%) | 1.00 |
| Previous percutaneous coronary intervention | 111 (13.0%) | 100 (13.0%) | 11 (12.9%) | 1.00 |
| Coronary calcium score | 297 ± 761 | 216 ± 582 | 567 ± 1,089 | 0.04 |
Median follow-up was 896 ± 353 days (twenty-fifth to seventy-fifth percentiles 622 to 1,197). The composite end point occurred in 42 patients (5%), with nonfatal myocardial infarction in 22 patients, cerebrovascular accident in 6, and all-cause mortality in 14 patients (11 cardiovascular causes including 5 myocardial infarctions, 3 cerebrovascular accidents, and 3 heart failures; 3 were due to sepsis). A significant higher incidence of CV events was noted in patients with moderate CKD compared to patients without CKD (4.3% vs 10.9%, p = 0.03). Annualized CV event rate was 2.0% in the total population. Annualized CV event rates of patients with and without moderate CKD were 1.6% and 3.1%, respectively.
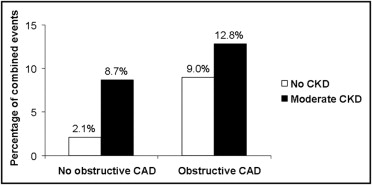
Across the 2 renal function groups, significantly higher CV event rates were noted in patients with obstructive CAD compared to patients without obstructive CAD ( Figure 2 ) . Of all groups of patients, the largest number of CV events occurred in patients with obstructive CAD and moderate CKD. Annualized CV event rates of patients without obstructive CAD were 1.2% and 2.5% for patients without CKD and for patients with moderate CKD, respectively. In patients with obstructive CAD, corresponding annualized event rates were 2.5% (no CKD) and 3.7% (moderate CKD), respectively.
Cox proportional hazard models were used to evaluate the impact of computed tomographic coronary angiographic results and renal function on CV events ( Table 2 ). Univariate analysis showed that older age, current smoking, and presence of obstructive CAD and moderate CKD were associated with CV events. Multivariate models demonstrated that obstructive CAD and moderate CKD were independent predictors of CV events.
| Univariate | Multivariate | |||||
|---|---|---|---|---|---|---|
| HR | 95% CI | p Value | HR | 95% CI | p Value | |
| Age | 1.04 | 1.01–1.07 | <0.01 | |||
| Male gender | 1.26 | 0.68–2.38 | 0.45 | |||
| Diabetes mellitus | 0.96 | 0.52–1.99 | 0.96 | |||
| Hypertension | 1.29 | 0.71–2.37 | 0.41 | |||
| Hypercholesterolemia | 1.28 | 0.68–2.40 | 0.45 | |||
| Current smoker | 2.68 | 1.46–4.92 | <0.01 | 2.80 | 1.47–5.33 | <0.01 |
| Obesity | 3.17 | 0.98–10.23 | 0.054 | |||
| Previous myocardial infarction | 2.00 | 0.98–4.08 | 0.06 | 3.50 | 1.22–9.98 | 0.02 |
| Previous percutaneous coronary intervention | 0.92 | 0.41–2.08 | 0.84 | 3.61 | 1.10–11.90 | 0.04 |
| Obstructive coronary artery disease on computed tomographic coronary angiogram | 3.51 | 1.87–6.58 | <0.01 | 2.76 | 1.40–5.44 | <0.01 |
| Moderate chronic kidney disease | 2.31 | 1.10–4.83 | 0.03 | 2.39 | 1.09–5.21 | 0.03 |
Stay updated, free articles. Join our Telegram channel

Full access? Get Clinical Tree


