The levels of N-terminal pro B-type natriuretic peptide (NT-proBNP) are closely related to cardiac abnormalities and adverse outcomes in the general population. However, little is known about the course of NT-proBNP levels over time, the underlying conditions, and the prognostic effect of changes. To investigate these issues, we measured the NT-proBNP levels (Elecsys 2010, Roche Diagnostics) in community-dwellers participating in the Prospective Investigation of the Vasculature in Uppsala Seniors study at 70 (n = 1,005) and 75 (n = 817) years of age. The total follow-up was 8.0 years. In subjects with available results from both examinations, the median NT-proBNP levels increased from 106 pg/ml (25th to 75th percentile 62 to 174) to 125 pg/ml (25th to 75th percentile 73-234; p <0.001). The change in NT-proBNP levels was positively and independently related to male gender, baseline information on ischemic electrocardiographic changes, renal dysfunction, impaired left ventricular ejection fraction, and intercurrent cardiovascular events (e.g., myocardial infarction, stroke, or coronary revascularization). The change in NT-proBNP levels independently predicted mortality after the measurements at 75 years of age (all-cause mortality, adjusted hazard ratio 2.4, 95% confidence interval 1.6 to 3.6; cardiovascular mortality, adjusted hazard ratio 2.3, 95% confidence interval 1.2 to 4.5). Compared to those without significant NT-proBNP changes (n = 606), subjects with increasing levels (n = 162) had markedly increased all-cause mortality (adjusted hazard ratio 4.3, 95% confidence interval 2.1 to 8.8). No subject with decreasing NT-proBNP levels (n = 49) died. In conclusion, repeat measurements of NT-proBNP might add useful information to the routine clinical assessment in subjects aged ≥70 years, because changes in their levels were associated with cardiovascular risk indicators and strongly predictive of mortality.
Measurement of B-type natriuretic peptide (BNP) levels has gained much interest for population screening regarding cardiac disease. However, the utility of BNPs is not undebated, in part because data are limited on the course of their levels over time and the prognostic implications of any changes. Moreover, the underlying conditions related to changes in community populations have not yet been assessed. The present longitudinal study investigated these issues in a fairly large sample of subjects in whom the N-terminal pro-BNP (NT-proBNP) levels had been measured at both 70 and 75 years of age.
Methods
The primary aim of the Prospective Investigation of the Vasculature in Uppsala Seniors (PIVUS) study was to investigate the mechanisms of endothelial function in the elderly. All subjects aged 70 years who were living in Uppsala, Sweden were eligible for participation. The potential study participants were randomly chosen from the registry of community inhabitants. Of the 2,025 subjects invited, 1,016 agreed to participate in the study, and 826 (85.7% of all survivors) participated in the follow-up examinations scheduled after 5 years. All participants provided written informed consent. The local ethics committee approved the study protocol, which complies with the Declaration of Helsinki.
NT-proBNP was measured in frozen ethylenediaminetetraacetic acid plasma samples using the Elecsys proBNP sandwich immunoassay on an Elecsys 2010 instrument (Roche Diagnostics, Mannheim, Germany). The intra-assay imprecision of this assay is <10% across the analytical range of 5 to 35,000 pg/ml. C-reactive protein was determined on an Architect ci8200 analyzer (Abbott Laboratories, Abbott Park, Illinois). The glomerular filtration rate was estimated according to the 4-variable Modification of Diet in Renal Diseases equation.
The change in NT-proBNP levels from 70 to 75 years of age was defined first, as the absolute difference between ln-transformed levels at both measurements. The change criterion defined by this function was chosen, because it approximated a normal distribution to a greater extent than other relative or absolute change criteria (Shapiro-Wilk statistic 0.95). Second, we defined different change patterns considering the biological variability of NT-proBNP in healthy populations : (1) decreasing: change in NT-proBNP levels ≤−50%; (2) increasing: change in NT-proBNP levels ≥+100%; and (3) unchanged: change in NT-proBNP levels between −49% and +99%.
Echocardiography was performed with an Acuson XP124 cardiac ultrasound unit, as described previously. The left ventricular (LV) volumes were calculated according to the Teichholz method, and, from that, the LV ejection fraction was determined. The LV mass index was calculated according to the recommendations of the American Society of Echocardiography.
The predictors of the baseline NT-proBNP levels were identified by linear regression analysis. The tested covariates included gender, hypertension (blood pressure >140/90 mm Hg at rest or antihypertension treatment), diabetes (fasting blood glucose >6.1 mmol/L or antidiabetic treatment, including diet), high-density lipoprotein cholesterol, low-density lipoprotein cholesterol, current smoking, previous smoking, body mass index, ischemic electrocardiographic (ECG) changes (the presence of ST-segment depression [Minnesota codes 4-1 and 4-2], T-wave inversion [Minnesota codes 5-1, 5-2 or 5-3], pathologic Q waves [Minnesota code 1-1], or left bundle branch block [Minnesota code 7-1] on a conventional 12-lead electrocardiogram ), previous myocardial infarction, self-reported heart failure, previous coronary revascularization, previous stroke, C-reactive protein, estimated glomerular filtration rate, LV mass index, and LV ejection fraction. If necessary, we ln-transformed continuous variables to achieve a normal distribution. The adjusted multiple linear regression analyses included all covariates demonstrating a univariate association with NT-proBNP (ln) at p ≤0.10. The predictors of changes in NT-proBNP levels were identified using the same approach, additionally adjusting for NT-proBNP (ln) at baseline and intercurrent cardiovascular events (defined as myocardial infarction, stroke, or coronary revascularization occurring between the examinations at baseline and 5 years of follow-up).
The primary outcome examined in the present analysis was all-cause mortality until the censor date at the end of December 2011. In the secondary analyses, we also assessed the association of NT-proBNP to cardiovascular mortality. Information on mortality was obtained for all study participants from the Swedish Registry on Mortality and the medical records for Uppsala County. The prognostic value of NT-proBNP (ln) and its changes over time were assessed using Cox proportional hazard models adjusting for established cardiovascular risk indicators (i.e., gender, hypertension, diabetes, high-density lipoprotein cholesterol, low-density lipoprotein cholesterol, current smoking, body mass index, previous cardiovascular disease [history of myocardial infarction, stroke, or coronary revascularization]), C-reactive protein (ln), and the estimated glomerular filtration rate (ln). The models assessing the prognostic implications of changes in NT-proBNP levels applied the same set of covariates, including NT-proBNP (ln) at baseline. In a subanalysis, the prognostic importance of different change patterns were investigated with respect to baseline NT-proBNP levels <201 or >201 pg/ml, considering that the changes might have different implications, depending on the baseline concentration. The 201 pg/ml threshold was the NT-proBNP concentration maximizing the sensitivity and specificity for the prediction of all-cause mortality. Kaplan-Meier curves were constructed to illustrate the timing of events. The incremental value of NT-proBNP to a risk model based on established cardiovascular risk indicators was investigated by calculating the c-statistic with a comparison of differences using the method described by DeLong et al. In addition, the integrated discrimination improvement was assessed, as described by Pencina et al.
Continuous variables are described as the median and 25th and 75th percentiles or mean ± standard deviation. The Mann-Whitney U test or 1-way analysis of variance was used for between-group comparisons of continuous variables, as appropriate. The Wilcoxon signed rank test was applied for within-group comparisons of continuous variables. The correlations between continuous variables are described by Spearman rank correlation coefficients. Categorical variables are expressed as frequencies and percentages, with the differences analyzed using the chi-square test. In all tests, a 2-tailed p value <0.05 was considered significant. The software packages SPSS, version 19.0 (SPSS, Chicago, Illinois), and Stata, version 11 (StataCorp, College Station, Texas), were used for statistical analysis.
Results
The NT-proBNP levels were available for 1,005 study participants at baseline. The levels ranged from 6 to 14,984 ng/L (median 111 pg/ml, 25th to 75th percentiles 65 to 183). The clinical characteristics of the sample population and the univariate associations of the clinical variables to the baseline NT-proBNP levels (ln) are listed in Table 1 .
| Clinical Characteristic | Value | β Value | R 2 Value | p Value |
|---|---|---|---|---|
| Men | 502 (50.0%) | −0.126 | 0.016 | <0.001 |
| Hypertension | 724 (72.0%) | 0.125 | 0.016 | <0.001 |
| Diabetes mellitus | 115 (11.4%) | 0.051 | 0.003 | 0.11 |
| Current smoker | 108 (10.7%) | 0.105 | 0.011 | 0.001 |
| Previous smoker | 415 (41.3%) | −0.003 | 0.000 | 0.93 |
| Body mass index (kg/m 2 ) | 27.1 ± 4.3 | −0.057 | 0.003 | 0.07 |
| Ischemic electrocardiographic changes | 171 (17.1%) | 0.294 | 0.086 | <0.001 |
| Previous myocardial infarction | 67 (6.7%) | 0.237 | 0.056 | <0.001 |
| Self-reported heart failure | 35 (3.5%) | 0.161 | 0.026 | <0.001 |
| Previous coronary revascularization | 54 (5.4%) | 0.215 | 0.046 | <0.001 |
| Previous stroke | 34 (3.4%) | 0.161 | 0.026 | <0.001 |
| High-density lipoprotein cholesterol (mg/dl) | 58.4 ± 16.4 | −0.013 | 0.000 | 0.67 |
| Low-density lipoprotein cholesterol (mg/dl) | 130.5 ± 34.0 | −0.088 | 0.008 | 0.005 |
| C-reactive protein (mg/L) | 1.2 (0.6–2.3) | 0.110 | 0.012 | 0.001 |
| Estimated glomerular filtration rate (ml/min/1.73 m 2 ) | 79.0 (65.5–95.0) | −0.145 | 0.021 | <0.001 |
| Echocardiographic data (n = 827) | ||||
| Left ventricular ejection fraction (%) | 66.6 ± 8.0 | −0.288 | 0.083 | <0.001 |
| Left ventricular mass index (g/m 2 ) | 92.9 ± 26.8 | 0.244 | 0.060 | <0.001 |
| Left ventricular end-diastolic diameter (mm) | 47.0 ± 5.5 | 0.147 | 0.020 | <0.001 |
The results for NT-proBNP at 5 years of follow-up (5.1 ± 0.1 years from the baseline examinations) were available for 817 study participants. None of them had experienced an intercurrent cardiovascular event within the 28 days preceding the follow-up visit. Considering the baseline characteristics, the follow-up participants had a lower prevalence of diabetes than the subjects not participating in the 5-year follow-up examinations (n = 84 [10.3%] vs n = 31 [16.5%]; p = 0.02), were less often smokers (n = 73 [8.9%] vs n = 35 [18.6%]; p <0.001) and had a lower median LV mass index (87.8 vs 93.8 g/m 2 ; p = 0.02 [n = 827]). The other baseline characteristics presented in Table 1 did not differ between the 2 cohorts.
The NT-proBNP levels at baseline and 5 years of follow-up correlated strongly (r = 0.72, p <0.001) in subjects with results available from both measurements. The median levels increased from 106 pg/ml (25th to 75th percentile 62 to 174) at baseline to 125 pg/ml (25th to 75th percentile 73 to 234) at 5 years of follow-up (p <0.001). In men, the levels increased from 88 pg/ml (25th to 75th percentile 50 to 150) to 118 pg/ml (25th to 75th percentile 63 to 286; p <0.001). In women, the levels increased from 123 pg/ml (25th to 75th percentile 79 to 191) to 133 pg/ml (25th to 75th percentile 83 to 217; p = 0.002). This corresponded to relative increases of +34% in men versus +7% in women (p <0.001). Applying our predefined criteria, 162 subjects (19.8%) had increasing levels (i.e., ≥+100%), 606 subjects (74.2%) had unchanged levels (i.e., −49% to +99%), and 49 subjects (6.0%) had decreasing levels (i.e., ≤−50%). By multiple linear regression analysis using the absolute difference between NT-proBNP levels (ln) at baseline and at 5 years of follow-up as the dependent variable, male gender, ischemic ECG changes, poorer renal function, and a lower LV ejection fraction were independently related to increasing NT-proBNP levels ( Table 2 ; models 1 and 2). Similar findings emerged when increases in NT-proBNP levels were defined by our change criteria ( Supplemental Table ). In contrast, none of the assessed clinical variables independently predicted decreasing NT-proBNP levels (data not shown). In accordance with the more pronounced increases in men, we noted a trend toward a less distinct association between NT-proBNP (ln) and female gender over time (baseline, β = 0.147, p <0.001; 5-year follow-up, β = −0.034, p = 0.63). A total of 71 subjects (8.7%) experienced an intercurrent cardiovascular event between baseline and the 5-year follow-up visit (men, 44 of 404 [10.9%] vs women, 27 of 413 [6.5%]; p = 0.03). When added to the linear regression analysis, intercurrent cardiovascular events emerged as an independent predictor of increasing NT-proBNP levels, while the associations with the other covariates remained unchanged ( Table 2 ; model 3).
| Clinical Variable | Model 1 (n = 814) | Model 2 (n = 681) | Model 3 (n = 814) | |||
|---|---|---|---|---|---|---|
| β | p Value | β | p Value | β | p Value | |
| Men | 0.194 | <0.001 | 0.187 | <0.001 | 0.187 | <0.001 |
| High-density lipoprotein cholesterol | 0.013 | 0.72 | 0.020 | 0.61 | 0.021 | 0.56 |
| Diabetes mellitus | 0.036 | 0.30 | 0.038 | 0.31 | 0.030 | 0.39 |
| Ischemic electrocardiographic changes | 0.078 | 0.03 | 0.066 | 0.10 | 0.073 | 0.04 |
| Estimated glomerular filtration rate (ln) | −0.118 | 0.001 | −0.106 | 0.004 | −0.122 | <0.001 |
| Left ventricular ejection fraction | — | — | −0.113 | 0.003 | — | — |
| Left ventricular mass index | — | — | 0.033 | 0.79 | — | — |
| Intercurrent cardiovascular events | — | — | — | — | 0.104 | 0.002 |
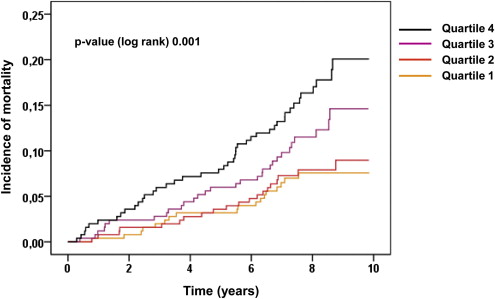
During the total follow-up period (median 8.0 years, 25th to 75th percentile 7.1 to 8.9), 111 subjects (11.0%) died. Cardiovascular death occurred in 37 subjects (3.7%). The incidence of all-cause mortality in relation to the quartiles of NT-proBNP is illustrated in Figure 1 . The c-statistic of NT-proBNP regarding all-cause mortality was 0.61 (95% confidence interval [CI] 0.58 to 0.64), with 201 pg/ml as the optimal prognostic threshold. The baseline NT-proBNP level (ln) independently predicted all-cause mortality and reached borderline significance regarding cardiovascular mortality ( Table 3 ). When added to a model based on established cardiovascular risk indicators, the baseline NT-proBNP level did not provide significant prognostic increment regarding all-cause mortality (c-statistic +0.006, p = 0.41; integrated discrimination improvement, 0.003, p = 0.25) or cardiovascular mortality (c-statistic +0.029, p = 0.07; integrated discrimination improvement, 0.008, p = 0.10).