and Mark C. Mammel2, 3
(1)
Division of Neonatal-Perinatal Medicine, C.S. Mott Children’s Hospital University of Michigan Health System, Ann Arbor, MI, USA
(2)
Neonatal Medicine, Children’s Hospitals and Clinics of Minnesota, St. Paul, St. Paul, MN, USA
(3)
University of Minnesota, Minneapolis, MN, USA
Keywords
Pulmonary mechanicsPressure waveformFlow waveformHeated wire anemometerNeonatal mechanical ventilators1.1 Introduction
For nearly a quarter of a century, newborns requiring mechanical ventilation were managed primarily by clinical means, supplemented with intermittent laboratory data provided by blood gas analysis and chest radiography. Little was known about pulmonary mechanics or the interactions between the baby and the ventilator. During this era, the “gold standard” of pulmonary mechanics, incentive spirometry, had no practical utility in the neonatal population.
Early attempts to bring pulmonary function testing to the neonatal intensive care unit (NICU) were equally frustrating. The equipment was extraordinarily cumbersome, required painstaking calibration, and often provided data that were not interpretable. Major advances in technology in the mid-1980s ushered in the era of the practical portable computer, allowing for the first time bedside evaluation of gas flow patterns with simultaneous pressure and volume waveforms in critically ill newborns. Because these devices were stand-alone, and not incorporated into the ventilators themselves, the technique was limited to intermittent sampling, because the devices had to be taken from bed to bed and could not be used continuously. By the early 1990s microprocessor-based ventilation, as well as the introduction of real-time pulmonary graphics, made continuous monitoring and tracking of both pulmonary mechanics and trends possible. For the first time, neonatal clinicians were able to see breath-to-breath displays of pulmonary waveforms and “loops,” to have the benefits of data trending and storage, and to objectify the results of treatments with narrow therapeutic indices.
1.2 Principles of Pulmonary Graphics
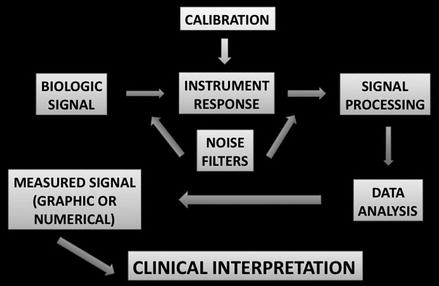
Pulmonary graphic monitoring systems are composed of multiple units that work together to create a visual or numerical display. Figure 1.1 demonstrates a schematic diagram of the key components.