2 Principles of Defibrillation
From Cellular Physiology to Fields and Waveforms
Electrical defibrillation is the only practical means for halting ventricular fibrillation (VF). Although it has been known for more than a century that application of an electric shock directly to the myocardium causes VF, and that the heart can be returned to normal rhythm by subsequent application of a shock of greater magnitude,1–3 knowledge of the mechanisms underlying the process of defibrillation was slow in developing. Only the introduction of novel techniques for the analysis of action potentials and activation sequences has allowed greater insight into the physiology of both fibrillation and defibrillation.4–8 It is hoped that this insight will result in a higher success rate for external defibrillation and improved design of implantable cardioverter-defibrillators (ICDs).
A large part of current research is dedicated to determining the underlying reason for the success or failure of a defibrillating shock. VF is maintained by multiple activation fronts that are constantly moving in a pattern of reentry. Characteristics of the activation pattern and action potential are believed to be important determinants of whether a shock will successfully defibrillate the heart. A successful defibrillating shock is believed to extinguish most of these activation fronts, permitting the resumption of coordinated responsiveness.9–13 For the defibrillating shock to be completely successful, this must be accomplished without creating an environment that promotes susceptibility to reinitiation of fibrillation.9,10 It has been established that successful defibrillation requires that the shock results in adequate distribution of the potential gradient (a surrogate for local current flow) throughout the ventricular myocardium.14–16
Fundamentally, defibrillation is believed to be realized through an electrical pulse that causes an alteration in the transmembrane potential of myocytes. It most likely requires a rapid induction of changes in the transmembrane potential of the myocytes in a critical mass of myocardium (75%-90% of myocardium in dogs).13,14,16 Because this represents a large mass of tissue, depolarization must be achieved at a considerable distance from the stimulating electrode. To gain an understanding of this complex far-field process, various mathematical models have been generated and predictions of computer simulations compared with physiologic findings. Both discontinuities in the anisotropic properties of the extracellular and intracellular domains, as described by the bidomain model,17,18 and highly resistive discontinuities in the intracellular space (e.g., collagenous septa), as described in the secondary source model,19–21 may contribute to the far-field changes in the potential gradient that halt the activation fronts of fibrillation; these are discussed later.
The mechanisms underlying degeneration into fibrillation in failed shocks remain incompletely understood. Residual wandering wavelets,22 nonuniform refractoriness,23 and areas of low potential gradient, in which critical points (centers of reentrant circuits) form,15 may be the sources of propagating wavefronts that can result in fibrillation through reentry. Centrifugal propagation from ectopic foci induced by the defibrillation shock may also play a role, especially in the atrium.10
 Fibrillation
Ventricular fibrillation has been characterized as progressing through four stages, based on high-speed cinematography of electrically induced fibrillation in dog hearts24 (Fig. 2-1). A brief undulatory, or tachysystolic, stage lasting only 1 to 2 seconds occurs first. It is characterized by three to six undulatory contractions that resemble a series of closely occurring systoles and involve the sequential contraction of large areas of the myocardium. This is followed by a second stage of convulsive incoordination (15-45 seconds) during which more frequent waves of contraction sweep over smaller regions of the myocardium. Because the contractions in each region are not in phase, the ventricles are pulled in a convulsive manner. It is during this stage of fibrillation that the ICD shocks are given, about 10 to 20 seconds after the onset of fibrillation. In the third stage of tremulous incoordination, the independently contracting areas of the ventricular surface become even smaller, giving the heart a “trembling” appearance. Tremulous incoordination lasts for 2 to 4 minutes, before the fourth and final stage of atonic fibrillation occurs. Atonic fibrillation develops within 3 to 5 minutes after the onset of fibrillation and is characterized by the slow passage of feeble contraction wavelets over short distances. With time, the number of quiescent areas increases. Ischemia plays a role in the development of the third and fourth stages, because the fibrillating heart remains in the second stage if the coronary arteries are perfused with oxygenated blood.25,26
Driving the mechanical activity of the heart during fibrillation is the electrical activity of the myocardium. The electrical activity of the heart during fibrillation has been studied using both extracellular and optical recordings. Several groups have suggested that fibrillation is maintained by reentry. In most cases, reentry appears to be caused by “wandering wavelets” of activation, activation fronts that follow continually changing pathways from cycle to cycle. In some studies, the activation sequence appears moderately repeatable from cycle to cycle, following approximately the same pathway.27–29 Occasionally, a spiraling pattern of functional reentry emanates from the same region for several cycles. Sometimes, the central core of these spiral waves meanders across the heart.5 At other times, new reentrant activation fronts are generated when one front interacts with another during its vulnerable period.
Study of VF suggests that there is a level of organization to the seemingly random patterns of wandering wavelets. Two competing hypotheses have been proposed to explain this organization. The “mother rotor” hypothesis was first proposed by Lewis30 in 1925 and revived in 1996 by Gray and Jalife.31 This hypothesis proposes that a single, stationary reentrant circuit (or mother rotor), located in the fastest-activating region of the heart, “drives” VF by giving rise to activation fronts that propagate throughout the remainder of the myocardium.29 These wavefronts propagate away from this fast-activating region, encounter areas of unidirectional block, and break up into smaller, slower-moving waveforms that resemble Wiggers’ wandering wavelets. Experiments best demonstrating the “mother” rotor have been performed in small hearts, from guinea pigs or rabbits. Studies of larger hearts have shown areas of faster and slower activation across the heart, but the existence of a single reentrant rotor that drives fibrillation has not been clearly demonstrated.32,33
In contrast to the mother rotor hypothesis is the “restitution” hypothesis. Restitution properties of the heart have been recognized for many years. Restitution in the heart refers to the relationship between the duration of an action potential in a particular cell and the duration of the previous diastolic or resting interval. If the previous diastolic interval (DI) is short, the current action potential duration (APD) will also be short. If the previous DI is long, the current APD will be long. For a regular rhythm, the preceding DI is constant and, therefore, so is the duration of the subsequent APD. The relationship between an APD and the previous DI is often described graphically as a plot of APDn versus DIn-1 (Fig. 2-2). The steepness of the restitution curve is an important characteristic of this curve, especially at short DIs. If this slope is greater than 1, then, at a constant cycle length, a single perturbation in DI will cause the ensuing APDs and DIs to oscillate, with the oscillations progressively increasing until the site is refractory at the time of the next cycle, causing conduction block and VF initiation. During VF, it is hypothesized that, when the slope of the restitution curve is greater than 1, oscillations in DI and APD increase until block occurs and wavefronts break up. Figure 2-2 shows an example of a restitution curve recorded from the right ventricle of a pig. The relationship between a DI and the subsequent APD is well defined during paced rhythm but less well defined during VF.
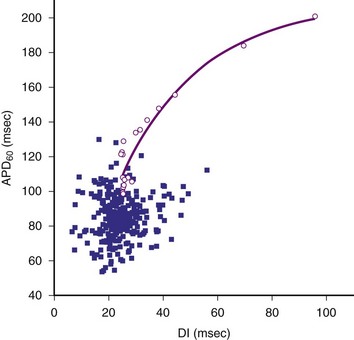
Figure 2-2 Restitution curve recorded from right ventricle of pig.
(From Huang J, Zhou X, Smith WM, Ideker RE: Restitution properties during ventricular fibrillation in the in situ swine heart. Circulation 110:3161-3167, 2004.)
Cellular Action Potential and Excitable Gap During Fibrillation
In the past few years, knowledge of the characteristics of the action potentials during fibrillation has increased greatly. This is a direct result of the introduction of techniques for recording action potentials in whole hearts, either in vivo31 or in perfused, isolated hearts.4–6,10,31 During fibrillation, the action potentials are altered: the APD is decreased; the action potential upstroke is slowed (decreased first-order derivative, dV/dt) and of decreased magnitude; the plateau phase is abbreviated; and DIs are abbreviated or absent (Fig. 2-3). During the first few seconds of VF (or atrial fibrillation), the activation rate is quite rapid; the mean cycle length of VF in patients undergoing defibrillator implantation was 213 ± 27 msec.6 DIs are rarely seen during early fibrillation, and the upstroke of most action potentials occurs before the transmembrane potential has returned to baseline from the previous action potential. The demonstration of an excitable gap in fibrillating atrial tissue,34 as well as evidence of an excitable gap in fibrillating ventricular tissue,35 suggests that there are periods late in the action potential in the fibrillating myocardium during which an electrical stimulus can capture a portion of the fibrillating myocardium. Knowledge of an excitable gap provides an opportunity to stimulate the tissue just in front of a fibrillating wavefront, to cause wavefront block.
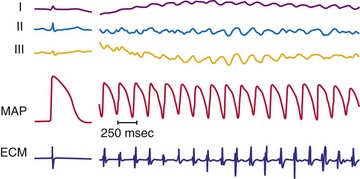
Figure 2-3 Recording during ventricular fibrillation in a human.
(From Swartz JF, Jones JL, Fletcher RD: Characterization of ventricular fibrillation based on monophasic action potential morphology in the human heart. Circulation 87:1907-1914, 1993.)
As described in Chapter 1, the electrical activity of the heart is controlled ultimately by ion channels located in the cell membrane of the myocyte. It has been established that both the voltage-gated fast channels (sodium [Na+]) and slow channels (Na+ and calcium [Ca2+]) are active during the first few seconds of VF.8 The fast-channel activity is indicated by the rapidity of the upstroke of the action potential (phase 0) during early fibrillation and its sensitivity to administration of the Na+ channel blocker, tetrodotoxin. As fibrillation proceeds, the upstrokes of the action potentials become increasingly slower, with a decreased dV/dtmax, but the action potentials remain sensitive to tetrodotoxin until 1 to 5 minutes after initiation of fibrillation. A transition then occurs in which the action potential upstrokes become insensitive to tetrodotoxin. This suggests that the propagation of the action potential is no longer mediated primarily by the fast voltage-gated Na+ channels and may be mediated by slow voltage-gated Ca2+ channel activity in the later stages of fibrillation.4 The activation complexes recorded from the ventricular myocardium remain active only as long as the coronary arteries are perfused with oxygenated blood, suggesting that ischemia may be responsible for the loss of fast-channel activation during prolonged VF.26
 Defibrillation
As previously mentioned, application of a powerful electrical shock to the heart is the only reliable means of stopping fibrillation. Successful defibrillation can reflect either the immediate cessation of all activation fronts or the cessation of activation fronts after two to three cycles,11,36 followed by coordinated beating of the heart. Unsuccessful defibrillation can reflect a failure to inhibit the fibrillating activation fronts or the resumption of fibrillating activation fronts after their initial inhibition.
Waveforms, Current Strength, and Distribution During Defibrillation
The two most common waveform shapes used clinically are the monophasic and biphasic waveforms. In monophasic waveforms, the polarity of the shock is unchanged at each electrode for the entire duration of the electrical shock. In biphasic waveforms, the polarity of the shock reverses at each electrode partway through the defibrillation waveform. Many studies, in both animals and humans, have shown that biphasic waveforms can defibrillate with less current and energy than monophasic waveforms, in both internal and transthoracic defibrillation configurations.37–40 Within each type, waveforms can be described as truncated exponential or damped sinusoidal shapes. ICDs use truncated exponential biphasic waveforms. Most external defibrillators have used damped sinusoidal monophasic waveforms, but because of the inductor necessary to shape the waveform, these defibrillators tend to be large and heavy. More recently, smaller, lighter external defibrillators have been developed that use truncated exponential biphasic waveforms similar to those used in ICDs. Damped sinusoidal biphasic waveforms are used in external defibrillators in Russia; similar to truncated exponential biphasic waveforms, these show improved efficacy over monophasic waveforms.41,42
However, not all biphasic waveforms are superior to monophasic waveforms, For example, if the second phase of the biphasic waveform becomes much longer than the first phase, the energy required for defibrillation increases and can eventually rise to a level greater than the energy required to defibrillate with a monophasic waveform (with duration equal to the first phase of the biphasic waveform).40,43,44 The optimum duration of the two phases of the biphasic waveform depends on the electrode impedance and the defibrillator capacitance.45–48
Several groups have shown that defibrillation efficacy for square waveforms follows a strength-duration relationship similar to that for cardiac stimulation;49,50 as the waveform becomes longer, the average current at the 50% success point (the current when one half of delivered shocks will succeed) becomes progressively less, approaching an asymptote called the rheobase.51 On the basis of this observation, some suggest that cardiac defibrillation can be mathematically modeled using a resistor-capacitor (RC) network to represent the heart45,51–53 (Fig. 2-4). As empirically determined, the time constant for the parallel RC network is 2.5 to 5 msec.45,47,53 In one version of the model,53 a current waveform is applied to the RC network. The voltage across the network is then calculated for each time point during the defibrillation pulse. The relative efficacies of different waveform shapes and durations can be compared by determining the current strength that is necessary to make the voltage across the RC network reach a particular value, called the defibrillation threshold.
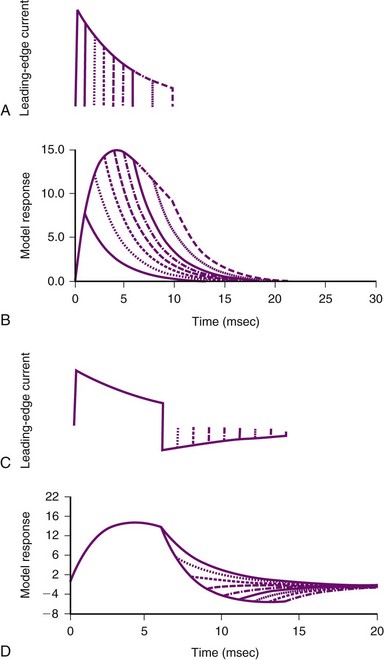
Figure 2-4 Parallel resistor-capacitor (RC) network representation of heart.
(From Walcott GP, Walker RG, Cates AW, et al: Choosing the optimal monophasic and biphasic waveforms for ventricular defibrillation. J Cardiovasc Electrophysiol 6:737-750, 1995.)
Several observations can be made from this model. First, for square waves, as the waveform duration becomes longer, the voltage across the network increases, approaching an asymptote, or rheobase. For truncated exponential waveforms, however, the model voltage rises, reaches a peak, and then, if the waveform is long enough, begins to decrease (see Fig. 2-4). Therefore, the model predicts that monophasic exponential waveforms should be truncated at a time when the peak voltage across the RC network is reached. Current or energy delivered after that point is wasted. In support of this prediction, strength-duration relationships measured in both animals53 and humans54 do not approach an asymptote but rather reach a minimum and remain constant as the waveform lengthens. This minimum occurs over a range of waveform durations and does not extend indefinitely. Schuder et al.55 showed that, if the duration of a waveform becomes too long, defibrillation efficacy decreases.
Second, the model predicts that the heart acts as a low-pass filter.52 Therefore, waveforms that rise gradually should have better efficacy than waveforms that turn on immediately. This prediction has been shown to hold true for external defibrillation,56 internal atrial defibrillation,57 and internal ventricular defibrillation.58 Ascending ramps defibrillate with a greater efficacy than do descending ramps.58,59
Third, several groups have suggested that the optimal first phase of a biphasic waveform is the optimal monophasic waveform.46,53 If so, what does the model predict as the “best” second phase of a biphasic waveform? Empirically, the role of the second phase apparently is to return the model voltage response back to zero as quickly as possible, thereby maximizing the increased efficacy of the biphasic waveform over that of the monophasic waveform with the same duration as phase 1 of the biphasic waveform. If the network voltage does not reach zero, or if it overshoots zero, efficacy is lost. Swerdlow et al.47 showed in humans that the “best” phase 2 of a biphasic waveform returns the model response close to zero.
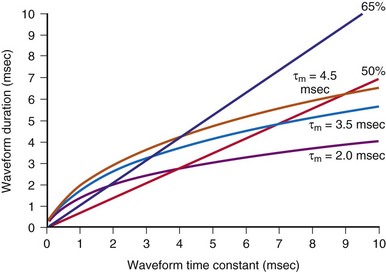
These models can also help in choosing shock parameters, including phase duration for biphasic waveforms. Shock duration should be varied depending on defibrillation lead impedance; patients with low impedance should receive short-duration shocks, whereas patients with high impedance should receive longer-duration shocks. Initially, the concept of “tilt” was used to vary shock phase durations with impedance. Tilt is defined as the quotient of the leading-edge voltage minus the trailing voltage at the end of the shock divided by the voltage at the beginning of the shock, expressed as a percentage. For example, a shock with starting voltage of 500 V and ending voltage of 100 V has a tilt of 80%. If tilt is held constant, shock duration varies linearly with shock impedance. Compared with model predictions (Fig. 2-5), fixed-tilt waveforms are too short for patients with low impedance and too long for patients with higher impedance. One defibrillator manufacturer has developed a reference table that gives waveform phase durations as a function of patient impedance using a model similar to the one previously presented.60,61 Their model uses “model time constants” of 2.5, 3.5, and 4.5 msec. It is recommended that the 3.5-msec constant be used first. If the defibrillation threshold for the 3.5-msec waveform is unsatisfactory, using the 4.5-msec constant is likely to be more effective than 2.5 msec. Waveforms that are too short tend to fail; waveforms that are too long tend to waste shock energy yet still defibrillate.
The location of the defibrillation electrodes affects the magnitude of the shock necessary to defibrillate the heart. Typically, 200 to 360 J of energy are necessary for successful defibrillation, with the defibrillation electrodes located on the body surface, during transthoracic defibrillation with a damped sinusoidal monophasic waveform. Although less energy is required for a truncated exponential biphasic waveform,62 only about 4% to 20% of the current that is delivered to transthoracic defibrillation electrodes ever reaches the heart.63,64 Indeed, when the defibrillation electrodes are placed in the heart itself, usually only 20 to 34 J of energy is required, and the requirement may be as low as only a few joules when large, contoured epicardial electrodes are used.40,65 The strength of the shock also varies for different locations on or in the heart; epicardial patches defibrillate with a lower shock energy than transvenous electrode configurations.66
Although defibrillation efficacy is usually described by some measure of defibrillation shock “strength” (energy, voltage, or current), little insight into the mechanisms of defibrillation can be obtained from these measures. Knowing how the current (or voltage) of a defibrillation shock is distributed over the heart allows greater understanding of how defibrillation occurs. Several studies have measured the potential gradient distribution throughout the heart during a defibrillation shock.14,67,68 The potential gradient is a measure of the spatial variation of shock voltage across the heart. The potential gradient is measured in volts per centimeter (V/cm) of tissue. In a region with a high potential gradient, the difference in voltage between a given point and an area 1 cm distant from that point is high. Regions of low potential gradient have a measured voltage that is similar to that of nearby points. These studies show an uneven potential distribution for most electrode configurations, with areas of high potential gradient near the defibrillation electrodes and areas of low potential gradient in regions distant from the defibrillating electrodes. It has been hypothesized that a minimum potential gradient must be attained for successful defibrillation to occur, and that this requirement is independent of the current applied or the electrode configuration.15,16 After a shock that fails to defibrillate VF, the site of earliest activation immediately after the shock can be mapped and related to the electric field that was produced by the shock. For shocks near the defibrillation threshold, the sites of earliest activation after a failed shock occur in the areas of lowest potential gradient.
The minimum potential gradient required for defibrillation is lower for biphasic than for monophasic waveforms (4 vs. 6 V/cm). A minimum potential gradient of 6 V/cm was required for successful defibrillation using a 10-msec truncated exponential monophasic waveform in the open-chest dog model.16 Similar findings were observed using a 14-msec truncated exponential monophasic waveform and multiple electrode configurations.15 In contrast, a minimum potential gradient of 4 V/cm was required for successful defibrillation using a truncated exponential biphasic waveform. Because higher shock strengths are required to induce a higher potential gradient, biphasic shocks successfully defibrillate with lower energy than monophasic shocks (i.e., a lower-voltage gradient is required).
The requirement for a minimum potential gradient may reflect the need for a shock to prevent the generation of new activation fronts that can result in reinitiation of fibrillation.69 Examination of activation patterns after failed defibrillation for progressively larger shock strengths indicate that postshock activation occurs at numerous sites throughout the ventricle, and that reentry is common when the shock strength is much lower than that needed for defibrillation70 (Fig. 2-6). At shock strengths just lower than those required for defibrillation, postshock activation arises in a limited number of myocardial regions. The activation fronts then propagate to activate other regions of the myocardium for a few cycles before reentry occurs; activation becomes disorganized; and fibrillation is reinitiated. Although postshock activation sites can still arise in regions of lowest potential gradient after a shock slightly greater than that required for defibrillation, the cycles of activation that originate from these sites are slower. These activations terminate after a few cycles without reinitiating fibrillation.69–71
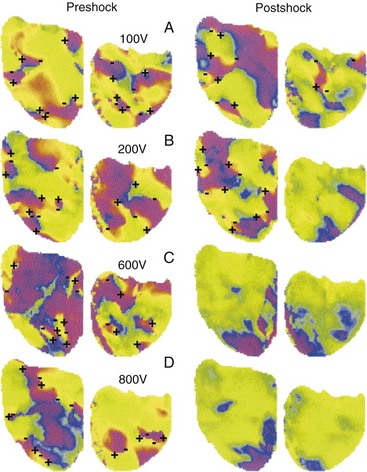
Figure 2-6 Phase maps of single rabbit heart.
(From Chattipakorn N, Banville I, Gray RA, Ideker RE: Effects of shock strengths on ventricular defibrillation failure. Cardiovasc Res 61:39-44, 2004.)
At least two inferences can be drawn from the model that the lowest potential gradient region determines whether or not a shock will halt fibrillation. First, different shock electrode configurations with the same defibrillation threshold (DFT) have the same lowest potential gradient value, but in different regions of the heart. Single-coil versus dual-coil defibrillator systems have similar DFTs. Mapping of postshock activations shows that the earliest recorded activity after the shock is the anterior left ventricle for dual-coil shocks but the posterior area for single-coil shocks.72 Thus the low gradient region presumably is anterior for dual-coil shocks and posterior for single-coil shocks, although this inference needs to be confirmed experimentally. Crossley et al.73 measured DFTs for shocks from either an electrode in the right ventricular (RV) apex or RV outflow tract to the pulse generator can and showed that DFTs were not significantly different for the two configurations. We can infer that the lowest potential gradient level was the same for each configuration, but likely in a different location.
Stay updated, free articles. Join our Telegram channel

Full access? Get Clinical Tree


