Chapter 1 Principles of CMR
Basic physics
MRI is based on nuclear magnetic resonance, the phenomenon of the resonance of atomic nuclei in response to radiofrequency (RF) waves.
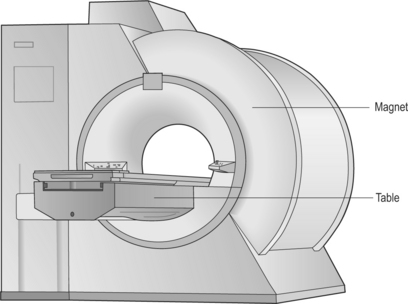
At equilibrium within a magnetic field, overall proton alignment is in the direction of the main magnetic field and they have net longitudinal magnetization. This equilibrium can be disturbed by transmission of RF energy at the precession frequency of the proton which is 63 megaHertz (MHz) for water protons at 1.5 Tesla (T)—the strength of most commercially used magnets (Figure 1.1).
Localization of anatomical position within a selected imaging slice or volume is done with the application of frequency- and phase-encoding gradients. The corresponding direction of application of these gradients is known as the frequency encode or phase encode direction. With modifications of the phase-encoding gradients flowing blood can be differentiated from stationary anatomy via alterations in the phase of the MR signal. The velocity of material is proportional to the phase change or phase shift caused by its movement during gradient application.
Main sequences
There are two fundamental types of sequence commonly used in CMR: gradient echo (GE) and spin echo (SE). As a general rule, with GE sequences both blood and fat appear white and so this technique is also known as white-blood imaging (Figure 1.2a). By contrast, in SE sequences blood is usually black but fat is white, giving rise to the term black-blood imaging (Figure 1.2b). SE sequences are more useful for anatomical imaging as opposed to the functional imaging performed with GE sequences. Variations of GE sequences are fast low-angle shot (FLASH), fast imaging with steady-state free precession (SSFP), and velocity mapping. GE imaging also forms the basis of the inversion recovery technique.
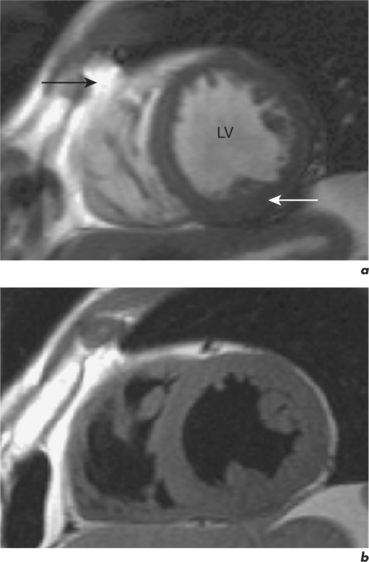
Areas of focal myocardial dysfunction and abnormal flow patterns are readily visualized with the technique of cine imaging using SSFP (or cines). Cines are obtained by rapid repetition of a variant of the basic GE sequence to obtain a series of cardiac images at progressively advancing points of the cardiac cycle which when put together form a cine loop. The weighting of SSFP sequences depends on the ratio of T2/T1, therefore most fluids and fat have a high signal and appear white. However, muscle and many other solid tissues have a long value for T1 and a short value for T2. This means that their signal intensity is reduced to shades of grey (Figure 1.2a). In addition to cines, the SSFP sequence can also be applied as a two-dimensional (2D) single-shot technique, as a real-time technique (not requiring breath holding or electrocardiogram (ECG) triggering), and as a three-dimensional (3D) volume scan.
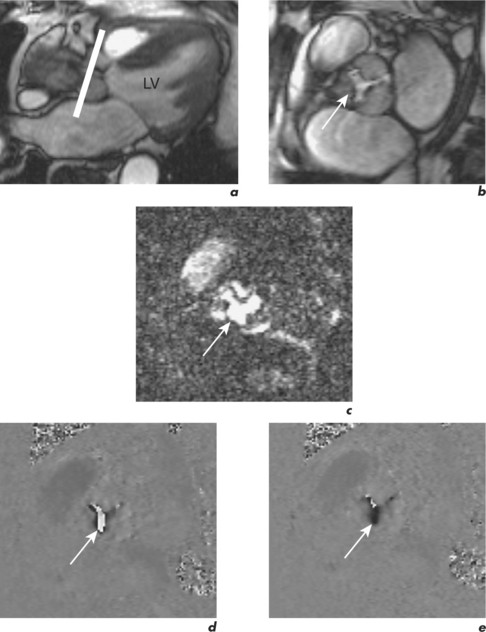
Velocity mapping (or flow velocity mapping) techniques can determine the average velocity within a single imaging voxel, typically 1 ×1 ×10 mm3. The operator selects the required plane and sets a maximal encoding velocity (Venc; Figure 1.3). The initial Venc used is an approximation of the velocity expected based on factors such as clinical history, the type of valve or conduit lesion, and images already acquired. The Venc represents the practical upper limit of velocities that can be depicted unambiguously and should ideally be set to a numerical value just greater than the true velocity. Problems occur if it is set much higher or lower than this value—with the former leading to less sensitivity and the latter causing misrepresentation via the phenomenon of aliasing. Velocity aliasing is when the flow appears to be in the opposite direction and is characterized by a sudden transition of white-toblack or vice versa within the chosen flow region (Figure 1.3d). To eliminate or reduce aliasing a higher Venc must be set and the velocity mapping sequence repeated (Figure 1.3e). The maximal velocity of jets under interrogation should only be determined from the Venc-optimized images. Aliasing is also noted with 2D Doppler echocardiography and the technique of velocity mapping gives similar information. Subjects are asked to suspend their breathing for measurement of peak velocities using this method, which takes approximately 20 seconds to perform. An example of its use is for the quantification of peak velocity in valvular stenosis. Velocity mapping sequences are also used to calculate overall flow in a major vessel through the cardiac cycle and so can be used for quantification of regurgitation in valvular incompetence. For calculation of peak velocity and transvalvular flow, the plane used must be through plane—a plane perpendicular and mjust distal to the area of interest. Velocity mapping CMR is also used to confirm abnormal chamber communication and the ratio of pulmonary to systemic flow in shunts such as septal defects.
Compared to GE sequences, SE pulse sequences are usually more robust to system imperfections, such as magnetic field inhomogeneities. In SE imaging, structures need to be stationary for the delivery of two RF pulses. The T2 value of stationary fluid is long and gives high signal. Examples are fluid-filled structures such as cysts, which therefore appear white with SE sequences. However, flowing blood moves out of the selected slice before receiving the second pulse and so gives no signal and appears black (Figure 1.2b). Slower flowing blood can give persistent signal of varying signal intensity. Important variations of SE sequences are fast (or turbo) spin echo (FSE or TSE). FSE allows faster imaging than standard SE by acquiring more lines of data for every RF pulse delivered and allows acquisition of an entire image in a single heartbeat.


