Several studies demonstrated the prognostic importance of renal failure and peripheral artery disease in patients undergoing coronary artery bypass grafting (CABG), but data regarding the prognostic value of renal artery disease in this context are scarce. We aimed to study the prevalence and prognostic value of renal artery disease in patients undergoing CABG. We assessed by duplex ultrasound the renal arteries of 429 consecutive patients who underwent CABG, of whom 401 had satisfactory imaging quality to detect >60% renal artery stenosis (RAS) and/or an elevated resistive index (ERI >0.80). Of the 401 subjects included (age 68 ± 10 years, 83% men), 40 (10%) had RAS and 35 (9%) had ERI. Nine patients (2.2%) had both conditions. Patients were followed up for 12.4 ± 7.0 months. The primary outcome was composite, including 30-day death, stroke, and/or myocardial infarction. In a multivariate model adjusted for age, gender, cardiovascular (CV) risk factors, renal function, chronic obstructive pulmonary disease, the use of off-pump CABG, CV co-morbidities, and drugs, the presence of ERI was strongly associated with the occurrence of the composite outcome (odds ratio 4.3, 95% confidence interval 1.7 to 9.9, p = 0.0006). Similarly, ERI, not RAS, was significantly associated with the 30-day acute kidney disease and the midterm mortality, as well as fatal and nonfatal CV events. In conclusion, regardless of renal function and other factors, the renal resistive index is a strong predictor of CV and renal events after CABG. Renal duplex ultrasound can identify a subgroup of patients at high risk of CABG.
Highlights
- •
The presence of renal artery stenosis (10%) is frequent in patients undergoing coronary artery bypass grafting (CABG). Also, 9% present an elevated renal index, a marker of renal arterial resistance.
- •
The presence of renal artery stenosis is not associated with postoperative outcomes.
- •
The presence of an elevated renal index is predictive of 30-day cardiovascular outcomes and acute kidney injury after CABG.
- •
Preoperative renal arterial duplex assessment is useful to stratify the postoperative cardiovascular and renal outcomes in patients undergoing CABG.
Atherosclerosis often affects multiple vascular beds concomitantly. The increased prevalence of renal artery stenosis (RAS) in association with coronary artery disease (CAD) or peripheral artery disease (PAD) is well documented. In patients with CAD, RAS may be screened by renal angiography concomitant to coronary angiography, but this technique is now supplanted by noninvasive methods, including ultrasound and magnetic resonance imaging. In patients with CAD, duplex ultrasound has been advocated as the first-line imaging method of renal arteries. Although several studies have demonstrated the prognostic interest of renal failure and PAD in patients undergoing coronary artery bypass grafting (CABG) surgery, data on the consequences of RAS during CABG are scarce. Also, the postoperative degradation of kidney function is a matter of concern, and the risk factors for this complication are not yet well established. The aim of this study was to investigate the prevalence of RAS and elevated renal resistive index in patients with CAD undergoing CABG and its relation with outcomes. We hypothesized that the prevalence of these conditions in patients undergoing CABG is high and could be associated with poorer cardiovascular (CV) and renal outcomes.
Methods
We prospectively included 429 consecutive patients undergoing elective isolated CABG, except those on renal dialysis or with a history of renal transplantation. Secondarily, patients with poor duplex imaging quality were also excluded. Clinical data were investigated preoperatively. Chronic kidney disease (CKD) was defined as an estimated glomerular filtration rate <60 ml/min/1.73 m² according to the Modification of Diet in Renal Disease formula. PAD was defined according to the medical history and/or an ankle-brachial index ≤0.90 or ≥1.40. Cerebrovascular disease was defined by any history of stroke, transient ischemic attack, carotid revascularization, and/or carotid stenosis detected during preoperative duplex of neck arteries. Left ventricular hypertrophy measured by echocardiography was defined by the left ventricular mass/height 2.7 formula, with thresholds set at 50 g/m 2.7 in men and 47 g/m 2.7 in women. Intraoperative data included the completeness of myocardial revascularization and the use of on- or off-pump surgery.
The participants underwent a systematic preoperative Doppler ultrasonography of the renal arteries (models ATL HDI 5000, ATL HDI 3000, and iE33; Philips, Bothell, Washington). We defined RAS >60% when at least 2 of the 3 following criteria were present : renal artery peak systolic velocity >180 cm/s, renorenal (peak systolic velocity) ratio >2.7, and/or renal-to-aortic peak systolic velocity ratio >3.5. The renal index was determined at the renal hilum, using the following equation:
Renal index = (peak systolic velocity − end-diastolic velocity)/peak systolic velocity.
An elevated resistive index (ERI) was defined by a renal resistance index >0.80.
The primary outcome was composite, including the occurrence of any of the following events within the first 30 postoperative days, whichever first: death, stroke, or perioperative myocardial infarction (defined by new Q waves in at least 2 contiguous leads on the postoperative electrocardiogram and/or troponin peak and creatine phosphokinase peak >10 times the ninety-ninth percentile).
A secondary postoperative outcome was defined by the occurrence of acute kidney injury, according to the risk of renal dysfunction; injury to the kidney; failure of kidney function, loss of kidney function and end-stage kidney disease injury-risk “R” criteria (serum creatinine increase of 1.5 times or 25% decrease of glomerular filtration rate compared with baseline data). Two other midterm secondary outcomes have been determined: the occurrence of death and a composite outcome (death, stroke or acute coronary syndrome, or myocardial revascularization) during the follow-up period.
Data are reported as mean (SD) and number (percentage) for continuous and categorical variables, respectively. Categorical and continuous variables were analyzed using Fisher’s exact test and the Student t test, respectively. The Kaplan-Meier survival method was used for the comparison of survival according to the presence of RAS or ERI, using the log-rank test. Multivariate analysis was performed using a logistic regression model for the 30-day events and Cox proportional hazards model for the midterm events. For this purpose, several models were run by adding sequentially baseline demographic factors, CKD, CV risk factors, co-morbidities, CV treatment, and preoperative data. Because some patients could have both conditions (RAS and ERI), these 2 variables have been assessed concomitantly in a same model, rather than taking into account the 3 patient groups. A p value <0.05 was considered statistically significant. The software used for statistical analysis was StatView, version 5.0, for Windows (SAS Institute, Cary, North Carolina).
Results
Of the 429 patients eligible for our study, 401 patients (82.5% men) had satisfactory imaging of renal vascularization by duplex and were included in the study. Table 1 lists the characteristics of the study population. The 28 excluded patients did not differ from those included except for lower rates of dyslipidemia (52% vs 71%, respectively, p = 0.03). Notably, these patients did not differ in terms of age (67.6 ± 9.1 vs 67.7 ± 10.3 years, p = NS) and prevalence of CKD (17.9% vs 15.0%, p = NS).
| Variable | N (%) or Mean (SD) |
|---|---|
| Men | 331 (82.5%) |
| Age (years) | 67.6 ± 10.3 |
| Body mass index (kg/m 2 ) | 27.3 ± 4.3 |
| Smoker | 223 (55.6%) |
| Diabetes mellitus | 114 (28.4%) |
| Dyslipidemia | 283 (70.6%) |
| Hypertension | 272 (68%) |
| Chronic obstructive pulmonary disease | 64 (16%) |
| Peripheral artery disease | 158 (39.4%) |
| Left ventricular hypertrophy | 160 (39.9%) |
| Revascularization history | 70 (17.4%) |
| Beta-blockers | 316 (78.8%) |
| ACE-inhibitors or angiotensin receptor blockers | 250 (62.3%) |
| Statins | 344 (85.8%) |
| 3-Vessel coronary disease | 302 (75.3%) |
| Left main coronary artery disease | 137 (34.4%) |
| Ejection fraction <0.40 | 31 (7.7%) |
| Preoperative glomerular filtration rate (ml/min) | 84.1 ± 23.6 |
| Chronic kidney disease | 60 (15%) |
| Sinus rhythm | 377 (95.4%) |
| Number of coronary arteries bypassed | 3.3 ± 1.0 |
| On-pump duration (min) | 106.7 ± 64.8 |
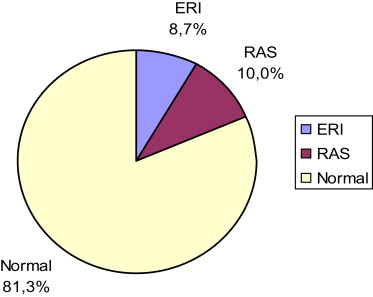
The rates of abnormal duplex findings are displayed in Figure 1 . Forty patients (10.0%) had RAS, including unilateral RAS in 36 patients (9.0%) and bilateral RAS in 4 patients (1.0%). The prevalence of ERI was 8.7% (35 patients). The prevalence of concomitant RAS and ERI was 2.2% (9 patients). These 9 patients were included in the RAS group. Patients with ERI were older with higher rates of co-morbidities such as diabetes, PAD, or chronic obstructive pulmonary disease and lower levels of glomerular filtration rate compared with the normal group ( Table 2 ).
| Variable | RAS (n = 40) N (%) or Mean (SD) | p RAS vs. Normal | Normal (n = 326) N (%) or Mean (SD) | p ERI vs. Normal | Isolated ERI (n = 35) N (%) or Mean (SD) |
|---|---|---|---|---|---|
| Men | 34 (85%) | 0.99 | 274 (84.1%) | 0.02 | 23 (65.7%) |
| Age (years) | 71.9 ± 9.5 | 0.0008 | 66.2 ± 10.3 | <0.0001 | 75.2 ± 7.3 |
| Body-mass index (kg/m²) | 26.9 ± 3.4 | 0.48 | 27.4 ± 4.4 | 0.98 | 27.4 ± 4.3 |
| Smoker | 21 (52.5%) | 0.61 | 187 (57.4%) | 0.11 | 15 (42.3%) |
| Diabetes mellitus | 14 (35%) | 0.18 | 81 (24.5%) | 0.005 | 17 (48.6%) |
| Dyslipidemia | 21 (52.5%) | 0.008 | 241 (73.9%) | 0.11 | 21 (60%) |
| Hypertension | 32 (80%) | 0.08 | 214 (65.6%) | 0.99 | 23 (65.7%) |
| Chronic obstructive pulmonary disease | 8 (20%) | 0.36 | 48 (14.7%) | 0.05 | 10 (28.6%) |
| Peripheral artery disease | 20 (50%) | 0.08 | 116 (35.6%) | 0.003 | 22 (62.3%) |
| NYHA III/IV | 7 (17.5%) | 0.99 | 55 (16.9%) | 0.24 | 9 (25.7%) |
| Ejection fraction <0.40 | 3 (7.9%) | 0.99 | 23 (7.4%) | 0.16 | 5 (15.6%) |
| Left ventricular hypertrophy | 16 (40%) | 0.99 | 126 (41.4%) | 0.055 | 18 (60%) |
| Sinus rhythm | 39 (97.5%) | 0.99 | 309 (95.1%) | 0.41 | 32 (91.4%) |
| Revascularization history | 8 (20%) | 0.67 | 58 (17.8%) | 0.48 | 4 (11.4%) |
| 3-Vessel coronary disease | 36 (90%) | 0.02 | 237 (72.7%) | 0.42 | 28 (80%) |
| Left main coronary artery disease | 15 (37.5%) | 0.60 | 108 (33.1%) | 0.45 | 14 (40%) |
| ACE-inhibitors/angiotensin receptor blockers | 28 (70%) | 0.30 | 199 (61%) | 0.72 | 23 (65.7%) |
| Beta-blockers | 29 (72.5%) | 0.31 | 260 (79.8%) | 0.67 | 27 (77.1%) |
| Statins | 30 (75%) | 0.05 | 285 (87.4%) | 0.43 | 29 (82.9%) |
| C-reactive protein (mg/l) | 5.6 ± 5.6 | 0.18 | 6.2 ± 11.5 | 0.05 | 10.9 ± 24 |
| Hematocrit (%) | 39.2 ± 4.4 | 0.01 | 40.9 ± 3.8 | <0.0001 | 37.6 ± 4.0 |
| Preop glomerular filtration rate (ml/min) | 71.1 ± 25.3 | <0.0001 | 86.9 ± 22.7 | 0.0009 | 73.3 ± 22.6 |
| On-pump CABG | 33 (82.5%) | 0.84 | 258 (79.9%) | 0.99 | 28 (80%) |
| On-pump duration (minutes) | 107.4 ± 31.7 | 0.98 | 107.7 ± 70.5 | 0.42 | 96.8 ± 31.9 |
| Clamping duration (minutes) | 76.0 (27.1) | 0.16 | 69.8 (23.0) | 0.38 | 65.7 (25.3) |
| Complete revascularization | 26 (65%) | 0.86 | 217 (66.8%) | 0.004 | 14 (41.2%) |
The primary composite outcome (30-day death, stroke, and/or perioperative myocardial infarction) occurred in 40.0%, 45.7%, and 29.5%, respectively, in the RAS, ERI, and normal groups (RAS vs normal: p = NS, ERI vs normal: p = 0.056). After serial adjustments for confounders, ERI (not RAS) was independently and significantly associated with the primary outcome ( Table 3 ).
| Model 1 | Model 2 | Model 3 | Model 4 | Model 5 | |
|---|---|---|---|---|---|
| Primary outcome: 30-days composite outcome | |||||
| Elevated renal index | 2.6 (1.32–5.08) p = 0.0058 | 3.1 (1.50–6.42) p = 0.0022 | 4.1 (1.86–9.10) p = 0.0005 | 4.2 (1.87–9.25) p = 0.0005 | 4.3 (1.87–9.89) p = 0.0006 |
| Renal artery stenosis | 1.2 (0.62–2.49) p = 0.55 | 1.4 (0.65–2.81) p = 0.42 | 1.1 (0.51–2.49) p = 0.77 | 1.2 (0.53–2.62) p = 0.5 | 1.2 (0.53–2.69) p = 0.66 |
| Acute kidney injury | |||||
| Elevated renal index | 2.2 (1.07–4.66) p = 0.03 | 2.4 (1.07–5.24) p = 0.03 | 2.3 (0.99–5.34) p = 0.0517 | 2.3 (0.98–5.29) p = 0.0545 | 2.4 (1.01–5.82) p = 0.0475 |
| Renal artery stenosis | 0.7 (0.3–1.69) p = 0.44 | 0.7 (0.27–1.63) p = 0.37 | 0.8 (0.3–1.96) p = 0.58 | 0.8 (0.29–1.95) p = 0.56 | 0.7 (0.28–1.93) p = 0.54 |
Stay updated, free articles. Join our Telegram channel

Full access? Get Clinical Tree


