Pressure Wire
Wilbert Aarnoudse
Cees-Joost Botman
Nico H.J. Pijls
For more than 40 years the technique of coronary arteriography has played a pivotal role in the diagnosis and treatment of patients with ischemic heart disease.1,2 However, coronary arteriography has several well-recognized limitations. A number of studies have reported both severe underestimation and overestimation of stenosis severity as assessed from the angiogram as compared to pathologic findings at autopsy.3,4,5 Furthermore, a high intraobserver and interobserver variability has been reported.6 But, most important, the pathophysiological significance of a stenosis cannot be judged reliably from the angiogram alone, whereas both for quality of life and prognosis of a patient, the functional significance is most important.7 In this respect it is important to define that a stenosis is called functionally significant, hemodynamically significant, or physiologically significant if it is able to limit maximum achievable blood flow to such a degree that ischemia of the myocardium supplied by that particular stenotic artery can be induced if the patient is sufficiently stressed.
A number of studies confirmed a poor correlation between anatomic estimation of coronary narrowings and physiologic measures of coronary function, especially in ranges of 50% to 90% diameter stenosis.8 It was shown repeatedly that in patients with angiographically significant coronary disease, outcome was clearly related to the extent of inducible ischemia and not to the anatomic degree of narrowing.9,10
In that respect, it is important to realize that the physiological impact of a coronary artery stenosis on blood flow is determined by interaction with several other factors such as aortic pressure, central venous pressure, collateral flow, and resistance and size of the depending myocardial bed.11,12 To overcome these limitations of coronary arteriography, and to obtain more information on blood flow and to improve clinical decision making, additional techniques have been developed such as intracoronary Doppler flow velocity measurements and intracoronary pressure measurements.
Concept and Practical Setup
The exercise tolerance of patients with stable coronary artery disease is determined by maximum achievable myocardial blood flow. In the presence of a stenosis, the exercise level at which ischemia will occur is directly related to the maximum coronary blood flow that is still achievable by the stenotic vessel. Therefore, not resting flow but only maximum achievable blood flow to the myocardium at risk is the best parameter to determine the functional capacity of the patient. Expressing myocardial blood flow in absolute dimensions, however, has some disadvantages because this is dependent on the size of the distribution area, which is unknown, and will differ among patients, vessels, and distribution areas. It is therefore better to express maximum achievable (stenotic) blood flow in relation to normal maximum blood flow. Therefore, the ratio between maximum achievable stenotic blood flow and maximum achievable normal blood flow was introduced, and this index was called fractional flow reserve (FFR).13,14,15 Fractional flow reserve is defined as the maximum achievable blood flow to a distribution area in the presence of a stenosis as a ratio to the normal maximum achievable blood flow to that distribution area in the hypothetical situation that the supplying vessel was completely normal. In other words, fractional flow reserve expresses maximal blood flow in the presence of a stenosis as a fraction of normal maximum blood flow. This index is not dependent on resting flow and is therefore not subject to many of the limitations related to the concept of coronary flow reserve.
How to Determine Fractional Flow Reserve
Under circumstances generally present in the coronary catheterization laboratory, it is impossible to determine the ratio of maximum flow in the presence of a stenosis in relation to normal maximum coronary blood flow directly. However, by using a pressure-monitoring guidewire at maximum hyperemia, it is possible to calculate this ratio of flows by a ratio of pressures. This is explained in Figures 3D-1 and 3D-2. Figure 3D-1A represents a normal coronary artery and its dependent myocardium. Suppose that this system is studied at maximum vasodilation. In this situation, myocardial resistance is minimal and constant, and maximum myocardial hyperemia is present, as is the case at maximum exercise. In this situation, as can be seen in Figure 3D-2, the relation between myocardial perfusion pressure and myocardial flow is linearly proportional, and a change in myocardial perfusion pressure results in a proportional change in myocardial flow. In the case of a normal coronary artery (Fig. 3D-1A), the epicardial artery does not have any resistance to flow, and the pressure in the distal coronary artery is equal to aortic pressure. In the example, therefore, myocardial perfusion pressure (defined as distal coronary pressure Pd minus venous pressure Pv) equals 100 mm Hg. In case of a stenosis, however (Fig. 3D-1B), because of this stenosis there will be resistance to blood flow, and distal coronary pressure will be lower than aortic pressure: a pressure gradient across the stenosis exists (in the example Pa – Pd = 30 mm Hg) and myocardial perfusion pressure will be diminished (in the example Pd – Pv = 70 mm Hg). In the example, therefore (Fig. 3D-1B), myocardial perfusion pressure has decreased to 70 mm Hg. Because during maximum hyperemia, myocardial perfusion pressure is directly proportional to myocardial flow, the ratio of maximum stenotic and normal maximum flow can be expressed as the ratio of distal coronary pressure and aortic pressure at hyperemia.
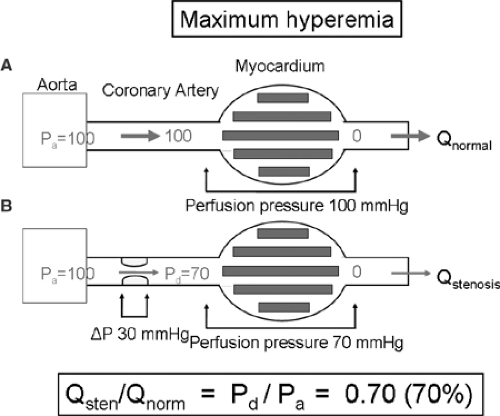 FIGURE 3D-1. A: Schematic representation of a normal coronary artery and its dependent myocardium, studied at hyperemia. In this normal situation, the (conductive) coronary artery gives no resistance to flow, and thus distal coronary pressure is equal to aortic pressure. Assuming that venous pressure is zero, perfusion pressure across the myocardium is 100 mm Hg. B: The same coronary artery, now in the presence of a stenosis. In this situation, the stenosis will impede blood flow and thus a pressure gradient across the stenosis will arise (ΔP = 30 mm Hg). Distal coronary pressure is no longer equal to aortic pressure, but will be lower (Pd = 70 mm Hg). Consequently, the perfusion pressure across the myocardium will be lower than in the situation that no stenosis was present (perfusion pressure is now 100 – 30 = 70 mm Hg). Because during maximum hyperemia, myocardial perfusion pressure and myocardial blood flow are linearly proportional (Fig. 3D-2), the ratio of maximum stenotic and normal maximal flow can be expressed as the ratio of distal coronary pressure and aortic pressure at hyperemia: FFR = Pd/Pa = 70 mm Hg. Importantly, it is distal coronary pressure at hyperemia that determines myocardial flow, and not the pressure gradient across the stenosis. |
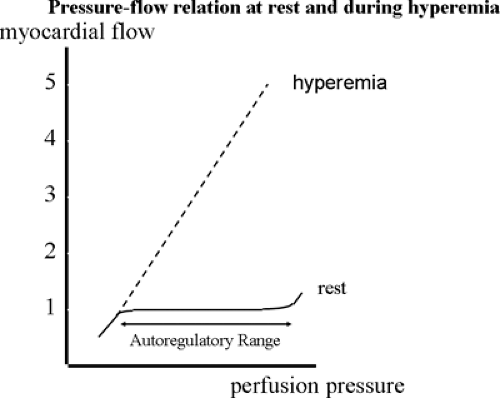 FIGURE 3D-2. As opposed to the resting situation, at maximum hyperemia, myocardial perfusion pressure is linearly proportional to myocardial flow. |
Therefore,
 can be expressed as

Because generally, central venous pressure is close to zero, the equation can be further simplified to
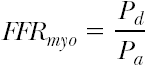
As Pa can be measured in a regular way by the coronary or guiding catheter, and Pd is easily obtainable by crossing the stenosis with a sensor-tipped guidewire, it is clear that FFRmyo can be simply obtained, both during diagnostic and interventional procedures, by measuring the respective pressures. From the foregoing equations it is also obvious that FFRmyo for a normal coronary artery will equal 1.0 (Fig. 3D-3).
Numerous studies have convincingly shown that treating a coronary stenosis in patients with a fractional flow reserve below 0.75 to 0.80 improves functional class and prognosis, whereas treating stenoses above that threshold does not improve prognosis and therefore is not recommended.15,16,17 More specifically, FFR <0.75 has 100% specificity for indicating
inducible ischemia,14,15,17 whereas >FFR 0.80 has a sensitivity of >90% for excluding inducible ischemia.
inducible ischemia,14,15,17 whereas >FFR 0.80 has a sensitivity of >90% for excluding inducible ischemia.
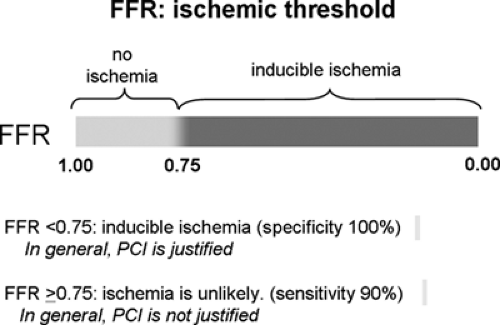 FIGURE 3D-3. Schematic representation of the threshold values of FFR. It has been convincingly shown that if FFR is <0.75, ischemia in this myocardial territory will be inducible, and that in this situation by treating a focal stenosis, the prognosis as well as the complaints of the patient will improve. If FFR is >0.80, on the other hand, it is almost certain that treating an angiographically visible stenosis will not alter the patient’s complaints or prognosis. If FFR is in the small “gray zone” between 0.75 and 0.80, close attention should be paid to the individual patient’s characteristics (such as site and extent of perfusion abnormalities on noninvasive testing, and typical or atypical complaints) to guide sound clinical decision making. |
Practical Setup
In practice, to measure coronary pressure in the catheterization laboratory, no major technical adaptations are needed as compared with a regular diagnostic procedure. A regular pressure transducer is necessary for aortic pressure (Pa


Stay updated, free articles. Join our Telegram channel
Full access? Get Clinical Tree
