Our aim was to assess the prognostic impact of a high-sensitivity cardiac troponin T (hs-cTnT) assay in an outpatient population with chronic systolic left ventricular heart failure (HF). Four hundred sixteen patients with chronic HF and left ventricular ejection fraction ≤45% were enrolled in a prospective cohort study. In addition to hs-cTnT, plasma amino-terminal pro–B-type natriuretic peptide was measured at baseline. Mean age was 71 years, 29% were women, 62% had coronary artery disease (CAD), mean left ventricular ejection fraction was 31%, and 57% had abnormal level of hs-cTnT. During 4.4 years of follow-up, 211 (51%) patients died. In multivariate Cox regression models, hs-cTnT was categorized as quartiles or dichotomized by the 99th percentile of a healthy population. Adjusted hazard ratios for all-cause mortality for quartiles 2 to 4, with quartile 1 as reference, were 1.4 (95% confidence interval 0.9 to 2.4, p = 0.16) for quartile 2, 1.7 (0.9 to 2.5, p = 0.12) for quartile 3, and 2.6 (1.6 to 4.4, p <0.001) for quartile 4 and 1.7 (1.2 to 2.5, p = 0.003) for abnormal versus normal level of hs-cTnT. In patients without CAD, quartile 4 of hs-cTnT was associated with an adjusted hazard ratio of 6.8. In conclusion, hs-cTnT is increased in most outpatients with chronic systolic HF and carries prognostic information beyond clinical parameters and amino-terminal pro–B-type natriuretic peptide. Increased hs-cTnT indicated a particularly deleterious prognosis in patients without CAD.
Since the development of high-sensitivity cardiac troponin T (hs-cTnT) assays, minute increases of plasma cTnT indicating low-grade myocardial damage can be detected, and increases in hs-cTnT have been linked to cardiovascular mortality in healthy populations. In view of possible incremental prognostic information provided by plasma hs-cTnT levels beyond clinical information and pro–B-type natriuretic peptide (pro-BNP) or amino-terminal pro-BNP (NT–pro-BNP), the aim of the present study was to investigate the association between hs-cTnT and mortality and morbidity in outpatients with chronic systolic heart failure (HF) managed in a specialized HF clinic. Furthermore, we intended to determine if hs-cTnT might be especially predictive of outcome in a subgroup of patients with coronary artery disease (CAD).
Methods
We conducted a prospective cohort study in patients attending an outpatient HF clinic at Frederiksberg University Hospital (Copenhagen, Denmark) from 1999 through 2009. The design of the HF clinic has been described in detail previously. In brief, patients with suspected or diagnosed HF were referred from primary health care physicians or from the department of cardiology or internal medicine at Frederiksberg University Hospital. Inclusion criteria were chronic HF according to contemporary guidelines and left ventricular ejection fraction (LVEF) ≤45% documented by echocardiography. During the study period 416 patients provided written informed consent. The study was conducted in accordance with the Declaration of Helsinki and approved by the local ethics committee. Written informed consent was obtained before inclusion.
At the baseline visit, information on New York Heart Association class, previous diagnosis of diabetes, pharmacologic treatment, height, weight, systolic and diastolic blood pressures, electrocardiogram, and description of echocardiogram including LVEF were recorded in a designated database. HF was considered caused by CAD if any of the following characteristics were present: previous diagnosis of myocardial infarction, percutaneous coronary intervention, coronary artery bypass grafting, coronary angiogram with significant stenosis, or signs of ischemia on myocardial perfusion image.
A fasting blood sample was obtained at the baseline visit and directly analyzed for hemoglobin, creatinine, sodium, potassium, glycated hemoglobin A1c, and NT–pro-BNP. Concentrations of NT–pro-BNP were measured using the Elecsys 2010 platform (Roche Diagnostics, Mannheim, Germany). Plasma for hs-cTnT measurement was also obtained at baseline and collected in plastic vials containing ethylenediaminetetraacetic acid. Samples were placed on ice before chilled centrifugation at 3,000 g and frozen at −70°C, at which temperature all samples were stored until later analysis. After inclusion of the last patient, hs-cTnT concentrations were measured on the Elecsys 2010 platform using a new assay from Roche. This assay measures human troponin using monoclonal antibodies against amino acids 125 to 131 and 136 to 147, respectively. The assay working range is reported as 3 to 10.000 ng/L, with interassay coefficients of variation of 3.1% at 24 ng/L and 1.3% at 300 ng/L. The lower limit of quantification is 13 ng/L, the lowest limit of detection is 5 ng/L, and the limit of the blank is 3 ng/L as listed by the manufacturer. The gender-specific 99th percentile concentration limit as established in a healthy population (men 18 ng/L, women 8 ng/L) was adopted to differentiate normal from abnormal values of hs-cTnT. Estimated glomerular filtration rate was calculated from the 4-component Modification of Diet in Renal Disease equation incorporating age, race, gender, and serum creatinine level.
The primary outcome was all-cause mortality. Information on time of death was obtained from the Danish Civil Registration System in April 2010. No patients were lost to follow-up. A secondary outcome of combined all-cause mortality or cardiovascular hospitalization was also applied. Dates of first hospitalizations after study inclusion registered with a primary cardiovascular disease diagnosis were obtained from the Danish National Patient Registry in April 2010.
Patients were categorized in quartiles according to baseline values of hs-cTnT and in 2 groups with normal and abnormal hs-cTnT values. Numerical data with a normal distribution are presented as mean ± SD and skewed numerical data as median (interquartile range). Categorical data are presented as proportions. Differences between patient groups based on quartiles of hs-cTnT were tested using 1-way analysis of variance or chi-square test. Mortality rates were compared using Kaplan–Meier curves and log-rank method to test for equality of survival distributions across hs-cTnT quartiles. Cox proportional hazards models were used to test the independent predictive power of hs-cTnT quartiles and concentrations >99th percentile of a healthy population on mortality and on the combined end point. Three Cox proportional hazards models were constructed: (1) univariate model, (2) multivariate model adjusting for clinical risk factors and period of inclusion, and (3) multivariate model adjusting for logarithmic NT–pro-BNP) in addition to the variables in model 2. The most important confounders considered of potential prognostic impact by the authors were corrected for age, gender, LVEF, New York Heart Association class, diabetes, CAD, hemoglobin, and estimated glomerular filtration rate. To account for the long inclusion period with potential differences in patient evaluation and treatment according to inclusion time, we divided the inclusion period into 4 intervals (1999 to 2001, 2002 to 2004, 2005 to 2007, 2008 to 2009) and adjusted for interval of inclusion in the multivariate Cox regression models. To assess whether the impact on mortality of hs-cTnT quartiles varied with the basic confounders gender and age, we performed interaction analyses within the multivariate Cox proportional hazards models. Because we hypothesized that hs-cTnT might be increased and have more pronounced prognostic impact in patients with CAD, interaction analyses with CAD and hs-cTnT quartiles were also performed. Statistical analyses were conducted by M.E. and I.G. All analyses were carried out using SPSS/PASW 19 (SPSS, Inc., Chicago, Illinois). A 2-sided p value ≤0.05 was considered statistically significant.
Results
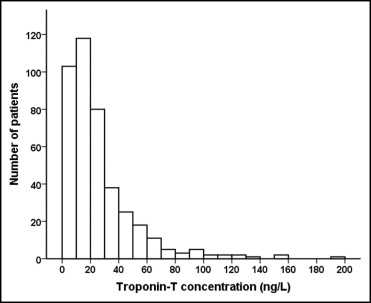
During the study period 416 patients with chronic HF referred to the outpatient HF clinic were included and followed up for a median of 4.4 years (interquartile range 1.9 to 7.5). Seventy-one percent of the study population were men, mean age was 71 years, mean LVEF was 31%, and 62% had CAD as the cause of HF ( Table 1 ). Distribution of hs-cTnT levels is depicted in Figure 1 . Measurable hs-cTnT (≥3 ng/L) was present in 95% of patients, and median hs-cTnT was 18 ng/L (10 to 31). Prevalence of patients with hs-cTnT levels >99th gender-specific percentile of the hs-cTnT range in a healthy population was 237 (57%), prevalence in men was 148 (50%), and prevalence in women was 89 (73%). Several differences at baseline among groups stratified according to hs-cTnT quartiles were found ( Table 1 ). With incremental quartiles of hs-cTnT, age, prevalence of diabetes and CAD, NT–pro-BNP concentrations, and daily loop diuretic doses increased, whereas estimated glomerular filtration rate decreased.
| Variable | Total (n = 416) | Quartile 1 (<10 ng/L) | Quartile 2 (10–18 ng/L) | Quartile 3 (19–33 ng/L) | Quartile 4 (>33 ng/L) | p Value |
|---|---|---|---|---|---|---|
| (n = 112) | (n = 100) | (n = 104) | (n = 100) | |||
| Age (years) | 71 ± 11 | 65 ± 11 | 71 ± 10 | 72 ± 11 | 75 ± 9 | <0.001 |
| Men | 295 (71%) | 70 (63%) | 77 (77%) | 72 (69%) | 76 (76%) | 0.07 |
| Coronary artery disease | 256 (62%) | 52 (46%) | 60 (61%) | 72 (69%) | 72 (72%) | <0.001 |
| New York Heart Association Class 3 or 4 | 105 (26%) | 23 (21%) | 19 (19%) | 32 (31%) | 33 (33%) | 0.06 |
| Left ventricular ejection fraction (%) | 31 ± 9 | 32 ± 8 | 30 ± 9 | 32 ± 9 | 29 ± 9 | 0.06 |
| Atrial fibrillation | 105 (26%) | 25 (23%) | 26 (26%) | 25 (25%) | 30 (30%) | 0.71 |
| Diabetes | 79 (19%) | 12 (11%) | 17 (17%) | 24 (23%) | 26 (26%) | 0.02 |
| Body mass index (kg/m 2 ) | 27.0 ± 5.2 | 27.1 ± 5.3 | 27.3 ± 4.8 | 27.1 ± 6.0 | 26.5 ± 4.5 | 0.76 |
| Estimated glomerular filtration rate (ml/min/1.73 m 2 ) | 69 ± 23 | 82 ± 21 | 72 ± 22 | 66 ± 22 | 57 ± 22 | <0.001 |
| Amino-terminal pro–B-type natriuretic peptide (pmol/L) | 137 (53–316) | 63 (28–174) | 115 (53–115) | 200 (93–412) | 302 (128–553) | <0.001 |
| Hemoglobin (mmol/L) | 8.6 ± 0.9 | 8.7 ± 1.0 | 8.8 ± 0.8 | 8.4 ± 1.0 | 8.5 ± 0.9 | 0.007 |
| Hemoglobin A1c (%) | 6.3 ± 1.2 | 5.9 ± 0.8 | 6.2 ± 1.3 | 6.4 ± 1.2 | 6.6 ± 1.5 | <0.001 |
| Angiotensin-converting enzyme inhibitor or angiotensin receptor blocker | 274 (66%) | 77 (69%) | 74 (74%) | 61 (59%) | 62 (62%) | 0.09 |
| β Blocker | 184 (44%) | 50 (45%) | 48 (48%) | 45 (43%) | 41 (41%) | 0.79 |
| Loop diuretic dose (mg/24 hours) | 57 ± 85 | 30 ± 51 | 45 ± 68 | 66 ± 92 | 88 ± 109 | <0.001 |
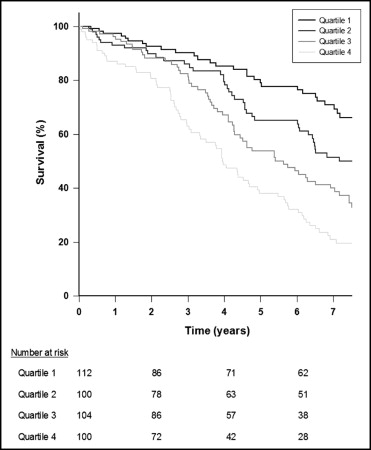
During follow-up 211 patients (51%) died and 330 (79%) met the composite end point of all-cause mortality or cardiovascular hospitalization. Mortalities during follow-up in quartiles of hs-cTnT were 26% in quartile 1, 44% in quartile 2, 59% in quartile 3, and 77% in quartile 4. Differences in survival rates among groups were compared in a Kaplan–Meier analysis presented in Figure 2 . A continuous divergence with decreased survival rates with higher hs-cTnT quartiles during long-term follow-up was found (p <0.001). Univariate Cox regression analyses confirmed a marked increase in mortality risk with ascending hs-cTnT quartiles (quartile 2, hazard ratio [HR] 1.8, 95% confidence interval [CI] 1.1 to 2.9, p = 0.014; quartile 3, HR 2.7, 95% CI 1.7 to 4.2, p <0.001; quartile 4, HR 4.6, 95% CI 3.0 to 7.0, p <0.001; quartile 1 reference). The addition of clinical risk factors to the model decreased risk estimates, but high levels of hs-cTnT remained strongly associated with mortality risk as evidenced by approximately twofold and threefold increases in mortality risk for quartiles 3 and 4, respectively (quartile 2, HR 1.4, 95% CI 0.9 to 2.4, p = 0.15; quartile 3, HR 1.9, 95% CI 1.3 to 3.1, p = 0.008; quartile 4, HR 3.1, 95% CI 1.9 to 5.1, p <0.001) The addition of NT–pro-BNP to the final models did not alter these estimates substantially ( Table 2 ).
| Variables in Model | HR (95% CI) for All-Cause Mortality | |||
|---|---|---|---|---|
| Quartiles of hs-cTnT | p Value | hs-cTnT >99th Percentile | p Value | |
| Troponin T quartile | ||||
| 2 | 1.4 (0.9–2.4) | 0.16 | ||
| 3 | 1.7 (0.9–2.5) | 0.12 | ||
| 4 | 2.6 (1.6–4.4) | <0.001 | ||
| Troponin T >99th percentile | 1.7 (1.2–2.5) | 0.003 | ||
| Age (per year) | 1.05 (1.03–1.07) | <0.001 | 1.05 (1.03–1.07) | <0.001 |
| Male gender | 1.7 (1.2–2.5) | 0.005 | 2.2 (1.5–3.2) | <0.001 |
| Coronary artery disease | 1.0 (0.7–1.3) | 0.81 | 1.0 (0.7–1.4) | 0.97 |
| New York Heart Association class III or IV | 1.5 (1.1–2.1) | 0.01 | 1.5 (1.1–2.1) | 0.01 |
| Diabetes | 1.6 (1.1–2.3) | 0.01 | 1.6 (1.1–2.3) | 0.01 |
| Hemoglobin (per mmol/L) | 0.9 (0.7–1.0) | 0.13 | 0.9 (0.8–1.1) | 0.21 |
| Left ventricular ejection fraction (per percentage) | 1.0 (1.0−1.0) | 0.43 | 1.0 (1.0−1.0) | 0.54 |
| Estimated glomerular filtrations rate (per ml/min/1.73 m 2 ) | 1.01 (1.01–1.02) | 0.02 | 1.01 (1.0–1.01) | 0.07 |
| Log amino-terminal pro–B-type natriuretic peptide (per unit) | 2.1 (1.5–3.0) | <0.001 | 2.1 (1.5–2.9) | <0.001 |
| Period of inclusion | 1.1 (0.9–1.4) | 0.24 | 1.2 (1.0–1.4) | 0.14 |
Stay updated, free articles. Join our Telegram channel

Full access? Get Clinical Tree


