Results
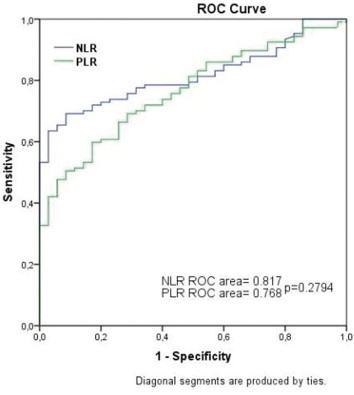
NLR and PLR were significantly higher in the IPE group [3.30 (1.28-16.84) vs. 2.09 (0.92-3.39); p <0.001, and 171.0 ( 50.4-850.9) vs. 111.81( 50.6-225.4); p <0.001, respectively]. Statistically significant positive correlation were also found between the NLR (r = 0.614, P < 0.001), and PLR (r = 0.512, P < 0.001) severity of IPE. The NLR of >2.95 had 63.55 % sensitivity and 97.14 % specificity for the prediction of IPE, as identified by the ROC curve. The PLR of >144.68 had 59.81 % sensitivity and 82.86% specificity for the prediction of IPE, as identified by the ROC curve.
Conclusion
We found that NLR and PLR were significantly higher in patients with IPE. Our study also showed that NLR and PLR were strongly correlated with idiopathic pericardial effusion severity.