Fig. 6.1
Invasive coronary angiography and intravascular ultrasound (IVUS) of the left anterior descending artery (LAD). (a) Invasive angiogram shows significant coronary artery stenosis in the proximal segment of LAD (arrow). (b) Cross-sectional image of IVUS on the level of white line on image a. IVUS demonstrates significant luminal narrowing by hypoechoic plaque combined with calcification indicating mixed plaque. Red circle indicating EEM CSA external elastic membrane cross-sectional area, yellow circle indicating lumen CSA lumen cross-sectional area, plaque CSA plaque cross-sectional area
6.2.2 CT
Current multi-detector row computed tomography (MDCT) now provides technical prerequisites for coronary atherosclerotic plaque imaging [4].
Thus, CT has enabled qualitative and quantitative assessment of coronary plaque, including assessment of plaque size, composition, and remodeling.
CCTA is able to define plaque vulnerability by differentiating plaque composition based on density measurements [5].
Several limitations exist in the routine use of CT for coronary plaque assessment:
Use of iodinated contrast and radiation exposure to image coronary plaque
Limited by motion-related image artifacts and inadequate resolution to visualize plaque components
Inadequate resolution in determining plaque area, volume, and remodeling (Figs. 6.2 and 6.3)
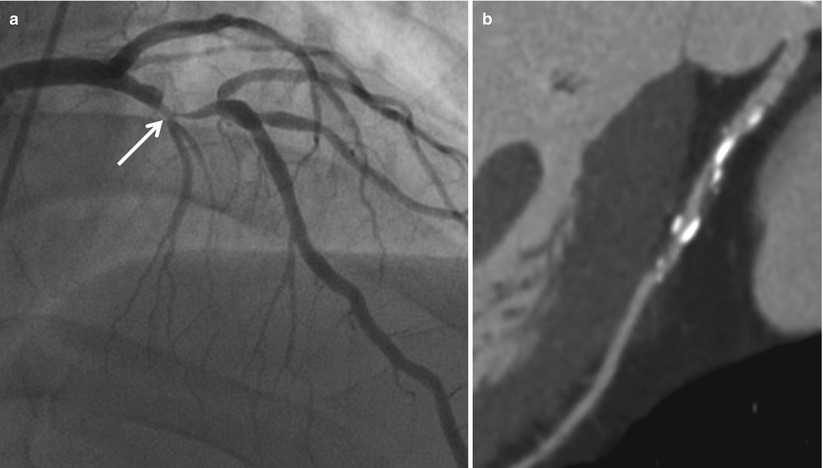
Fig. 6.2
Invasive coronary angiography and coronary computed tomographic angiography (CCTA) of the left anterior descending artery (LAD). (a) Invasive angiogram shows significant coronary artery stenosis in the proximal segment of LAD (arrow). (b) Curved multiplanar reformatted (MPR) image demonstrates calcified and mixed plaques in the proximal segment of LAD
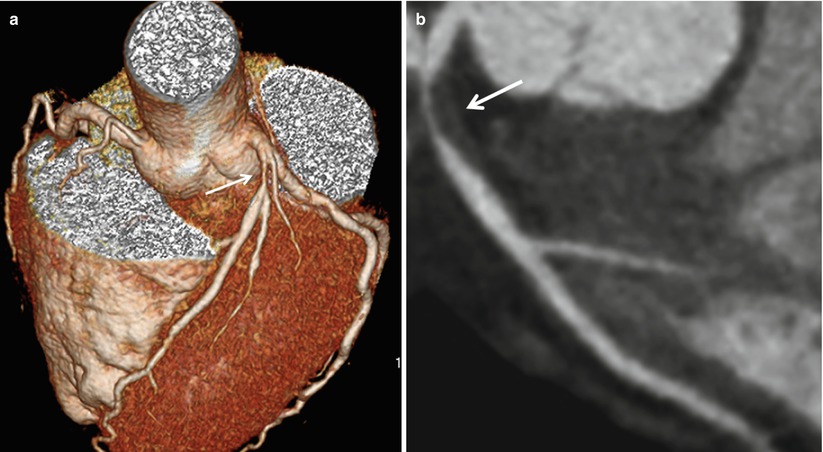
Fig. 6.3
Coronary computed tomographic angiography (CCTA) with significant coronary artery stenosis of the left anterior descending artery (LAD). (a) Volume rendering (VR) image demonstrates significant coronary artery stenosis in the proximal segment of LAD (arrow). (b) Curved multiplanar reformatted (MPR) image demonstrates non-calcified plaque in the proximal segment of LAD (arrow) with significant coronary artery stenosis
6.2.3 MRI
Technical improvements of coronary magnetic resonance imaging (CMR) have enabled reliable visualization of the proximal and midportion of the coronary artery tree for exclusion of significant coronary artery disease.
Current technical developments focus on direct visualization of the diseased coronary vessel wall and imaging of coronary plaque [6].
MRI has several limitations for routine clinical applications:
Limited by the small size of the target and lower spatial resolution
Limited by cardiac motion artifact and respiration artifact
Considerable length of time for imaging (Fig. 6.4, Table 6.1)
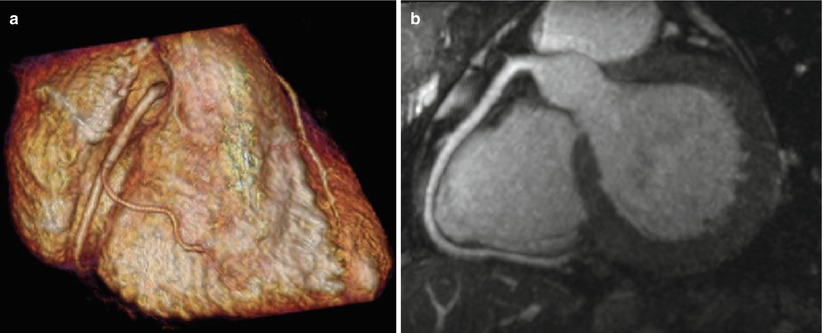
Fig. 6.4
Coronary magnetic resonance angiography (MRA) of the right coronary artery (RCA). (a) Volume rendering (VR) image of MRA demonstrates right coronary artery without coronary artery stenosis. (b) Curved multiplanar reformatted (MPR) image of MRA demonstrates right coronary artery without coronary artery stenosis
Table 6.1
Comparison of each modality for plaque imaging
Imaging modality
Determination of plaque characteristics
Advantages
Disadvantages
IVUS
Plaque echogenicity
Reference modality
Invasive modality
Plaque volume and size
Good depth of penetration
Limited in coronary artery occlusion or severe stenosis
Complementary modality of coronary angiography
Difficulty in differentiating the borderline between intramural thrombus and fibrous plaque
CT
Quantification of calcium
Noninvasive identification of vulnerable plaques
Use of iodinated contrast agents and radiation
Density measurement
Limited by motion artifacts
Inadequate resolution to visualize plaque components
MRI
Signal intensity
Noninvasive modality
Lower spatial resolution
No use of iodinated contrast agent
Limited by cardiac motion artifact and respiration artifact
No need to radiation exposure
Longer length of study time
6.3 Classification of Plaque
Based on the relative amount of calcified and non-calcified components, plaques are usually classified into one of three categories: calcified plaque, mixed plaque, or non-calcified plaque.
Classification of coronary plaque as calcified, mixed, or non-calcified relies on the ability of CCTA to distinguish their respective attenuations.
6.3.1 Calcified Plaque
Definition: plaques occupied by calcified tissue (any structure with a density of 130 HU or more that could be visualized separately from the contrast-enhanced coronary lumen) more than 50 % of the plaque area (Fig. 6.5)
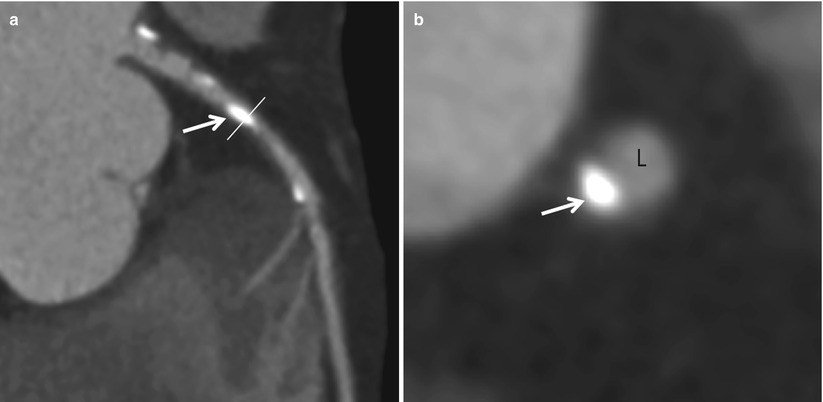
Fig. 6.5
Calcified plaque. (a) Curved multiplanar reformatted (MPR) image of coronary computed tomographic angiography (CCTA) demonstrates multiple calcified plaques in the left main and proximal segment of left anterior descending artery (arrow). (b). Cross-sectional image of CCTA on the level of white line on image a. Eccentric dense calcified plaque (arrow) is seen with mild luminal narrowing of the coronary artery. L Lumen
6.3.2 Mixed Plaque
Definition: plaques occupied by calcified tissue (any structure with a density of 130 HU or more that could be visualized separately from the contrast-enhanced coronary lumen) less than 50 % of the plaque area (Fig. 6.6)
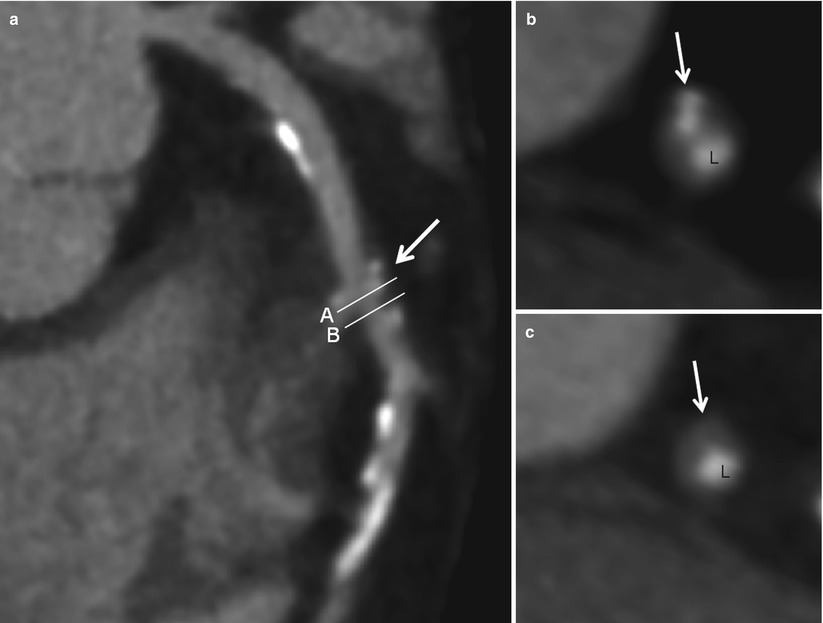
Fig. 6.6
Mixed plaque. (a) Curved multiplanar reformatted (MPR) image of coronary computed tomographic angiography (CCTA) demonstrates multiple calcified plaques and mixed plaque (arrow) in the proximal and middle segments of the left anterior descending artery with significant stenosis caused by mixed plaque. (b) Cross-sectional image of CCTA on the level of white line (B) on image a. Mixed plaque in this area is composed of soft tissue and spotty calcifications (arrow). (c) Cross-sectional image of CCTA on the level of white line (C) on image a. Mixed plaque in this area is composed of soft tissue (arrow). L lumen
6.3.3 Non-calcified Plaque
Definition: plaques occupied without any calcified tissue (any structure with a density of 130 HU or more that could be visualized separately from the contrast-enhanced coronary lumen) on the plaque area (Fig. 6.7)
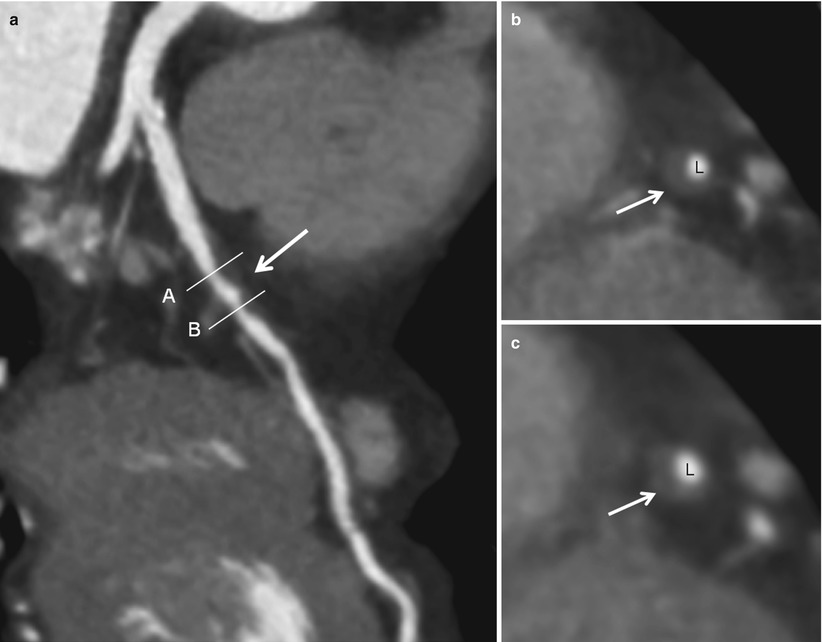
Fig. 6.7
Non-calcified plaque. (a) Curved multiplanar reformatted (MPR) image of coronary computed tomographic angiography (CCTA) demonstrates non-calcified plaque in the proximal segment of LAD (arrow). (b, c) Cross-sectional images of CCTA on the level of white lines (B) and (C) on image a. The non-calcified plaque is composed of soft tissue without any calcifications (arrow). L lumen
6.3.4 Vulnerable Plaque
Definition: all thrombosis-prone plaques and plaques with a high probability of undergoing rapid progression, thus becoming culprit plaques [7, 8].
In an attempt to unify the understanding of what constitutes a vulnerable plaque, morphological studies suggest the importance of necrotic core size, inflammation, and fibrous cap thickness.
A large number of vulnerable plaques are relatively uncalcified and relatively non-stenotic, but different types of vulnerable plaque exist (Table 6.2, Figs. 6.8 and 6.9).
Table 6.2
Criteria for defining vulnerable plaque, based on the study of culprit plaques
Major criteria
Minor criteria
Active inflammation (monocyte/macrophage and sometimes T-cell infiltration)
Superficial calcified nodule
Thin cap with large lipid core
Glistening yellow
Endothelial denudation with superficial platelet aggregation
Intraplaque hemorrhage
Fissured plaque
Endothelial dysfunction
Stenosis >90 %
Positive remodeling
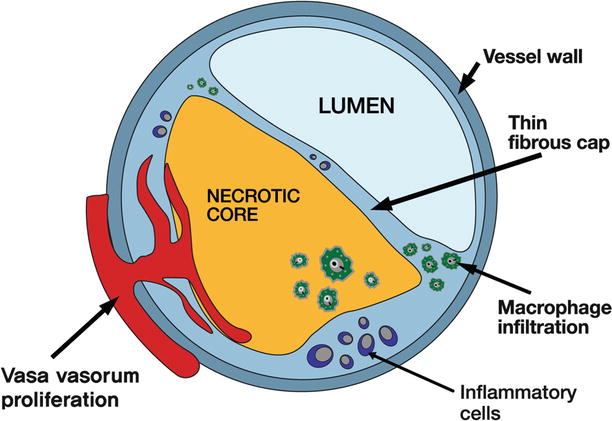
Fig. 6.8
Schematic illustration of vulnerable plaque. Schematic drawing of the morphologic features of a thin-cap fibroatheroma, which is commonly referred to as vulnerable plaque. A thin-cap fibroatheroma has histological characteristics, including a large necrotic core with an overlying thin intact fibrous cap, macrophages and inflammatory cell infiltration, and often increased number of intraplaque vasa vasorum
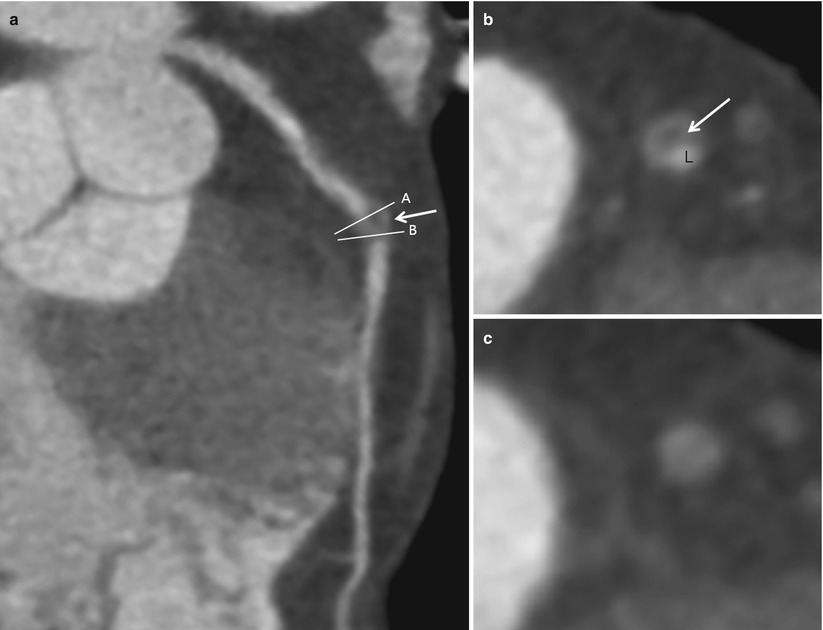
Fig. 6.9
Vulnerable plaque. (a) Curved multiplanar reformatted (MPR) image of coronary computed tomographic angiography (CCTA) demonstrates non-calcified plaque with lower attenuation within the central part of the plaque (arrow) as compared to the outer rim of the non-calcified plaque, suggestive of necrotic core. (b) Cross-sectional image of CCTA on the level of white line (B) on image a. The CT image shows a large non-calcified plaque with significant coronary artery luminal narrowing. The CT density of low attenuation within the central part of the plaque (arrow) was 7.9 ± 10.2 HU, indicating a necrotic core with lipid component. L lumen. (c) Cross-sectional image of CCTA on the level of white line (C) on image a. This cross-sectional image shows total occlusion by non-calcified plaque. The non-calcified plaque shows a higher CT attenuation compared to cross-sectional image on b. The mean attenuation of the non-calcified plaque was 67.9 ± 8.5 HU, indicating this area of plaque was composed of fibrous tissues< div class='tao-gold-member'>Only gold members can continue reading. Log In or Register to continue
Stay updated, free articles. Join our Telegram channel

Full access? Get Clinical Tree


