Chapter 1 Physiology and Pathophysiology
In this chapter the physiologic principles relating to conditions and treatments encountered in the cardiothoracic intensive care unit (ICU) are reviewed. Most of the topics relate to the cardiovascular system, but some coverage of the respiratory and renal systems is also included. The physiology of acid/base homeostasis and water and electrolyte balance is covered in Chapters 31 and Chapter 32, respectively.
ELECTRICAL ACTIVITY OF THE HEART
Cardiac Action Potential
An increase in the membrane potential (i.e., the inside becomes less negative) is called depolarization; a decrease in the membrane potential (i.e., the inside becomes more negative) is called repolarization. Action potentials are cycles of depolarization and repolarization and are the result of minute ion fluxes across the membrane due to changes in the permeability of the membrane to different ions. Alterations in membrane ion permeability are achieved by the opening and closing of transmembrane ion channels. Many of the channels are voltage gated, which means that they open when the membrane potential reaches a certain value.
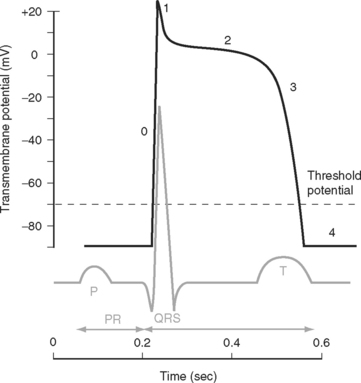
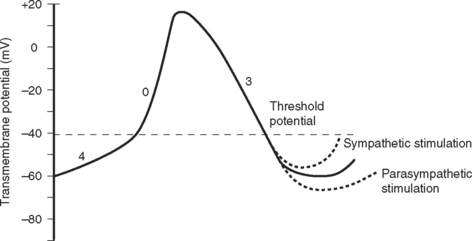
Two basic types of cardiac action potential are recognized: fast action potentials (Fig. 1-1), which occur predominantly in atrial and ventricular myocytes, and slow action potentials (Fig. 1-2), which occur in pacemaker cells of the sinoatrial (SA) and atrioventricular (AV) nodes.
Action Potential in Cardiac Muscle Cells
A cardiac action potential is transmitted deep within the myocyte by invaginations of the cell membrane known as T tubules. The entry of calcium into the cell during an action potential leads to the release of calcium from the sarcoplasmic reticulum into the cytoplasm of the myocyte, precipitating muscular contraction.
Cardiac Conducting System
Relationship between the Action Potential and the Electrocardiogram
The electrocardiogram (ECG) is the surface recording of the electrical activity of the heart. (Its interpretation is described in Chapter 8.) The relationship between the action potential and the ECG is shown in Figure 1-1. The P wave corresponds to depolarization of the atria during late ventricular diastole. The PR interval is the time from the onset of atrial activation to the onset of ventricular activation—a significant portion of which is taken up by the delay through the AV node. The QRS complex corresponds to ventricular depolarization. The ST segment spans the time when the ventricular myocytes are in phase 2 (plateau) of their action potentials, and the T wave corresponds to ventricular repolarization.
Control of Heart Rate and Cardiac Conduction
The electric activity in the heart is controlled by the autonomic nervous system and circulating epinephrine. Parasympathetic stimulation via the vagus nerve causes the release of acetylcholine that binds to muscarinic receptors on cells within the SA and AV nodes, leading to an increase in potassium permeability within these cells. Increased potassium permeability hyperpolarizes the cell membrane (meaning the membrane potential becomes more negative) and reduces the slope of phase 4 of the action potential (see Fig. 1-2), thus reducing heart rate and prolonging conduction through the AV node (↑PR interval). Intense vagal stimulation (e.g., during laryngoscopy) can lead to asystole (SA block) or complete heart block (AV block).
Sympathetic stimulation causes the release of norepinephrine, which activates β1 receptors on the cellular membrane. This leads to decreased potassium permeability and increased calcium and sodium permeability, which reduces the extent of repolarization and increases the slope of phase 4 in pacemaker cells (see Fig. 1-2), thus increasing heart rate and shortening the PR interval. Sympathetic nervous system activation also causes increased excitability throughout the entire conducting system.
A completely denervated heart has a resting rate of about 100 beats/min, this being the intrinsic rate of discharge of the SA node. The normal resting heart rate is 60 to 70 beats/min, indicating that parasympathetic tone dominates in the normal heart at rest. Abnormalities of impulse generation and conduction are discussed in Chapter 21.
Cardiac Cycle
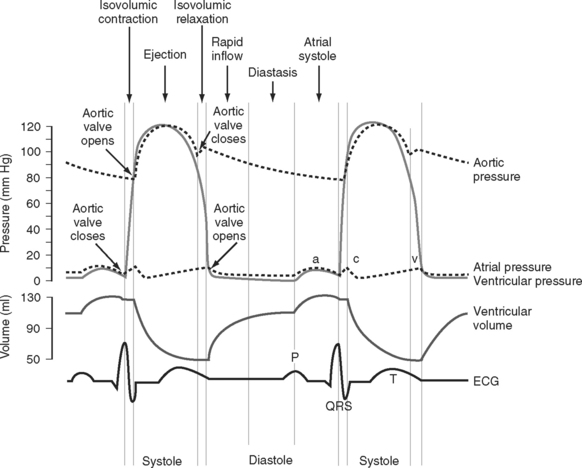
The cardiac cycle is divided into ventricular systole (contraction and ejection) and ventricular diastole (relaxation and filling) (Fig. 1-3).
Diastole
In various disease states diastolic filling is abnormal. For instance, with mitral stenosis a high proportion of ventricular filling occurs late in diastole. In this circumstance, shortening of diastole due to tachycardia or loss of atrial systole due to the development of atrial fibrillation can cause marked hemodynamic compromise. A similar situation exists when active relaxation is prolonged (e.g., due to myocardial ischemia or left ventricular hypertrophy). Conversely, in some circumstances (e.g., restrictive cardiomyopathy) a greater proportion of diastolic filling occurs early in diastole. In this circumstance, cardiac output may be improved with modest tachycardia. Diastolic dysfunction is discussed in Chapter 20.
Pressure-volume Loops
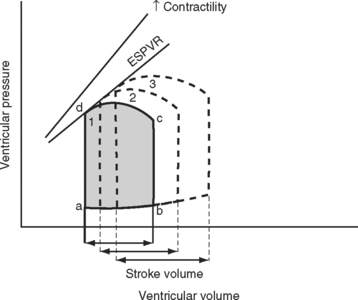
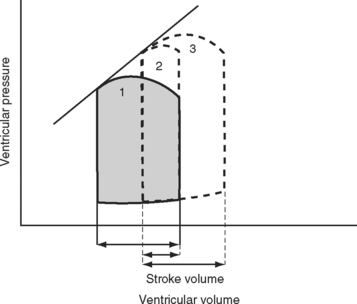
A useful way of evaluating cardiac function experimentally is by plotting ventricular pressure against ventricular volume throughout the cardiac cycle (Fig. 1-4). Families of pressure-volume loops can be generated under different physiologic conditions. Stroke volume (SV) is the difference between the end-diastolic volume (EDV; see Fig. 1-4, position b) and the end-systolic volume (ESV; see Fig. 1-4, position d). Ejection fraction (EF) is the proportion of the end-diastolic volume that is ejected during systole:
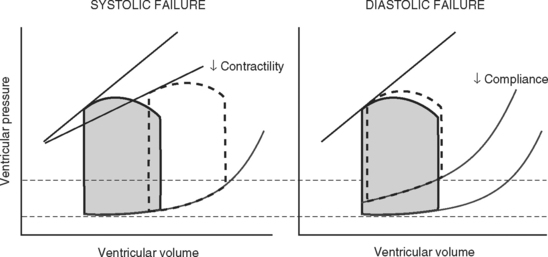
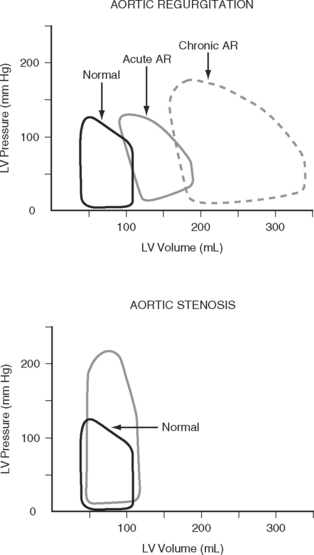
The area bound by the pressure volume-loop gives myocardial work. Characteristic changes in the pressure-volume loop are seen with alterations in the loading conditions or contractile function of the ventricle and with disease (Figs. 1-4, 1-5, 1-6, and 1-7).
Determinants of Cardiac Output
Cardiac output is the product of stroke volume and heart rate. Stroke volume is determined by preload, afterload, and contractility. Cardiac output may be divided by body surface area to obtain the cardiac index. The normal value for cardiac output in awake normotensive subjects is 1.9 to 3.5 L/min/m2 (see Chapter 8).
Preload
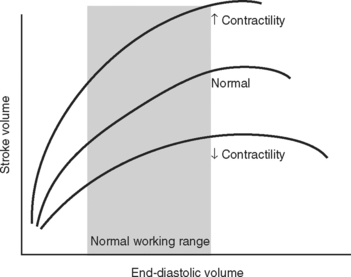
The functional contractile unit of the myocyte is the sarcomere, which is composed of overlapping thick and thin filaments. The thick filaments contain the protein myosin; the thin filaments contain the proteins actin, tropomyosin, and the troponin complex. Activation of the troponin complex by calcium leads to binding between actin and myosin and contraction of the sarcomere. The force of contraction is partly dependent on the degree of overlap of the thick and thin filaments. In the resting state the sarcomere is 1.8 to 2.0 μm long. Maximum overlap of the filaments occurs at a sarcomere length of about 2.3 μm—that is, when the sarcomere is prestretched above its resting length. This property of the sarcomere underlies the Starling law of the heart, which states that the degree of fiber stretch at end-diastole (preload) determines the force of contraction. In the intact heart, this is represented by the relationship between end-diastolic volume and stroke volume and can be displayed as a ventricular function curve (Fig. 1-8). Over the physiologic range, the relationship is relatively linear; thus, the ejection fraction, which is the slope of the ventricular function curve (SV/EDV), is relatively preload independent. In the ICU, left ventricular end-diastolic volume (or its surrogate, end-diastolic area) may be estimated by echocardiography. The effect of increasing preload on the pressure-volume loop is shown in Figure 1-4.
Left Ventricular Compliance
Because end-diastolic pressure is related to end-diastolic volume through the passive pressure-volume relationship (see Fig. 1-6), end-diastolic pressure is used as a surrogate for end-diastolic volume as a measure of preload. Clinically, left ventricular end-diastolic pressure is usually inferred from the pulmonary artery wedge pressure (PAWP; Chapter 8), which is obtained by means of a pulmonary artery catheter. Unfortunately, the relationship between end-diastolic volume and end-diastolic pressure (ventricular compliance) is not linear. At high ventricular volumes, a small increase in end-diastolic volume is associated with a big increase in end-diastolic pressure (see Fig. 1-6). Furthermore, left ventricular compliance may be altered by disease. For example, compliance is decreased in aortic stenosis and increased in aortic regurgitation (see Fig. 1-7). In some situations, an increase in filling pressure may actually be associated with a reduction in preload (e.g., pericardial tamponade). Thus, the estimation of preload from the PAWP may be misleading (see Chapter 8).1,2
Ventricular Interactions
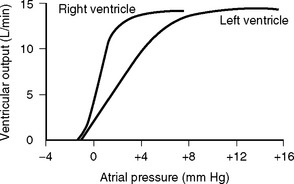
Figure 1.9 Output of the left and right ventricles at different atrial filling pressures.
(Redrawn from Guyton AC, Hall JE: Textbook of Medical Physiology, ed 10. Fig. 9.10, p. 104. Philadelphia, WB Saunders, 2000.)
Afterload
Afterload can be defined as ventricular wall stress during systole. It is determined by the impedance to ejection and ventricular geometry. Wall stress can be calculated by using the Laplace law:
A sudden increase in afterload is associated with an immediate fall in stroke volume. Over the next few beats, stoke volume gradually recovers due to increased diastolic ventricular volume (see Fig. 1-5). However, patients with congestive cardiac failure who are operating on the plateau part of their ventricular function curve (see Fig. 1-8) are unable to increase stroke volume by increasing preload—that is, they have reduced preload reserve. Thus, in patients with congestive cardiac failure, increased afterload (e.g., due to phenylephrine) can cause a precipitous fall in cardiac output. Indeed, afterload reduction is a fundamental principle of the treatment of left ventricular failure.
Contractility
Contractility is the intrinsic contractile function of the ventricle, independent of preload and afterload. Alterations in contractility are shown on the ventricular function curve in Figure 1-8. An increase in contractility shifts the curve upward and to the left, resulting in an increased stroke volume for a given end-diastolic volume; a decrease in contractility shifts the curve downward and to the right, resulting in reduced stoke volume for the same end-diastolic volume.
Experimentally, contractility may be evaluated by pressure-volume loops. If a number of loops are obtained by varying preload, the coordinates at end-systole form a straight line, known as the end-systolic pressure/volume relationship. The slope of this line is a reasonably load-independent measure of contractility (see Figs. 1-4 and 1-6). Unfortunately, there is no simple method of assessing contractility clinically. Ejection fraction and cardiac output, the commonly used clinical parameters of cardiac performance, are influenced by loading conditions, as explained subsequently.
The force of contraction of a given degree of myocyte overlap is determined by the cytoplasmic concentration of calcium, and this is the basis of alterations in contractility. The intracellular calcium concentration is regulated mainly by the activity of the sympathetic nervous system and circulating epinephrine. Physiologic and pharmacologic control of contractility is discussed in Chapter 3.
Myocardial Dysfunction
Potentially reversible cardiac dysfunction can occur as a consequence of myocardial ischemia, stunning or hibernation, or remodeling.7 Irreversible myocardial dysfunction occurs due to myocyte loss caused by infarction or replacement (e.g., with amyloid or fibrotic tissue).
Ischemia, Stunning, and Hibernation
Relief of ischemia does not always result in an immediate return of contractile function. Myocardial stunning is temporary myocardial dysfunction that persists following the resolution of an ischemic episode (postischemic dysfunction). This dysfunction occurs in the presence of normal, or near normal, coronary blood flow and in the absence of irreversible cellular damage. Return of contractile function occurs over a period of hours to days. Myocardial stunning arises primarily from reperfusion injury. The mechanisms of reperfusion injury and myocardial stunning are incompletely understood, but they involve the generation of oxygen-derived free radicals (e.g., superoxide, peroxynitrite), altered concentration and sensitivity to intracellular calcium, and endothelial dysfunction.3,4 Myocardial stunning is encountered in a number of clinical situations, such as after cardiopulmonary bypass and subsequent to reperfusion therapy for an acute coronary syndrome.
Hibernating myocardium is a state of chronic ischemic dysfunction. Hibernating myocardium was initially thought to be caused by low baseline blood flow. However, it is now recognized that baseline blood flow may be near normal and that the primary problem is reduced vasodilator reserve. Small increases in oxygen demand can then provoke acute ischemia that is typically painless.5 As with stunning, hibernating myocardium is not associated with permanent disruption of cellular integrity. However, there is some loss of the contractile elements, along with disorganization of the cytoskeletal proteins and interstitial inflammation.6 The downregulation of cellular function that occurs with myocardial hibernation serves to reduce myocardial oxygen requirements, helping to minimize cellular damage. Once blood supply has been restored, recovery of normal function is slower than with myocardial stunning, taking some days. If hibernating myocardium is not revascularized, myocardial fibrosis and irreversible dysfunction eventually occur. Hibernating myocardium is a significant cause of congestive cardiac failure in patients with coronary artery disease; the other two causes are infarction and remodeling (see subsequent material).
Collectively, ischemic, hibernating, and stunned myocardium are referred to as viable myocardium. The distinctions among normal, viable, and infarcted myocardium are of tremendous importance in terms of prognosis and treatment options for patients with coronary artery disease, and are discussed in Chapter 5.
Remodeling
Remodeling7 is an alteration in ventricular structure that occurs as part of normal growth or due to a pathologic process such as hypertension, valvular heart disease, myocardial infarction, or a cardiomyopathy. The primary feature of remodeling is hypertrophy. Ventricular hypertrophy is an adaptive response to a change in loading conditions that helps to attenuate ventricular dilatation, reduce wall stress (see Equation 1-3), and stabilize contractile function. Ventricular hypertrophy is initiated by myocardial stretch and various neuroendocrine processes.
Unchecked, ventricular remodeling can eventually result in irreversible cardiac dysfunction due to myocardial fibrosis. However, if appropriate therapy is introduced early enough, remodeling can be interrupted or reversed. If possible, treatment should be directed to the underlying cause: for valvular heart disease, this involves valve repair or replacement; and for hypertension, it involves effective control of blood pressure. Following myocardial infarction, pharmacologic antagonists (angiotensin-converting enzyme [ACE] inhibitors, β blockers, aldosterone antagonists) to the neuroendocrine pathways involved in the remodeling process have proven to be partially effective (see Chapter 19).
Clinical Assessment of Cardiac Function: Stroke Volume and Ejection Fraction
Stay updated, free articles. Join our Telegram channel

Full access? Get Clinical Tree


