Pediatric Exercise Testing
“Those who think they have not time for bodily exercise will, sooner or later, have to find time for illness”
Accurate and reproducible measurement of work performance or exercise capacity provides a means to quantify a dimension of disease severity, to assess the effects of treatment and training, and, in some instances, to identify previously unrecognized disease.
Determinants of Exercise Performance
In humans, skeletal muscle sarcomere shortening is essential for work to be performed. Normal sarcomere shortening requires the presence of reasonably normal intracellular contractile proteins and, in addition, depends on the occurrence of a multitude of intracellular events. Because sarcomere shortening is an energy-requiring process, the presence of high-energy phosphate compounds and the reasonably normal functioning of mitochondria and intracellular energy transport systems are necessary. Although skeletal muscles can function anaerobically, the major energy requirements of working muscles involve aerobic processes.
For repetitive sarcomere shortening to occur, the working muscle must be supplied with oxygen (O2) and energy sources including glucose and free fatty acids. Also, the by-products of cellular metabolism such as lactate and carbon dioxide (CO2) must be removed from the cellular environment. The transport of supply and waste products is accomplished by the cardiovascular system. The rate at which the cardiovascular system can accomplish this task is dependent on cardiac output.
O2 supply, CO2 elimination, and, to some extent, thermal regulation are dependent upon appropriate pulmonary function. In addition, pH is modulated by changes in the rate of CO2 elimination by the lungs. The rate of O2 supply and CO2 elimination depends on changes in respiratory rate, tidal volume, effective pulmonary blood flow, ventilation–perfusion matching or mismatching, diffusion capacity of O2 at the blood–alveolar interface, appropriate functioning of breathing mechanisms, and large and small airway patency and size.
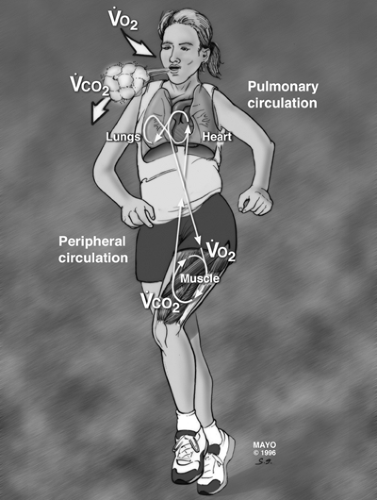 Figure 4.1 • Illustration of the interaction of the lungs, heart, and musculoskeletal system during exercise. |
The pulmonary, cardiovascular, and skeletal muscle systems are the three serially connected systems that are most important in facilitating work performance and instant-to-instant regulation of work performance (see Fig. 4-1). However, sustained and repetitive work cannot occur without appropriate renal function for eliminating additional waste products of oxidation and anaerobic metabolism, maintaining physiologic hydrogen ion concentration, and adjusting intracellular and extracellular plasma volume. In addition, because muscle contraction is a heat-producing process, the skin is critically important for thermal regulation.
Work performance requires a complex and intricate interaction of multiple organ systems. Abnormalities in any of these organ systems will affect and potentially limit work performance. When any one of these organ systems reaches maximal functional capacity, the performance of additional work will be limited.
Work, Power, and Maximal Aerobic Power
Exercise involves the performance of work and the application of power. Work is the application of force to move a mass for a given distance (work = force × distance). The unit of force is the Newton (force = mass × acceleration). One Newton is the force that gives a mass of 1 kg an acceleration of 1 m per second2. A term that has been used to describe this force is the kilopond (kp). One kp is the force acting on a mass of 1 kg at the normal
(i.e., earth) acceleration of gravity (1 kp is equal to approximately 10 N). Because work equals force multiplied by distance, the unit for work is Newton-meter, or joule (J). Because most exercise testing is done on earth, kilopond-meter (kpm) is frequently used as a unit of work for clinical exercise testing. Energy is necessary to perform work, and the relationship between energy and work is constant, described as 1 kilocalorie = 4.1868 J. Power is work performed per unit time. This can be expressed as kpm per second or J per second. A common conventional expression of power is watt (1 W = 1 J per second = 6.12 kpm per minute).
(i.e., earth) acceleration of gravity (1 kp is equal to approximately 10 N). Because work equals force multiplied by distance, the unit for work is Newton-meter, or joule (J). Because most exercise testing is done on earth, kilopond-meter (kpm) is frequently used as a unit of work for clinical exercise testing. Energy is necessary to perform work, and the relationship between energy and work is constant, described as 1 kilocalorie = 4.1868 J. Power is work performed per unit time. This can be expressed as kpm per second or J per second. A common conventional expression of power is watt (1 W = 1 J per second = 6.12 kpm per minute).
An important central issue to be addressed in exercise testing is the ability of an individual to perform work. The amount of work an individual can do could be used to define “exercise capacity,” “fitness,” or “aerobic power.” However, it is difficult to measure work accurately. Although many different indices can be used to describe fitness or maximal exercise capacity, the maximum O2 uptake ([V with dot above]O2 max) that can be achieved during exercise is, perhaps, the best index. The term maximal aerobic power has been used to indicate the highest achievable level of [V with dot above]O2 during exercise and is used throughout this chapter. Because energy is necessary to perform work, energy production requires combustion of fuel (food), and combustion of fuel requires O2, there is a predictable relationship between work and [V with dot above]O2 (see Fig. 4-2).
Technically, [V with dot above]O2max is defined by the plateau of [V with dot above]O2 that occurs despite continued work (Fig. 4.2), which illustrates the fact that work can be performed using anaerobic mechanisms of energy production. But the amount of work that can be performed using anaerobic means is quite limited.
In assessing the cardiorespiratory responses to exercise, it is important to know the subjects’ degree of effort. A maximal effort is necessary to accurately quantify [V with dot above]O2max, which is defined as the highest [V with dot above]O2 achieved despite continued work. Unfortunately, it is difficult to motivate many untrained subjects and most children to exercise to that point. Obviously, a subject is quite anaerobic at true [V with dot above]O2max, and continued exercise is uncomfortable. Because of this, the term peak [V with dot above]O2, peak exercise study, or peak effort has been coined to
refer to a symptom- or discomfort-limited clinical exercise test. In such tests, a true [V with dot above]O2max may not have been attained.
refer to a symptom- or discomfort-limited clinical exercise test. In such tests, a true [V with dot above]O2max may not have been attained.
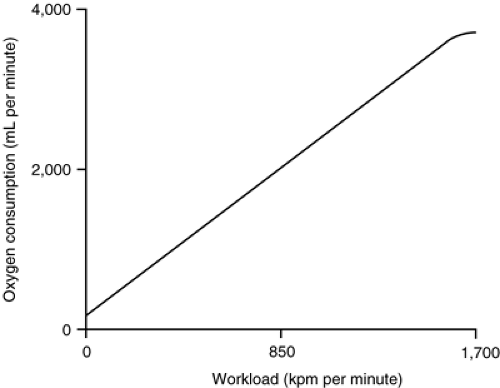 Figure 4.2 • Illustration of the linear relationship of [V with dot above]O2 and work. Note the plateau of [V with dot above]O2 at the highest workload. |
At all ages, boys have a higher [V with dot above]O2max than girls. [V with dot above]O2max increases with increasing body mass. However, if [V with dot above]O2max is indexed to lean body mass, there is no difference between boys and girls in its achievable values. If [V with dot above]O2max is indexed to weight (kilograms), it remains relatively the same for boys aged between 6 and 18 years but declines over this age range for girls. This decline in girls probably represents the effect of increased body fat (or decreased lean body mass).
Investigators have searched for the best method of indexing [V with dot above]O2. Considerable controversy still exists about the best method, if, indeed, one exists. On the basis of the “dimensionality theory,” some have proposed the use of an exponent of body length. Various investigators have proposed the use of an exponent from 1.5 to 3.2. However, the most commonly accepted method of indexing [V with dot above]O2 in clinical exercise testing is to use body weight (kilograms).
The maximum [V with dot above]O2 achieved during work will depend on the type of work performed. For example, one can repetitively flex one’s index finger until the finger is exhausted and can no longer be flexed. However, maximum O2 uptake during this maximum activity will not be very high because only a small muscle group is working. In contrast, [V with dot above]O2max will be considerably higher if one repetitively flexed a knee because larger muscle masses are working and more work is being performed. Similarly, one can achieve higher [V with dot above]O2max during treadmill than during cycle exercise because more muscle groups are working.
Over the last several years, considerable attention has been focused on the so-called anaerobic threshold as a measure of aerobic power. Theoretically, it might allow the assessment of exercise capacity using a submaximal exercise study, a potential advantage in children who have difficulty in achieving a true [V with dot above]O2max. The anaerobic threshold is defined as the [V with dot above]O2 at which there is a disproportionate increase in minute ventilation ([V with dot above]E) relative to O2 uptake (see Fig. 4.3(A)). In adults, there is frequently a disproportionate increase in lactate production at this point as well, hence the term anaerobic threshold. However, a disproportionate change in lactate level is not necessary for a disproportionate change in [V with dot above]E to occur. Therefore, the term anaerobic threshold may be a misnomer. Some investigators prefer to use the term ventilatory anaerobic threshold or ventilatory threshold. The anaerobic threshold is identified by an abrupt change in the slope of [V with dot above]E and the ventilatory equivalent for O2 ([V with dot above]E/[V with dot above]O2) without a concomitant change in the ventilatory equivalent for CO2 ([V with dot above]E/[V with dot above]CO2). In addition, there will be an increase in end-tidal PO2 without an increase in PCO2.
Cardiac Responses to Exercise
Heart Rate
For healthy individuals, increased heart rate during exercise is the major determinant of increased cardiac output. There is a linear relationship between heart rate and [V with dot above]O2max (Fig. 4.3(B)). Each individual has a maximum heart rate (HRmax) that can be achieved but not exceeded during exercise. This HRmax is an important determinant of [V with dot above]O2max. For subjects aged between 5 and 20 years, HRmax is approximately 195 to 215 beats per minute. The HRmax for children younger than 5 years probably is similar, but it is difficult to motivate these young children to perform a truly maximal test. For subjects older than 20 years, HRmax = 210 – 0.65 × age. The reasons for the decline of HRmax with age are unclear but may be related to fibrosis and scarring of the sinoatrial node.
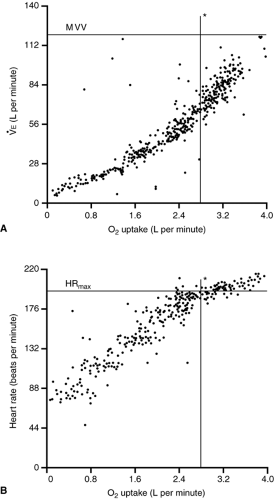 Figure 4.3 • Graphic representation of the change of ventilation relative to [V with dot above]O2 (A) and that of heart rate relative to [V with dot above]O2 (B). The horizontal and vertical lines represent the predicted normal for this subject. Note that the subject is very fit. The subject has exceeded the predicted [V with dot above]O2max. MVV, maximum voluntary ventilation. |
Maximum heart rate will vary slightly, depending on the exercise protocol used and the type of exercise performed. For example, a slightly higher HRmax is obtained for treadmill than for cycle exercise.
Four typical heart rate responses to exercise are illustrated in Figure 4.4. The “normal” graph represents the heart rate response of a healthy subject with an HRmax of 200 beats per minute and a [V with dot above]O2max of 2.5 L per minute during exercise. When a heart rate of 200 beats per minute is attained, the subject stops exercising. Achieving HRmax could be considered indicative of achieving a maximum cardiorespiratory effort. However, technically it is not. Some very fit individuals can continue exercising while the heart rate remains at its maximum value for 1 to 2 minutes. Obviously, this can occur only at the expense of extreme anaerobiosis. The curve labeled conditioned illustrates the heart rate response if
the subject improves his or her physical fitness. With improved fitness, resting heart rate declines. Maximum heart rate does not increase but occurs at a higher [V with dot above]O2max. The curve labeled deconditioned illustrates the effect of deconditioning on heart rate. Resting heart rate is higher than that of the control, and HRmax occurs at a lower [V with dot above]O2. The curve labeled submaximal could represent simply a limited cardiorespiratory effort. This curve also is typical of patients with chronotropic insufficiency, that is, the HRmax is low. This occurs in many patients with heart disease with or without prior cardiac operation.
the subject improves his or her physical fitness. With improved fitness, resting heart rate declines. Maximum heart rate does not increase but occurs at a higher [V with dot above]O2max. The curve labeled deconditioned illustrates the effect of deconditioning on heart rate. Resting heart rate is higher than that of the control, and HRmax occurs at a lower [V with dot above]O2. The curve labeled submaximal could represent simply a limited cardiorespiratory effort. This curve also is typical of patients with chronotropic insufficiency, that is, the HRmax is low. This occurs in many patients with heart disease with or without prior cardiac operation.
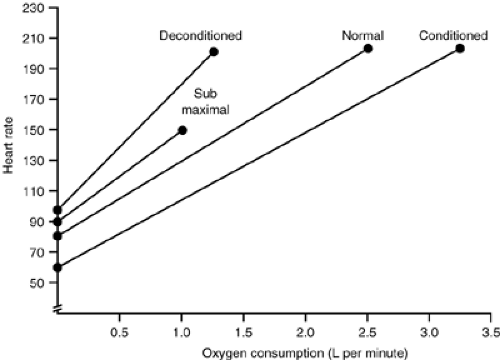 Figure 4.4 • Illustration of the change of heat rate with increasing work or [V with dot above]O2. Four states are shown: (i) normal, (ii) deconditioned, (iii) conditioned, and (iv) submaximal effort. |
Blood Pressure
During isotonic exercise, systolic blood pressure increases (see Fig. 4-5). Diastolic blood pressure may vary within 10 mm Hg from its level at rest, but, on average, it remains the same during exercise. Larger-sized children have a higher blood pressure on submaximal and maximal exercise than smaller-sized children. Among similar-sized children, boys have higher peak systolic blood pressure than girls.
Stay updated, free articles. Join our Telegram channel

Full access? Get Clinical Tree


