Current guidelines recommend troponin T (TnT) as the biomarker of choice in the diagnosis of myocardial infarction. In patients with ST-elevation myocardial infarction (STEMI) however, its role in providing a measurement of infarct size and its association with survival is less well established. We sought to assess the correlation of TnT and creatine kinase-MB (CK-MB) with scintigraphically determined infarct size and to assess the predictive value of all 3 parameters on 12-month mortality. Patients presenting with STEMI managed with primary percutaneous intervention underwent serial TnT and CK-MB measurements at admission and for ≥72 hours after presentation. Before hospital discharge patients underwent assessment of infarct size by technetium-99m sestamibi single-photon emission computed tomographic (SPECT) scan. Clinical follow-up was performed up to 1 year. Data were available for 1,237 patients. Mean age was 62.9 ± 12.9 years. Infarct location was anterior in 509 patients (41%); 75 (6.1%) had cardiogenic shock. Median admission and peak TnT were 0.74 μg/L (0.10 to 2.70) and 3.70 μg/L (1.69 to 6.99), respectively. Corresponding values for CK-MB were 44.1 U/L (21.0 to 108.8) and 160.0 U/L (69.0 to 301.0), respectively. Median infarct size on SPECT scan was 12.0% (3.0 to 25.0) of the left ventricle. Peak TnT and CK-MB demonstrated similar moderate correlation with final infarct size (r = 0.45, p <0.001, and r = 0.41, p <0.001 respectively). This correlation was not affected by Thrombolysis In Myocardial Infarction flow grade after intervention. At 1 year, 47 patients (3.8%) had died. Final infarct size at SPECT scanning better predicted mortality than peak TnT or CK-MB. In conclusion, this study is the largest investigation on the value of cardiac troponin for assessment of infarct size in acute STEMI. Compared to peak CK-MB, peak TnT shows similar correlation with scintigraphic infarct size, although scintigraphic infarct size remains a better correlate of 1-year mortality than either biomarker.
Although cardiac troponin has supplanted the creatine kinase-MB isoform (CK-MB) as the biomarker of choice in the diagnosis of acute myocardial infarction, its role in providing an estimate of infarct size in patients presenting with ST-elevation myocardial infarction (STEMI) is less well established. The aim of the present study was to assess the correlation between peak plasma levels of cardiac troponin T (TnT) and CK-MB with scintigraphically determined myocardial infarct size in patients with STEMI undergoing contemporary primary percutaneous intervention (PCI) and to examine the value of all 3 measurements in the prediction of mortality at 1 year.
Methods
This prospective registry included 1,237 patients with acute STEMI who underwent primary PCI and scintigraphic evaluation of infarct size at 2 centers in Munich, Germany—Deutsches Herzzentrum and 1 Medizinische Klinik, Klinikum rechts der Isar—from June 2003 to January 2008. Included patients were those with acute MI presenting <24 hours after onset of symptoms, which was defined as chest pain lasting ≥20 minutes and ≥0.1-mV ST-segment elevation in ≥2 limb leads or ≥0.2-mV elevation in ≥2 contiguous precordial leads or presumed new left bundle branch block on surface electrocardiogram.
All patients received clopidogrel 600 mg orally, a bolus of aspirin 500 mg, and heparin 60 U/kg body weight (up to a maximal dose of 5,000 U) intravenously at the emergency room or intensive care unit of the admitting hospital. Abciximab therapy was administered at the discretion of the operator or as determined by random allocation in the setting of a randomized control trial. All patients were sent to the catheterization laboratory for coronary angiography and percutaneous intervention; the recommended intervention was coronary stenting. Time to treatment was defined as time from symptom onset to balloon inflation. After reperfusion, all patients were treated with clopidogrel 75 mg 2 times/day for 3 days and 75 mg/day thereafter for ≥30 days and with aspirin 100 mg 2 times/day indefinitely. Other cardiac medications were given as judged to be required by the patient’s physician.
Blood samples were drawn at 8, 16, and 24 hours after the intervention and daily thereafter during hospitalization. Blood was collected into tubes containing Li-Heparin and processed immediately. Quantitative determination of TnT was performed using an electrochemiluminescence immunoassay on an Elecsys 2010 analyzer (Roche Diagnostics, GmbH, Mannheim, Germany). In healthy subjects the upper reference limit (99th percentile) is <0.01 ng/mL (micrograms per liter), whereas the cut-off point providing 10% coefficient of variation and thus representing the conventional upper limit of normal with this assay is 0.03 ng/mL. The catalytic activity of CK-MB (EC 2.7.3.2; adenosine triphosphate: creatine N-phosphotransferase) in plasma was determined using a COBAS INTEGRA system (Roche Diagnostics). After immunoinhibition with antibodies to the CK-M subunit, CK-B activity is determined with a method according to recommendations of the International Federation of Clinical Chemistry. Activity of the CK-B subunits is determined and multiplied by 2 to provide an estimate of CK-MB activity. The reference range (37°C) is 7 to 25 U/L (0.12 to 0.421 μkat/L). There is high probability of myocardial damage when the following 3 conditions are fulfilled: (1) CK values >190 U/L (3.12 μkat/L) in men and >167 U/L (2.87 μkat/L) in women, (2) CK-MB >24 U/L (0.40 μkat/L), and (3) CK-MB activity accounting for 6% to 25% of total CK activity. Laboratories at the 2 enrolling centers use identical analytic methods, equipment, and standard calibration samples for analysis of TnT and CK-MB. Glomerular filtration rate was estimated from the Cockcroft-Gault formula.
Performance of myocardial scintigraphic scan before hospital discharge in patients with STEMI is routine procedure in our institution to assess the prognosis of patients. A single-photon emission computed tomographic (SPECT) study was performed after intervention (typically on day 4 or 5) using technetium-99m sestamibi. Patients received an intravenous injection of 27 mCi (1,000 MBq) for technetium-99m SPECT scanning as described previously. With dedicated software (Icon 6.0.2, Siemens Medical Systems, Inc., Hoffman Estates, Illinois) transaxial slices were reconstructed. Images were acquired in a 64 × 64 matrix with an acquisition time of 40 seconds per image. A volumetric sampling tool was applied to create polar maps of relative distribution throughout the entire left ventricle. Each polar map was normalized to its individual maximum. The defect size was defined as <50% uptake area. This threshold was based on phantom studies performed at the Klinik und Poliklinik für Nuklearmedizin, Klinikum rechts der Isar Technische Universität (Munich, Germany) using previously described methods. Final infarct size was measured as the perfusion defect on the SPECT study and expressed as percent left ventricle. Measurements were performed in the scintigraphic core laboratory by investigators unaware of clinical or angiographic data.
Qualitative and quantitative analyses of angiographic parameters were performed at the angiographic core laboratory (ISAResearch Center, Munich, Germany). Left ventricular angiograms in the right anterior oblique projection were used to measure left ventricular ejection fraction. Initial and final flows in the infarct related artery were graded according to the Thrombolysis In Myocardial Infarction flow classification. Digital angiograms were analyzed off-line with the automated edge detection system CMS 7.1 (Medis Medical Imaging Systems, Leiden, the Netherlands).
During the hospital stay, electrocardiographic recordings and determination of cardiac biomarkers, hemoglobin content, and platelet count were performed on admission and at 8, 16, and 24 hours after intervention and daily thereafter. After discharge, assessment of clinical status was made by office visit or telephone interview at 30 days, 6 months, and 12 months. The primary clinical end point of interest was 12-month mortality. Information about death was obtained from hospital records, death certificates, or telephone contact with relatives of the patient or the attending physician.
Continuous data are presented as mean ± SD or median (25th to 75th percentiles). Categorical data are presented as counts or proportions (percentages). Correlations of TnT and CK-MB with each other and with SPECT final infarct size were assessed using Spearman rank correlation. Subgroup analysis of correlations was performed for postprocedure Thrombolysis In Myocardial Infarction flow grade 3 or <3. A Cox proportional hazards model was constructed to assess predictors of 1-year mortality. Clinical factors deemed most relevant were entered into the model: age, gender, diabetes, presence of cardiogenic shock, time to treatment, Thrombolysis In Myocardial Infarction grade flow at presentation, peak TnT, peak CK-MB, and SPECT final infarct size. Comparison of predictive value of peak TnT, peak CK-MB, and SPECT final infarct size for 1-year mortality was also performed by Kaplan-Meier analysis of subgroups above and below the median value for each parameter. Differences in survival were assessed with log-rank test. Analyses were performed with S-PLUS 4.5 (Insightful Corp., Seattle, Washington) and SPSS 17.0 (SPSS, Inc., Chicago, Illinois). A 2-tailed p value <0.05 was considered to indicate statistical significance.
Results
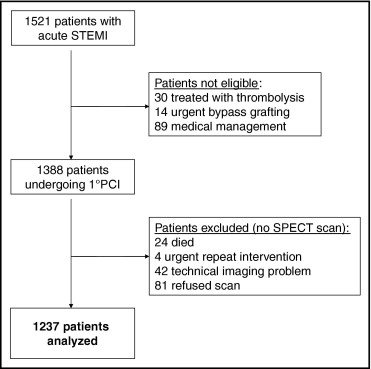
The study sample consists of 1,237 patients with acute (<24 hours) STEMI undergoing primary PCI. The flow of study participants is shown in Figure 1 . Baseline patient characteristics are listed in Table 1 . Median age was 62.9 ± 12.9 years. Diabetes mellitus was diagnosed in 261 (21%). Infarct location was anterior in 509 patients (41%). Baseline ejection fraction was 48% (40 to 55). Seventy-five (6.1%) had cardiogenic shock at presentation.
| Variable | STEMI |
|---|---|
| (n = 1,237) | |
| Age (years) | 62.9 ± 12.9 |
| Men | 942 (76.2%) |
| Body mass index (kg/m 2 ) | 27.0 ± 4.1 |
| Diabetes mellitus | 261 (21.1%) |
| Hypertension | 891 (72.0%) |
| Current smoker | 489 (39.5%) |
| Hyperlipidemia | 690 (55.8%) |
| Previous myocardial infarction | 161 (13.0%) |
| Previous coronary bypass surgery | 46 (3.7%) |
| Ejection fraction (%) | 47.3 ± 11.3 |
| Myocardial infarct localization | |
| Anterior | 509 (41.2%) |
| Inferior | 528 (42.7%) |
| Lateral | 200 (16.2%) |
| Time to treatment (hours) | 7 (3.8–15.2) |
| Cardiogenic shock | 75 (6.1%) |
| Blood pressure (mm Hg) | |
| Systolic | 130.7 ± 24.8 |
| Diastolic | 71.5 ± 12.7 |
| Heart rate (beats/min) | 77.0 ± 16.5 |
| Serum creatinine (mg/dl) | 1.0 ± 0.3 |
| Glomerular filtration rate (ml/min) | 88.4 ± 34.6 |
Procedural characteristics are presented in Table 2 . Balloon angioplasty alone was performed in 116 (9.4%), with the remaining 1,121 (90.6%) patients undergoing stent implantation. Postprocedure Thrombolysis In Myocardial Infarction grade 3 flow occurred in 1,114 patients (90.1%).
| Variable | STEMI |
|---|---|
| (n = 1,237) | |
| Multivessel coronary disease | 831 (67.2%) |
| Infarct-related coronary artery | |
| Left main stem | 9 (0.7%) |
| Left anterior descending | 526 (42.5%) |
| Left circumflex | 191 (15.4%) |
| Right | 486 (39.3%) |
| Bypass graft | 25 (2.0%) |
| Infarct lesion location | |
| Proximal vessel | 188 (15.2%) |
| Midvessel | 548 (44.3%) |
| Distal vessel | 501 (40.5%) |
| Thrombolysis In Myocardial Infarction grade flow | |
| Before procedure | |
| 0 | 601 (48.6%) |
| 1 | 136 (11.0%) |
| 2 | 244 (19.7%) |
| 3 | 256 (20.7%) |
| After procedure | |
| 0 | 30 (2.4%) |
| 1 | 16 (1.3%) |
| 2 | 77 (6.2%) |
| 3 | 1,114 (90.1%) |
| Reference vessel diameter (mm) | 2.92 ± 0.55 |
| Intervention | |
| Balloon angioplasty | 116 (9.4%) |
| Stenting | 1,121 (90.6%) |
| Procedural success | 1,174 (94.9%) |
| Abciximab therapy | 760 (61.4%) |
Median number of biomarker samples per patient was 8.0 (4.0 to 10.0). Median admission TnT was 0.74 μg/L (0.10 to 2.70) and peak TnT was 3.70 μg/L (1.69 to 6.99). CK-MB levels at admission and peak were 44.1 IU (21.0 to 108.8) and 160.0 IU (69.0 to 301.0), respectively. Admission and peak total CK levels were 287 IU (124 to 760) and 1,420 IU (613 to 2,584), respectively; C-reactive protein at admission was 5.00 mg/dl (0.76 to 13.6).
Single-photon emission computed tomography using technetium-99m sestamibi was performed for all patients at a median of 5.1 days after admission. Median infarct size was 12.0% (3.0 to 25.0) of the left ventricular mass.
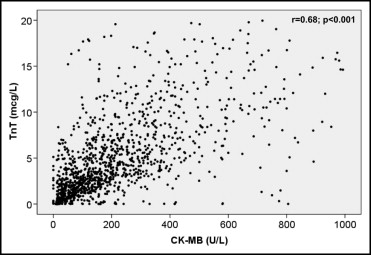
As shown in Figure 2 , peak TnT and CK-MB correlated significantly (r = 0.68, p <0.001). Peak TnT and CK-MB demonstrated a similar moderate correlation with SPECT final infarct size (r = 0.45, p <0.001, and r = 0.41, p <0.001, respectively; Figure 3 ). Correlation of TnT with infarct size did not appear to be affected by Thrombolysis In Myocardial Infarction flow grade after intervention (grade <3, r = 0.46, p <0.001, vs grade 3, r = 0.44, p <0.001).