Pathology of the Cardiac Valves

Chapter 11


Pathology of the Cardiac Valves


F. Luke Aldo and Enrique Pantin


Cardiac valves… hopefully somewhere somebody talked about normal valves…


Cardiac valves are like any other valve, they help direct flow in the desired direction, and the cardiac ones have to do this about 3–3.5 billon times without failing. I want the same warranty for my car!!! Simply, they have to open completely and then close completely.


NORMAL VALVE AREA CM2
Aortic valve 3–4
Mitral valve 4–5
Pulmonic valve 3.5–4.5
Tricuspid valve 5–8

No matter which one we are talking about, the four cardiac valves all have to do the same thing, open and close and nothing else… talk about a boring job. The valves can only work if there is blood being pumped through the heart, usually by the heart, but sometimes by a superhero trying to save a life by pumping on the chest. There are only two main problems with valves: insufficiency/leaky/open when it should be closed and stenosis/narrowed/somewhat closed when it should be open. There are however several reasons why they get messed up. Blood pumped through relatively narrow holes (which the valves are) causes certain blood velocity increases.


Normal systolic blood velocities through the valves are:


Aortic valve <1.4 m/s
Mitral valve <1.2 m/s
Pulmonic valve <1 m/s
Tricuspid valve <0.8 m/s
Valves and their supporting structures can sustain several types of damage that can cause them to malfunction. For simplicity, valve dysfunction has been categorized as stenosis or insufficiency. Before we continue any further we must always make sure in cases of valvular stenosis that the problem is at the valve level and not a sub- or supra-valvular stenosis. It takes years to develop tight valves, and thus it takes a while to cause problems. Leaky valves can occur over years, but also acutely. As you can imagine, acute valve leakage is not well tolerated by the heart. This often needs immediate medical intervention and usually surgical repair as the heart has no time to compensate for the extra volume load.


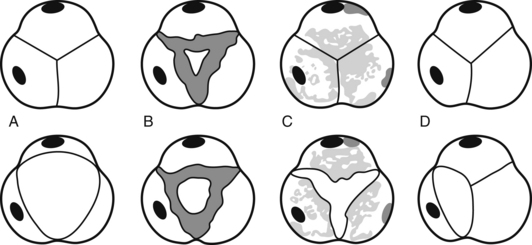
Aortic valve stenosis due to senile calcific degeneration is the most common valve problem in the elderly (>65 years old). Is this really that old?!? In the figure below we see a short-axis view of a normal aortic valve (A). How nice and secure it looks closed, and when it opens a truck can drive through its orifice! This figure is drawn anatomically correct, but as you know when we do TEE, the top will be on the bottom, and the left will be on the right. Unfortunately a lot of stuff in echo is not done anatomically correct because some genius a long time ago decided to be fancy!


image


Rheumatic heart disease (B) is the most common cause of mitral stenosis in general, and is a common cause of aortic stenosis in less developed countries. Rheumatic disease starts with commissural fusion at the leaflet coaptation points and works its way outward towards the perimeter of the valve. This early commissural calcification often gives the so-called “hockey stick” appearance. As we mentioned earlier, in developed countries nobody beats senile calcific aortic stenosis (C). Here calcification starts at the perimeter of the valve and works its way in toward the leaflet edges, which is the exact opposite of rheumatic disease progression. Congenitally defective aortic valves (bicuspid, unicuspid, etc.) can get tight much sooner. A bicuspid aortic valve (D) is the most common cause of aortic stenosis in patients less than 55 years old. Note the upper and larger lower valve leaflets fused with a clearly seen raphe, and the smaller left coronary cusp. The valve comes defective from the factory and you can’t return it. Where is the consumer protection! Nature is definitely smarter than us because they have no lawyers involved in their business!


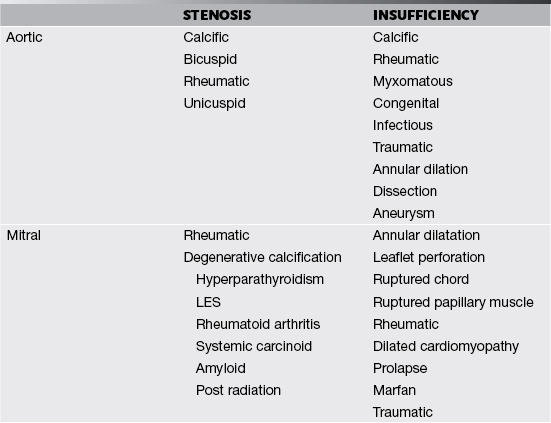
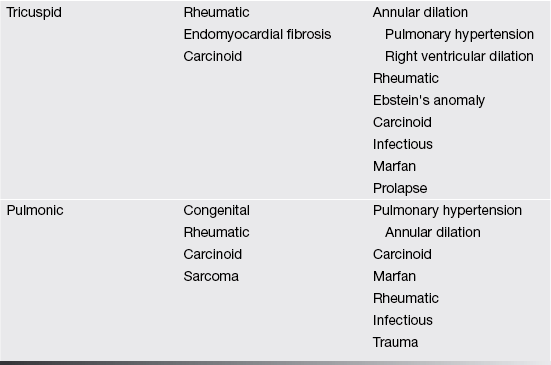
Too much, just see the table below for a list of causes of valvular problems, not necessarily in any particular order.


We are going to concentrate on the two valves that most commonly develop problems, the aortic and the mitral. When assessing valves we use 2-D imaging and Doppler-related measurements: continuous wave Doppler (for faster velocities, usually greater than 2–2.5 m/s), pulsed-wave Doppler (for slower velocities, anything less than 2–2.5 m/s), and color flow Doppler (will give us an idea about what the blood flow pattern is). We can also use 3-D, but this is a bit esoteric for us. We know what the normal velocities through the valves are and that if the valve gets narrower, in order to allow the passage of the same stroke volume the blood velocity through the smaller orifice will increase proportionally. This is valve stenosis in action. That is it, you’ve got it! End of chapter, we can stop writing! You wish! Valvular regurgitation is diagnosed when we see diastolic valvular flow in the opposite direction it should be going.


Now we are really done! Just kidding, we will explore stenosis and regurgitation a bit more.


You already have read that there are several formulas used to calculate blood velocity using the Doppler effect. Well it is quite simple and we really only need to memorize two Doppler-derived formulas:


Simplified Bernoulli equation


image


image


Continuity equation


In a tube with an area of focal stenosis:


image


Integrating the area under the velocity curve obtained by Doppler we get the Velocity Time Integral (using VTI gives us a more accurate result than just the velocity).


This can also be written as:


image


image


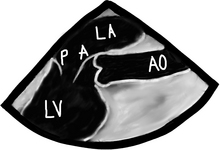
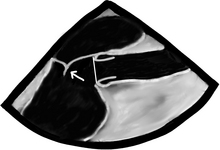
There are a bunch of images and numbers used to categorize the degree of valvular dysfunction. You should always look at the supra-valvular, valvular, and infra-valvular areas. For the aortic valve the mid esophageal long and short axis, and then the deep transgastric views are ideal. The first two will provide a lot of anatomical data and the last one is the best for Doppler measurements. In the ME AV LAX view (during systole and diastole) the areas above, below, and at the level of the valve can be examined in 2-D and then color flow Doppler. The first image below is named Mid Esophageal Aortic Valve LAX (Long Axis) view and is usually obtained at a multiplane angle of about 130 degrees. The image was taken in ventricular diastole; note that the mitral valve is open, and the aortic valve is closed. LA = left atrium; P = posterior mitral valve leaflet; A = anterior mitral valve leaflet (the anterior mitral leaflet is always the closest to the aortic valve); LV = left ventricle; AO = ascending aorta. The anterior mitral leaflet in this image corresponds to a segment of the mitral leaflet called “A2”. “A2” length measurement correlates very closely with the ideal mitral valve ring size that needs to be used when a surgeon performs a mitral valve repair in cases of mitral regurgitation. Hey, you can teach this to your surgeon! The second image is in ventricular systole. Notice the closed mitral valve and the amount of mitral leaflet coaptation (arrow), usually greater than 8 mm. A measurement of the aortic valve annulus is taken during systole (white line). This is the best view to measure the aortic annulus.


image


image


At the valvular region, the annulus and leaflets must be closely examined. You also must take a look at the chamber above and below the valve to see the effects of the valvular problem on these chambers. Finally, in cases of mitral or tricuspid insufficiency you must see how the regurgitation affects the pulmonary or hepatic venous flow into the left or right atrium. If the venous flow is reversed into the pulmonary or hepatic veins during systole, there is a high chance that the valvular insufficiency is pretty bad!


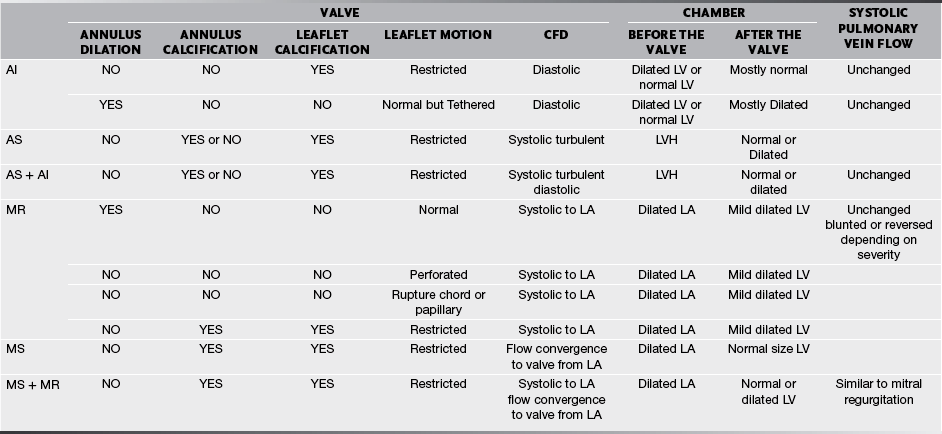
Because we know you have such an open mind, we are going to talk about the two valve problems at once! Not really talk, but just put some stuff into a table. What do you expect? Don’t you know by now we want to finish writing this stuff! Just take a look at the table below, and then take a deeper look. Dissect it, enjoy it, and try to make sense of it! We show you several ways, but not all the ways the valve pathology can present. For example, there could be aortic insufficiency due to calcified leaflets or annular dilation. We will not talk about cardiac symptoms or speed of development of the valvular problem, otherwise we’ll be here forever and most likely you will fall asleep!


Now that we have an idea of what to look for we will try to grade the severity of the valvular problem. PLEASE always make sure to set your CFD scale ≥50 cm/s to avoid over reading flow patterns and scaring the s#@* out of your surgeon after a mitral valve repair! It might be humorous to try on April Fools day, but I wouldn’t make a habit out of it unless you:


Ok, here we go!


We start by having practiced enough 2-D imaging to be able to obtain the 20 standard ASE TEE views. If you can’t, please STOP, and go back until you can identify them and their components. Otherwise, you will say our chapter stinks, when in fact it is you.


The following TEE web page is an AMAZING teaching tool, go there and study it:


http://pie.med.utoronto.ca/tee/TEE_content/TEE_standardViews_intro.html


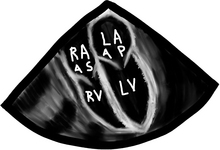
Done? Can you obtain the 20 standard views? Can you do more? Excellent, then let’s move on! We will start at the Mid Esophageal Four-Chamber (ME4C) view that is obtained at a multiplane angle of ZERO degrees. In this view we can see the atria (size, smoke, clots, appendage, and veins draining into them), mitral and tricuspid valves, and both ventricles all in one shot. Are we efficient or what?!? Below is the ME4C view in ventricular diastole: RA = right atrium; AS = tricuspid valve (A = anterior leaflet; S = septal leaflet); RV = right ventricle; LA left atrium; AP = mitral valve (A = anterior leaflet segment “A3”; P = posterior leaflet segment “P1”); and LV = left ventricle.


image

Stay updated, free articles. Join our Telegram channel

Jun 4, 2016 | Posted by in CARDIOLOGY | Comments Off on Pathology of the Cardiac Valves

Full access? Get Clinical Tree

Get Clinical Tree app for offline access