Chapter 1
Pathogenesis of Atherosclerosis and Methods of Arterial and Venous Assessment
Mario De Nunzio1 and Timothy J. England2
1Derby Hospitals NHS Foundation Trust, Royal Derby Hospital, UK
2Division of Medical Sciences & GEM, School of Medicine, University of Nottingham, UK
Pathogenesis of atherosclerosis
Atherosclerosis is a chronic inflammatory disorder that results in hardening and thickening of arterial walls. Although it inevitably accompanies aging, it is not a degenerative process. The initial insult, called a ‘fatty streak’, is a purely inflammatory lesion and has been observed in infants. Over many years, circulating monocyte-derived macrophages adhere to and invade the arterial wall. An inflammatory response, proliferation of vascular smooth muscle cells and deposition of cholesterol and other lipids create arterial plaques. The insult creates a prothrombotic environment and induces the release of inflammatory mediators including cytokines, growth factors and hydrolytic enzymes. Over time, the plaques narrow the arterial lumen (and at times dilate it) and subsequently rupture, causing platelet activation, aggregation and resultant thrombus and embolus formation (Figure 1.1). It remains unclear as to what causes a stable plaque to rupture but it may be due to mechanical stress (e.g. hypertension) and the large lipid core redistributing shear stress over weakened areas of a thin fibrous cap.
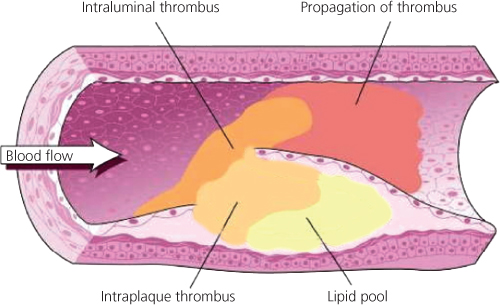
Figure 1.1 Spontaneous rupture or fissuring of an atherosclerotic plaque exposes the lipid-rich core and triggers platelet activation and platelet aggregation. The platelet GP IIb/IIIa receptor activation binds fibrinogen and leads to intravascular thrombus formation, resulting in complete or near-complete vessel occlusion. Clinically, this often presents with a life-threatening unstable event such as an acute coronary syndrome, acute limb ischaemia or stroke.
It is recognised that increasing age, a genetic predisposition, male sex, hypertension, lipid abnormalities (in particular, LDL-cholesterol), diabetes, chronic high alcohol intake and cigarette smoking (causing an increase in free radicals) increase the risk of atherogenesis and endothelial dysfunction. Atherosclerosis mainly affects large and medium-sized arteries at places of arterial branching (e.g. carotid bifurcation). Symptoms occur when there is insufficient blood flow to the vascular bed as a result of
- in situ thrombotic arterial occlusion,
- low flow distal to an occluded or severely narrowed artery or
- embolism from an atherosclerotic plaque or thrombus.
Clots occurring in the venous system are often evaluated referencing the principles of Virchow’s triad, the three broad categories that contribute to thrombosis: venous stasis due to prolonged immobility, endothelial and vessel wall injury, for example, due to radiation or medical devices, and hypercoagulability states such as patients with malignancy or clotting factor deficiency.
Investigating vascular disease
Diagnostic and therapeutic decisions in patients with vascular disease are guided primarily by the history and physical examination. However, the accuracy and accessibility of non-invasive investigations have greatly increased due to technological advances in computed tomography (CT) and magnetic resonance (MR) scanning. Computed tomography angiography (CTA) and magnetic resonance angiography (MRA) continue to evolve rapidly and are best described as ‘minimally invasive’ techniques when used with intravenous (i.v.) contrast. This chapter describes the main investigative techniques used in arterial and venous diseases.
Principles of vascular ultrasound
In its simplest form, ultrasound is transmitted as a continuous beam from a probe that contains two piezoelectric crystals. The transmitting crystal produces ultrasound at a fixed frequency (set by the operator according to the depth of the vessel being examined), while the receiving crystal vibrates in response to reflected waves and produces an output voltage. Conventional B-mode (brightness mode) ultrasonography records the ultrasound waves reflected from tissue interfaces and a two-dimensional picture is built according to the reflective properties of the tissues.
Ultrasound signals reflected off stationary surfaces have the same frequency with which they were transmitted, but the principle underlying Doppler ultrasonography is that signals reflected from moving objects, e.g. red blood cells, undergo a frequency shift in proportion to the velocity of the target. The output from a continuous-wave Doppler ultrasound is most frequently presented as an audible signal (e.g. a hand-held pencil Doppler, Figure 1.2), so that a sound is heard whenever there is movement of blood in the vessel being examined. With continuous-wave ultrasonography, there is little scope for restricting the area of tissue that is being examined because any sound waves that are intercepted by the receiving crystal will produce an output signal. The solution is to use pulsed ultrasound. This enables the investigator to focus on a specific tissue plane by transmitting a pulse of ultrasound and closing the receiver except when signals from a predetermined depth are returning. For example, the centre of an artery and the areas close to the vessel wall can be examined in turn.
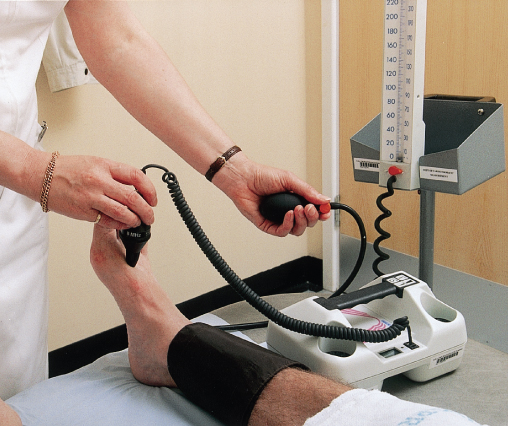
Figure 1.2 A hand-held pencil Doppler being used to measure the ankle–brachial pressure index.
Examination of an arterial stenosis shows an increase in blood velocity through the area of narrowing. The site(s) of any stenotic lesions can be identified by serial placement of the Doppler probe along the extremities. Criteria to define a stenosis vary between laboratories, but a 2-fold increase in peak systolic velocity compared with the velocity in a proximal adjacent segment of the artery usually signifies a stenosis of ≥50% (Table 1.1). The normal (triphasic) Doppler velocity waveform is made up of three components that correspond to different phases of arterial flow (Figure 1.3):
- Rapid antegrade flow reaching a peak during systole
- Transient reversal of flow during early diastole
- Slow antegrade flow during late diastole.
Table 1.1 Relationship between increased blood velocity and degree of stenosis.
| Diameter of stenosis (%) | Peak systolic velocity (m/s)* | Peak diastolic velocity (m/s)* | Internal carotid: common carotid artery ratio† |
| 0–39 | <1.1 | <0.45 | <1.8 |
| 4–59 | 1.1–1.49 | <0.45 | <1.8 |
| 60–79 | 1.5–2.49 | 0.45–1.4 | 1.8–3.7 |
| 80–99 | 2.5–6.1 | >1.4 | >3.7 |
| >99 (critical) | Very low | NA | NA |
* Measured in the lower part of the internal carotid artery.
† Ratio of peak systolic velocity in internal carotid artery stenosis relative to the velocity in the proximal common carotid artery.
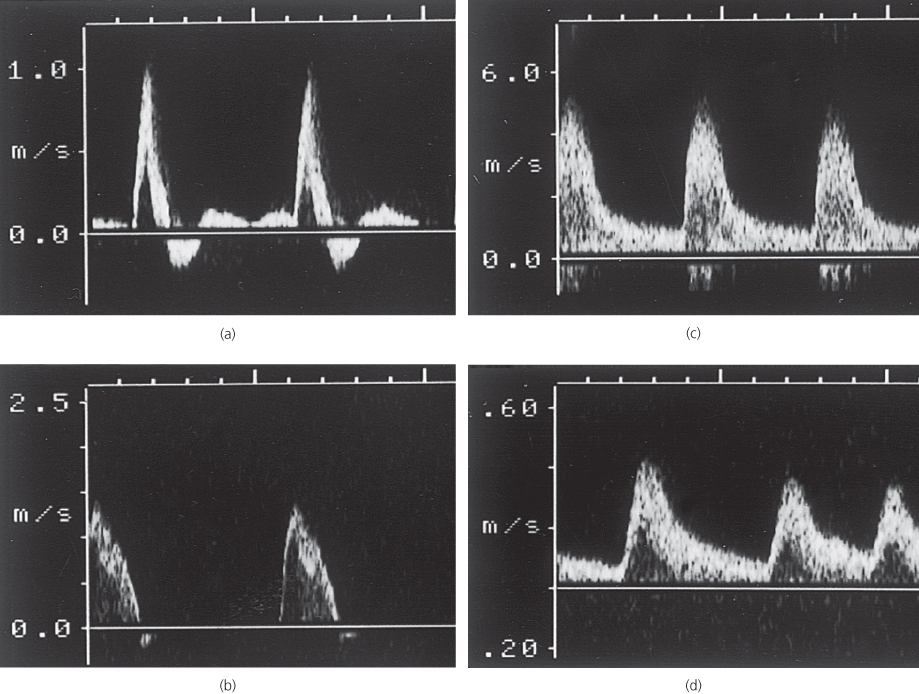
Figure 1.3 Doppler velocity waveforms: (a) a triphasic waveform in a normal artery; (b) a biphasic waveform, with increased velocity, through a mild stenosis; (c) a monophasic waveform, with a marked increase in velocity, through a tight stenosis; and (d) a dampened monophasic waveform, with reduced velocity, recorded distal to a tight stenosis.
Doppler examination of an artery distal to a stenosis shows characteristic changes in the velocity profile (Figure 1.3d):
- The rate of rise is delayed and the amplitude decreased
- The transient flow reversal in early diastole is lost
- In severe disease conditions, the Doppler waveform flattens; in critical limb ischaemia, it may be undetectable.
Investigations of arterial disease
Ankle–brachial pressure index
Under normal conditions, systolic blood pressure (SBP) in the legs is equal to or slightly greater than the SBP in the upper limbs. In the presence of an arterial stenosis, a reduction in pressure occurs distal to the lesion. The ankle–brachial pressure index (ABPI), calculated from the ratio of ankle SBP to brachial SBP, is a sensitive marker of arterial insufficiency in the lower limb. The highest pressure measured in any ankle artery is used as the numerator in the calculation of the ABPI. An ABPI of ≥1.0 is normal and a value <0.9 is abnormal. Patients with claudication tend to have ABPIs in the range 0.5–0.9, while those with critical ischaemia usually have an index of <0.5. In patients with diabetes (in whom distal vessels are often calcified and incompressible), SBP measured in the lower limbs may be less reliable, which can result in falsely high ankle pressures and a falsely elevated ABPI.
Exercise testing will assess the functional limitations of arterial stenoses and differentiate occlusive arterial disease from other causes of exercise-induced lower limb symptoms, e.g. neurogenic claudication secondary to spinal stenosis. A limited inflow of blood in a limb with occlusive arterial disease results in a fall in ankle SBP during exercise-induced peripheral vasodilatation. Patients can exercise for 5 min, ideally on a treadmill, but walking in the surgery or marking time on the spot are perfectly adequate. ABPI is measured before and after exercise. A pressure drop of ≥20% indicates significant arterial disease (Figure 1.4). If there is no drop in ankle SBP after a 5-min brisk walk, the patient does not have occlusive arterial disease proximal to the ankle in that limb.
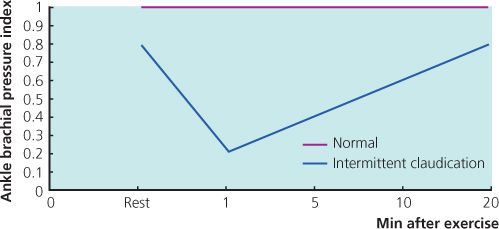
Figure 1.4 The fall in ABPI with exercise in a patient with intermittent claudication.
Duplex scanning
By combining the pulsed Doppler system with real-time B-mode ultrasound imaging of vessels, it is possible to examine (or ‘sample’) Doppler flow patterns in a precisely defined area within the vessel lumen. This combination of real-time B-mode sound imaging with pulsed Doppler ultrasound is called duplex scanning. The addition of colour frequency mapping makes the identification of arterial stenoses even easier and reduces scanning time (Figure 1.5).
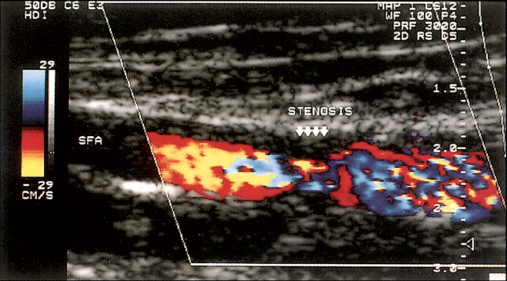
Figure 1.5 Colour duplex scanning of blood flow through a stenosis of the superficial femoral artery (SFA). The colour assignment (red or blue) depends on the direction of blood flow, and colour saturation reflects velocity of blood flow. Less saturation (mixed red and blue) indicates regions of higher blood flow, and deeper colours indicate slower flow; the absence of flow is coded as black.
In detecting femoral and popliteal disease, duplex ultrasonography has a sensitivity of 80% and a specificity of 90–100%, but ultrasound is less reliable for assessing the severity of stenoses in the tibial and peroneal arteries (Table 1.2). The National Institute of Clinical Excellence (NICE) advises the use of duplex scanning as first-line imaging to all people with suspected lower limb peripheral arterial disease for whom revascularisation is being considered (Box 1.1). Duplex scanning is especially useful for assessing the carotid arteries and for routine surveillance of infrainguinal bypass grafts where sites of stenosis can be identified before complete graft occlusion occurs and before there is a significant fall in ABPI. The normal velocity within a graft conduit ranges between 50 and 120 cm/s. As with native arteries, a 2-fold increase in peak systolic velocity indicates a stenosis of ≥50%. A peak velocity of <45 cm/s occurs in grafts at high risk of failure.
Table 1.2 Uses of colour duplex scanning.
| Arterial | Venous |
Identify obstructive atherosclerotic disease:
| Diagnosis of deep vein thrombosis above the knee |
| Assessing competence of valves in deep veins | |
| Surveillance of infrainguinal bypass grafts | Superficial venous reflux:
|
| Surveillance of lower limb arteries after angioplasty | |
| Pre-operative mapping of saphenous vein |

Full access? Get Clinical Tree


