Fig. 2.1
Illustration showing the three components of LV “afterload” and their measurements. The non-pulsatile or static component is total peripheral resistance or mean arterial pressure and the dynamic or pulsatile components are wall stiffness and wave reflections. Measurements of arterial stiffness include characteristic impedance (Z c), pulse wave velocity (PWV), and distensibility; measurements of wave reflection include reflected wave amplitude (AP), augmentation index (AIx = AP/PP), reflection magnitude (RM = AP/P1), and amplitude of the first (or fundamental) harmonic input impedance moduli (Z 1). Changes in any (or all) of these load components can alter ventricular performance
The forward-traveling pressure and flow waves generated by the LV are transmitted by the macrocirculation and are partially reflected at sites of impedance change or mismatch, such as points of branching and/or tortuosity, change in lumen diameter (taper), and physical properties along the macrocirculation system [2, 3, 35, 51, 52]. Multiple small reflections are transmitted back toward the LV and merge into a larger “net” reflected wave, composed of the contributions of all the smaller backward scattered reflected waves. This reflected wave is most often a single discrete wave, originating from an “effective” reflection site, but is actually the resultant of multiple scattered reflections, originating from distributed reflection sites in the lower body [3, 53]. In addition to hemodynamic phenomena related to wave travel and reflections, the large elastic arteries exert a buffering function, which depends on its stiffness and allows them to accommodate additional blood volume during systole without excessive increases in pressure and in turn to release that excess volume throughout diastole without excessive drops in blood pressure [2, 54].
2.5.2 Quantification of LV Afterload
Fourier analyses of ascending aortic pulsatile pressure–flow relations (i.e., aortic input impedance spectra) allow the quantification of various components of LV pulsatile load and “steady” or “resistive” load in the frequency domain (Figs. 2.2 and 2.3) [2, 3, 55–57]. The steady component of afterload depends largely on mean arterial pressure and the peripheral resistance, which in turn depends on arteriolar caliber (microcirculation), the total number of arterioles that are present “in parallel,” and blood viscosity [3, 57, 58]. Therefore, the steady afterload component can be affected by arteriolar tone, arteriolar remodeling, microvascular rarefaction, endothelial function, and changes in blood viscosity. Pulsatile LV afterload is, in contrast, predominantly influenced by the properties of larger macrocirculation arteries (both elastic and muscular) and wave reflections. Although pulsatile LV afterload is fairly complex and cannot be expressed as a single numeric measure, key indices of pulsatile LV afterload can be quantified and summarized using relatively simple principles and mechanical models of the systemic circulation, using time-resolved ascending aortic pressure and flow waves [57, 58]. The large majority of the early studies on LV pulsatile load were performed in dogs and rats with cuff-type flow probes implanted on the ascending aorta and pressure measured with fluid-filled catheter–manometer systems [59] or high-fidelity pressure catheter transducers [60]. Later invasive studies in humans were performed using high-fidelity pressure–velocity catheters [61–65]. Noninvasive assessment of central aortic pressure can now be achieved using high-fidelity applanation arterial tonometry at the carotid artery or by using a generalized transfer (GTF) function to synthesize an aortic pressure waveform from the radial (or brachial) pressure waveform [3, 66, 67]. Pulsatile aortic blood flow can also be measured noninvasively in humans, using pulsed wave Doppler ultrasound [68–70] or phase-contrast magnetic resonance imaging [71]. The most convenient method to assess aortic inflow is pulsed wave Doppler interrogation of the LV outflow tract, given that systolic LV volume outflow equals proximal aortic volume inflow [70]. As stated above, LV afterload can be assessed in the frequency domain from the aortic input impedance spectra (calculated from the harmonic components of central aortic pressure and flow waves) or estimated in the time domain from the central aortic pressure wave (Figs. 2.2 and 2.3) [3, 4, 48–50, 72–74]. Input impedance is the “summed” mechanical load imposed by all vessels downstream of a particular point (and which can be fully assessed by measuring pulsatile flow and pressure at that particular point) [3, 49, 55, 59, 73, 75–77]. Therefore, “aortic input impedance” represents the summed mechanical load impeding LV ejection and represents the “gold standard” for representation of LV afterload [3]. It should be noted that aortic input impedance is not exclusively determined by aortic properties alone, but depends on the physical characteristics of both the macro- and microcirculations and wave reflections [2, 3]. Key parameters of pulsatile LV afterload include the characteristic impedance (Z c) of the ascending aorta and the amplitude and timing of wave reflections (Figs. 2.2 and 2.3) [3, 34, 53, 78, 79]. The characteristic impedance of an artery is a “local” property and can be intuitively calculated as the average of higher harmonics of the aortic input impedance moduli spectrum [61]. Aortic Z c can also be computed in the time domain as the slope of the early systolic pressure–flow relation or as the ratio (P1/ΔQ) [3] where P1 is the amplitude of the forward-traveling pressure wave and ΔQ is the peak aortic blood flow velocity. An estimate of wave reflection amplitude can be obtained from the aortic input impedance spectrum as the first (or fundamental) harmonic of the impedance moduli (Z 1) [3, 61]. It is important to note that the large majority of LV energy (>80 %) is contained within the first and second harmonics; therefore, logical therapy to reduce LV energy (internal and external) should focus on these lower harmonics [5] which are influenced by reflected wave amplitude (AP) in the time domain. Wave reflections are usually assessed via wave separation analysis, based on the superposition principle that reflected waves, by virtue of adding to forward pressure and subtracting from forward flow, distort the linear relationship between the increase in pressure and the increase in flow that is seen in early systole (as a result of the forward wave generated by ventricular contraction) when the pulsatile pressure–flow relation is assumed to be governed purely by ascending aortic Z c (see below).
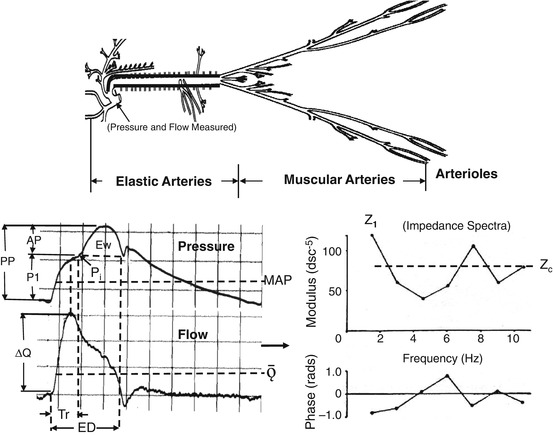
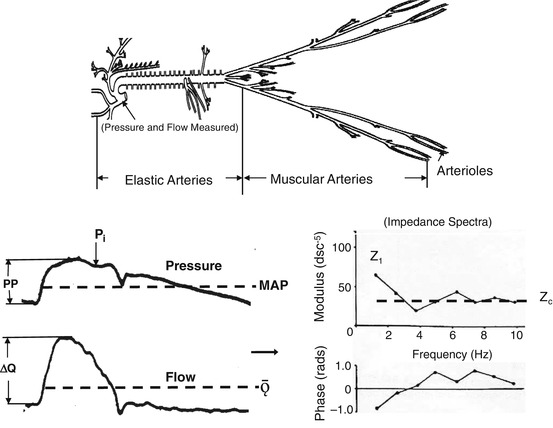
Fig. 2.2
Illustration showing the arterial tree of an older individual with a stiff aorta. Invasive measurements of blood pressure and flow velocity obtained in the ascending aorta (bottom left) and input impedance spectra (bottom right) obtained from these measurements are shown. AP is the reflected wave amplitude, P1 is the forward wave amplitude, PP is the pulse pressure, P i is the inflection point, Ew is the wasted LV energy, ΔQ is the peak flow, Tr is the travel time of the pressure wave, ED is the ejection duration, MAP is the mean arterial pressure, Ǭ is the mean flow, MAP/Ǭ is the peripheral resistance and the impedance at zero frequency (not shown), Z 1 is the amplitude of the fundamental harmonic of impedance moduli, and Z c is the characteristic impedance
Fig. 2.3
Illustration showing the arterial tree of a young adult with a compliant aorta. Invasive measurements of blood pressure and flow velocity obtained in the ascending aorta (bottom left) and input impedance spectra (bottom right) obtained from these measurements are shown. AP is the reflected wave amplitude, P1 is the forward wave amplitude, PP is the pulse pressure, P i is the inflection point, Ew is the wasted LV energy, ΔQ is the peak flow, Tr is the travel time of pressure wave, ED is the ejection duration, MAP is the mean arterial pressure, Ǭ is the mean flow, MAP/Ǭ is the peripheral resistance and the impedance at zero frequency (not shown), Z 1 is the amplitude of the fundamental harmonic of impedance moduli, and Z c is the characteristic impedance
2.5.3 Effect of Arterial Stiffness and Wave Reflections on LV Afterload
The stiffness of various arterial segments of the macrocirculation have complex effects on LV afterload, through their effects on the early aortic systolic pressure rise, the total compliance of the arterial tree, and the velocity at which the pulse waves travel forward in the arteries and reflected waves travel backward toward the heart [2, 3, 50, 72]. In early systole, the forward-traveling energy (flow) pulse from LV contraction produces a forward-traveling pressure wave in the aortic root just distal to the valve. If proximal aortic Z c is high due to a stiff wall, a small aortic diameter, or both, the early part of the pressure wave (P1) (Figs. 2.2 and 2.3) increase is relatively large for any given early systolic flow wave [3, 49, 52, 54]. The time of arrival of the reflected wave at the proximal aorta from the lower body depends on the location of major reflection sites and on PWV along the macrocirculation. Both the forward- and backward-traveling waves are propagated along the macrocirculation at a similar velocity [2, 3, 80, 81]; some investigators have suggested that these velocities may be different and the location of the reflection site may be elusive [82]. Aortic PWV is directly related to the stiffness of the aortic wall (square root of elastic modulus) and inversely proportional to the square root of aortic diameter [3, 52, 83, 84]. Stiffer arteries of the macrocirculation conduct forward- and backward-traveling waves at a greater velocity than compliant arteries and therefore promote an earlier arrival of the reflected wave for any given distance to reflection sites [53, 79, 85–88]. Distance to the major reflection site is strongly dependent on body height (or length) and both elastic and muscular artery stiffness of the macrocirculation. When the elastic arteries become very stiff, for example, with old age, PWV can increase to levels that cause an apparent distal shift of the major reflection site [89]. This usually occurs when elastic artery stiffness matches or exceeds muscular artery stiffness. However, this distal shift of the reflection site does not cause a reduction in wave reflection amplitude or augmentation index [3]. In the presence of normal LV systolic function, typical ill effects of increased amplitude and propagation of the reflected wave on the aortic (and LV) pressure waveform include a mid-to-late systolic shoulder which causes an increase in systolic and pulse aortic pressure and the area under the pressure curve during systole; this area represents the systolic pressure time index (SPTI) [3, 79]. The total arterial compliance of the systemic macrocirculation depends on the summed compliance of the various arterial segments. The compliance of individual segments is linearly proportional to vessel volume (or radius3) and, for any given “relative” vessel geometry (wall volume/lumen volume ratio), linearly and inversely proportional to wall stiffness (Young’s elastic modulus). The interaction between the stiffness and geometry (including taper) of the macrocirculation also impacts location of the major reflection site and amplitude and duration of the reflected wave. Reflected waves that arrive during LV ejection increase the mid-to-late LV systolic workload, SPTI, wasted LV energy (or effort, Ew), and myocardial oxygen demand [1, 3, 4, 40, 41, 60, 90]. It has been proposed that the chronic increase in elastic artery stiffness with age increases wave reflection amplitude and pulse pressure and promotes an excessive penetration of pulsatility further into the microcirculation of target organs with high flow rates such as the heart, the brain, and the kidneys [56, 91–94]. This process reduces the number of SMC [95] and causes endothelial dysfunction [94] which leads to attenuation of the reserve capacity of the vascular bed. Indeed, aortic stiffness and wave reflection amplitude are both inversely related to coronary blood flow reserve (CFR) [96] (see below). An increase in arterial pulsatility resulting from arterial stiffness and wave reflection amplitude has little effect on the systemic arterial circulation to most bodily tissues because their flow is determined by the mean pressure gradient and because cells are protected by the vasoconstricted small arteries and arterioles upstream [56]. Brain and kidney cells receive no such protection because arterial vessels remain somewhat dilated. The large increase in arterial pulsatility is applied to all the distributing arteries in these organs while mean flow is maintained [97]. Brain and kidney arteries of all sizes, including pre-arterioles, are thus subjected to higher pulsatile circumferential stress and higher longitudinal shear stress. Their ability to withstand increased stresses depends on their resilience, and this is markedly decreased in a number of diseases, particularly diabetes mellitus [3, 98]. Increased stiffness of large elastic arteries thus promotes a “setup” for small arterial disease and the types of changes elucidated by Byrom [97, 99] over 50 years ago. Byrom’s work was initially conducted in rats but was applied to the small-vessel disease seen in human hypertension. He showed that damage to small arteries could be induced by increased pulsatile stress and could lead to tearing of their endothelium and SMC with disruption of the vessel wall. He thus explained development of small arterial dilations and aneurysms and the features of lipohyalinosis and of fibrinoid necrosis as seen in the brains and kidneys of hypertensive disease. Byrom further showed that these changes were largely reversible when disrupting forces were reduced [99].
It should be noted that although the timing of arrival of reflected waves from the lower body to the heart is influenced by arterial (both elastic and muscular) stiffness, the relationship between arterial stiffness and reflected wave transit time is relatively poor, presumably given the wide variability in the distance to wave reflection sites. Furthermore, there is not a direct correlation between aortic stiffness and wave reflection amplitude or augmentation index (AIx) over the entire life span [3]. Changes in elastic artery and muscular artery PWV do not always parallel each other. For example, during the aging process elastic artery PWV (and AIx) increases markedly, while muscular artery PWV changes very little. Also, during vasoconstrictor administration (without a large increase in mean arterial pressure) elastic artery PWV changes very little, while muscular artery PWV increases markedly and causes a large increase in AIx [3]. PWV is a measure of arterial stiffness while AIx is an index of the net effect of wave reflection on late systolic and pulse pressure.
Various indices of pulsatile LV afterload are useful because they are meant to be purely reflective of arterial properties and wave reflection. However, arterial load should always be interpreted by considering interactions between arteries as a load and the LV as a pump [3, 100] and also between myocardial elements and instantaneous LV geometry and the time-varying load imposed by both macro- and microcirculations. Wall stress represents the time-varying mechanical load experienced by the contractile elements in the myocardium (myocardial afterload).
Throughout systole, myocardial fiber activation results in the development of tension (stress) and shortening of myocardial segments, which results in progressive ejection of blood from the LV cavity and wall thickening. During early ejection, active development of fiber cross-bridges occurs in the electrically activated myocardium and peak myocardial wall stress occurs [101]. Myocardial fiber shortening and ejection of blood determine a progressive change in LV geometry which causes a drop in myocardial stress (despite rising pressure) during mid-to-late systole [3]. This shift in the pressure–stress relation is related to the ejection process itself and appears to be favorable for the myocardium to handle the additional load imposed by wave reflections and increased LV wasted energy, but may be insufficient and/or compromised in the setting of wave reflections of early onset of large amplitude [102] and in the presence of lower LV ejection fractions or abnormal LV ejection patterns [101, 103]. This may be important, because the myocardium appears to be particularly vulnerable to late systolic loading.
As expected from physiologic principles, various arterial properties affect time-varying myocardial wall stress differently. Whereas systemic vascular resistance is an important determinant of wall stress throughout systole, Z c selectively affects early systole and peak systolic wall stress, wave reflections, and total arterial compliance correlate with myocardial stress in mid and late systole and significantly influence the area under the stress curve generated for any given flow output [104].
An increase in the pulsatile component of afterload causes an undesirable mismatch between the ventricle and arterial system, which increases myocardial oxygen demand and decreases cardiac efficiency [1, 105, 106]. These changes in ventricular/vascular coupling promote the development of LV hypertrophy (LVH) and often lead to both systolic and diastolic myocardial dysfunction [103, 107–111]. Indeed, Jankowski et al. [108] reported that the pulsatile but not the steady component of LV load predicted cardiovascular events in coronary patients. Several lines of evidence support the importance of the LV loading sequence (and not just “absolute” load) in LV remodeling and failure [40, 60, 90]. Late systolic loading (and increase in wasted LV energy) has been shown to induce much more pronounced LVH and fibrosis in an animal model compared to early systolic loading, at identical peak LV pressure levels [60]. Increased late systolic load has also been shown to exert more profound adverse effects on ventricular relaxation than early systolic load, for any given level of peak LV pressure [60]. Consistent with available animal data, changes in wave reflection magnitude (RM = AP/P1) have been reported to correlate with regression of LVH in response to antihypertensive therapy [40], and reflection magnitude has been shown to be strongly associated with incident heart failure and mortality in the general population [45, 82].
2.5.4 Pressure Differences Within the Arterial Tree and Pulse Pressure Amplification
As the pressure wave travels from the heart along the arteries of the macrocirculation, both systolic and pulse pressures (PP) increase markedly, while mean pressure decreases only slightly (−2 mmHg) due to wave reflection and viscous damping [3, 112] (Fig. 2.4). Thus, both systolic and pulse pressures are greater in the arm and leg than in the ascending aorta [3, 87]. This mechanism (PP amplification) ensures that pulsatile load is lower in the elastic ascending aorta versus peripheral muscular arteries and, therefore, minimizes excessive LV pressure energy and subsequent pulsatile afterload [41]. PP amplification (i.e., peripheral PP/central PP) is determined by a combination of factors including LV contractility and ejection duration, heart rate, arterial stiffness (elastic moduli), arterial caliber (and taper), arterial path length, timing and magnitude of wave reflections, and tone of the microcirculation (vascular resistance) [3, 86, 112–115]. From about 30 years of age onward, central aortic PP is the sum of a forward-traveling wave (P1) and a reflected wave (AP) (Fig. 2.2); therefore, PP amplification is influenced by both central aortic stiffness and wave reflection. These factors are interassociated, making it difficult to determine specific primary modulators. Overall, it would appear that wave reflection amplitude explains the largest proportion of the variance in PP amplification with PWV (arterial stiffness) and heart rate making additional notable contributions [112, 115, 116]. Indeed, the degree of amplification is age- and elastic artery stiffness-dependent and decreases as aortic stiffness and wave reflection amplitude increase (Fig. 2.4) [116, 117]. This difference between central and peripheral pressure progression may explain why central aortic pressure tends to be a better predictor of cardiovascular events and outcome than peripheral brachial pressure [118–121]. Since peripheral muscular arteries stiffen little with age [122–125], elastic properties of these vessels alter amplification along the vessels minimally. Thus, transmission (propagation) characteristics in the upper limbs remain relatively constant [126]. However, PP amplification in the proximal elastic aorta is markedly influenced by acute changes in SMC tone of muscular arteries. Increased SMC tone (contraction) increases wave reflection amplitude and reduces PP amplification, while decreased tone (relaxation) has the opposite effect. Reduced PP amplification occurs with aging [3, 86, 117, 127], obesity, and arterial disease (hypertension, diabetes, hypercholesterolemia, coronary artery disease, renal disease) and is associated with traditional cardiovascular risk factors [128, 129] and overall vascular burden [130]. Moreover, PP amplification is associated with overt target organ damage and regression of target organ damage with therapy (i.e., LVH regression with antihypertensive therapy and exercise conditioning) [131], and it independently predicts future cardiovascular mortality [132, 133]. Thus, PP amplification has been proposed as a potential mechanical biomarker of cardiovascular risk and global arterial function. Racial differences in PP amplification have been reported with African American men having lower amplification than their white peers [134] related to increased arterial stiffness and wave reflections [81]. Sex differences in PP amplification also exist, with women (particularly postmenopausal women) having lower values than men [135]. Reasons for this difference have been ascribed to a host of factors including shorter stature in women (reduced height resulting in attenuated arterial path length and movement of reflection sites more proximal), increased PWV affecting timing of the return of the reflected pressure wave, increased aortic taper, and arterial impedance mismatch affecting wave reflection amplitude [3, 136]. Sex differences in PP amplification have been linked to LV diastolic dysfunction in women [111]. In men and women over age 55 years, the mortality impact of PP amplification is threefold higher in women compared to men [137]. Since wave reflections do not alter PP in younger adults, amplification declines as diastolic blood pressure rises, offering insight into well-noted observations that peripheral PP is unrelated to cardiovascular risk in this age cohort [126]. Conversely, loss of PP amplification with aging results in peripheral pressures more closely approximating central pressures, hence increasing the ability of peripheral PP to accurately predict CV risk in older adults [126]. In older adults, PP amplification is predictive of heart failure, ischemic heart disease, atrial fibrillation, and mortality [132, 137]. In young healthy adults, it is also possible for PP amplification to result in spurious systolic hypertension [138]. Seen in taller men with compliant elastic arteries, wave reflections are markedly attenuated and PP amplification profound [139, 140]. The clinical implications of this elevated PP amplification in this population remain to be determined [138]. As noted above, heart rate also makes a notable contribution to PP amplification and this is most likely via effects on wave reflection [141, 142]. With slower heart rate and prolonged systolic ejection duration, there is greater temporal overlap between forward and reflected pressure waves causing an increase in reflected wave amplitude and AIx [3]. It is estimated that for every 10 bpm reduction in HR, there is an increase in AIx of 4 % [142]. This in turn results in a reduction in PP amplification. Medications that reduce heart rate such as β-blockers are associated with reduced PP amplification because these drugs cause an increase in wave reflection amplitude [143, 144]. Interestingly, lifestyle modification that results in bradycardia such as habitual aerobic exercise could possibly result in reduced PP amplification owing to HR-mediated increase in PP from increased wave reflection coupled with reduced arterial stiffness [134, 145]. As stated above, PP amplification is usually calculated as the ratio of the amplitude of the PP between a proximal and distal site. Alternative methods include calculation of absolute PP differences from peripheral to central sites (peripheral PP – central PP) and expressed as the absolute difference from peripheral to central sites relative to the central site [(peripheral PP – central PP)/central PP]. An issue that remains to be resolved pertains to methodology for obtaining central and peripheral PP appraisal. Although the gold standard for PP measurement remains invasive recordings, this is not practical for routine clinical use. Current studies noting clinical utility of PP amplification have calculated central PP noninvasively either via (1) synthesized aortic pressure waves derived from radial pressure waves and a GTF; (2) carotid pressure waves as a surrogate for aortic pressure calibrated against brachial mean and diastolic pressure [112]. While both methods are valid and have merit, neither is without flaw. When using the GTF approach, radial pressure waves are usually calibrated against brachial systolic and diastolic blood pressure, an approach that assumes that pulse pressure in the brachial and radial arteries are identical to each other (i.e., no brachial-to-radial amplification). When using synthesized aortic pressure waves from the GTF approach and brachial pressures obtained from an oscillometric cuff as done in the Anglo-Cardiff Collaborative Trial (ACCT), amplification varies from 1.7 in the young (<20 years of age) to 1.2 in the elderly (>80 years of age) [123]. These results are similar to those reported by Bia et al. [127] over the same age range in the CUiiDARTE Project and those collected by Nichols et al. [3]. When carotid and/or radial pressure waves obtained from applanation tonometry are calibrated against brachial diastolic and tonometric mean pressures (the latter being obtained from a brachial artery tonometric waveform), as was done in the Asklepios Study, PP amplification values tend to be lower [116]. Although not without limitation, measurement of PP amplification from noninvasive central and peripheral pulse recordings has proven superior to brachial cuff measures alone when assessing cardiovascular disease (CVD) burden, identifying individuals at risk for CVD events, and monitoring response to therapy [130, 132].
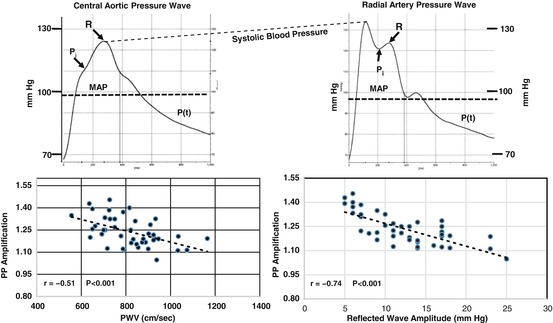
Fig. 2.4
Illustration showing noninvasive measurements of radial artery pressure (upper right) and synthesized central aortic pressure (upper left). P i is the inflection point, R is the peak of the reflected wave, and MAP is the mean arterial pressure. Lower panels show that PP amplification (radial PP/aortic PP) is significantly inversely related to both aortic PWV (lower left) and reflected wave amplitude (AP) (lower right)
2.5.4.1 Components of the Central Aortic Pressure Wave
Figures 2.2 and 2.3 show invasively measured high-fidelity ascending aortic pressure and flow velocity waves in a normal young adult and a middle-aged human. The measured aortic pressure (P) and flow (Q) waves are determined by the interaction (or algebraic sum) of an LV-ejected forward-traveling “incident” wave and a later arriving backward-traveling reflected wave from the lower body [2, 3, 80, 146]. The characteristics of the forward-traveling wave depend, primarily, upon the elastic properties (Z c) of the ascending aorta and are not influenced by wave reflections [3, 67, 147]. Two visible demarcations usually occur on the initial upstroke of the central aortic pressure wave in middle-aged (Fig. 2.2) and older individuals with stiff aortas and elevated Z c: the first shoulder (P1) and the inflection point (P i). These demarcation points occur at an earlier age in patients with hypertension. The first (or early) shoulder is generated by LV ejection and occurs at peak blood flow velocity, while the inflection point occurs later and denotes the initial upstroke of the reflected pressure wave; this wave represents the second (or mid-to-late) systolic shoulder [3, 148, 149]. The first shoulder is an estimate of incident (or forward-traveling) wave with amplitude P1, while the second shoulder is generated by the reflected pressure wave from the lower body with amplitude AP and duration (ED – Tr); ED is ejection duration and Tr is the round trip travel time of the pressure wave to and from the lower body reflection site [3]; AP increases in parallel with the first aortic input impedance moduli (Z 1). When the first shoulder and P i occur simultaneously (or merge), as often occurs in older individuals and patients with severe hypertension, no demarcation is visible. Therefore, if pressure and flow velocity are measured simultaneously, the initial upstroke of the reflected wave, P1, and P i can be determined and AP, AIx, and RM calculated. If flow velocity is not measured and P i is not visible, a method that uses the second derivative of the pulse to identify P i is used. In this method, P i occurs at the second peak of the second derivative; the fourth derivative has also been used [3]. In younger individuals with compliant aortas and reduced Z c, the second systolic shoulder occurs much later (after peak systolic pressure) than the first and is usually of lower amplitude (Fig. 2.3) [3, 62]; Z 1 is also reduced in this cohort. In a system with no reflections, the flow and pressure waves are similar in shape (see Fig. 2.3). The characteristics of the reflected wave depend upon a more complex set of determinants than the forward wave, namely, the physical properties (stiffness, taper and branching) of all the arteries in the macrocirculation, especially those in the aorta and lower body, PWV, Tr, and distance to the major “effective” reflection site [2, 3, 62, 74, 148–152]. Augmentation index (AIx = AP/PP), an estimate of wave reflection strength and its contribution to central PP, is related to arterial properties via changes in PWV from the heart to the termination of the microcirculation in the lower body. The magnitude of wave reflection can also be expressed by the reflection magnitude (RM = AP/P1) [52]. Increased arterial stiffness increases PWV (and Z c) and causes early return (Tr decreases) of the reflected wave from the lower body reflecting sites to the heart during systole when the ventricle is still ejecting blood [2, 3, 53, 72, 101, 153]. As Tr decreases, both AP and systolic duration (ED – Tr) increase. This mechanism augments ascending aortic systolic pressure and PP [108, 154–157], an effect that increases arterial wall stress, potentiates the development of coronary artery atherosclerosis, elevates LV afterload, and increases LV mass and oxygen demand while decreasing stroke volume [1, 87, 131, 148]. Since the reflected wave and associated boost in pressure (LV and aortic) does not contribute positively to ejection of blood, the effect of the extra workload is wasted (pressure) energy (or effort) (Ew) (Fig. 2.2) [103, 148, 158–160] the ventricle must generate to overcome AP. Thus, the ventricle shifts from a flow source to a pressure source which uses extra oxygen to generate less flow, and therefore, efficiency decreases [3]. Accordingly, optimal treatment for high central systolic pressure and PP (pulsatile component of LV load) should focus not only on increasing arteriolar caliber and reducing peripheral resistance of the microcirculation but also on reducing arterial stiffness, Z c, PWV, systolic wave reflection (and Z 1), and Ew [161, 162]. Correct calculation of variables from the pressure wave (i.e., AIx, forward and reflected wave amplitude and travel time, distance to reflection sites, RM, and Ew) depends on the accurate determination of the inflection point, P i, on the aortic pressure wave (see above) [3, 70]. Also, care must be taken not to use AIx as a measure of arterial stiffness because of its dependence on wave reflections, heart rate, ejection duration, and body height [3]. Since invasive recordings of ascending aortic pressure waves and pulse wave analysis can only be made in a selected number of patients in the cardiac catheterization laboratory, techniques have been developed recently that enable the noninvasive determination of the above variables [66, 115] in large cohorts with similar results [144, 156, 163–166]. For example, large population studies such as the Baltimore Longitudinal Study of Aging [167, 168], Framingham [169], Anglo-Cardiff (ACCT) [123, 129], and many other aging studies [117, 125] and reviews [85, 162] observed that age is an important determinant of arterial properties and wave reflection characteristics that influence dramatic changes in the macrocirculation. In youth, the reflected wave from the lower body travels at a reduced PWV and arrives at the heart in diastole (Fig. 2.3) which aids coronary artery and myocardial perfusion, but with increasing age (Fig. 2.2), the elastic arteries stiffen, increase Z c (and PWV), and cause the reflected wave to arrive at the heart during systole (second shoulder) with greater amplitude, systolic duration, and Z 1. This modification in wave reflection characteristics contributes to a decrease in stroke output (negative reflected flow wave contributing to flow deceleration) and a corresponding decline in cardiac output [168]. Aortic systolic pressure and PP increase, whereas diastolic pressure increases to middle age and then decreases in later life [3, 125]. Because of increased central elastic artery stiffness and PWV measured as carotid–femoral PWV, the reflected wave from the lower body migrates into systole and increases aortic AP, AIx, and RM; in the radial and brachial artery, since stiffness changes very little with age [123, 125], the forward to reflected wave (from the hand region) ratio remains essentially unchanged. Tr decreases with age, whereas (ED – Tr) increases causing Ew and myocardial oxygen demand to increase markedly. Arterial stiffness and wave reflection characteristics are amplified in older individuals and in patients with systemic hypertension [125, 170], thereby causing a reduction in PP amplification (Fig. 2.4). In a system with no reflections or one in which the reflected wave arrives after peak systolic pressure and with low amplitude, an increase in aortic stiffness alone only causes an increase in aortic PP (for a given stroke volume), with little change in wave contour (see Fig. 2.3). Major changes in aortic pressure wave contour are due to alterations in amplitude and timing of wave reflections from the macrocirculation, including both elastic and muscular arteries (including arterioles). LV afterload, central aortic and brachial artery systolic, and PP, SPTI, RM, and AIx are increased by elastic artery stiffening and increased wave reflection amplitude, all of which are alterations associated with aging and resulting in LVH [60, 131] and arterial wall damage [127]—major cardiovascular, cerebrovascular, and renovascular risk factors [56, 154, 155]. Major cardiovascular risk factors resulting from increased aortic stiffness and wave reflection (LV afterload) include coronary artery atherosclerosis, decreased coronary blood flow and coronary flow reserve (CFR) (Fig. 2.5), LVH, heart failure, and mortality. An explanation for the progression from normal LV systolic function to severe failure is available on the basis of the argument proposed by Westerhof and O’Rourke [107] and Nichols et al. [3]. This explanation has been effectively used to characterize mechanical pumps, with the LV seen to act as a flow source (powerful ejection) in youth when the ventricle is optimally matched to a compliant arterial system and power generation is minimal and wasted energy is zero. Under these circumstances the reflected wave arrives in diastole and aids in coronary artery perfusion and CFR. The age-related increase in elastic artery stiffness (and PWV) causes the reflected wave to arrive earlier to the heart and boost pressure in mid-to-late systole and places an extra pulsatile workload on the LV causing it to generate more force, which is wasted energy [103]. These changes in arterial properties and wave reflection characteristics cause the LV to change from a flow source to a combined flow and pressure source (ejection limited by pressure achieved) as hypertension develops. As the elastic arteries become stiffer, LV pressure increases and causes an increase in systolic pressure time index (SPTI) and myocardial oxygen demand. Sustained elevation and prolongation of mid-to-late systolic augmentation results in LVH [3], which is associated with progressive degenerative changes in the myocytes such that these weaken and develop less force with each contraction. The weakened, hypertrophied fibers lengthen and the LV dilates, with augmented systolic pressure and stroke output initially being somewhat maintained at greater muscle length and LV volume through the Frank–Starling mechanism [3].
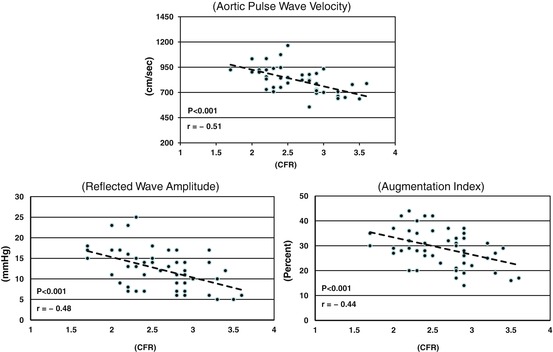
Fig. 2.5
Graphs showing the effects of aortic PWV (upper), reflected wave amplitude (AP) (lower left), and augmentation index (AIx) (lower right) on coronary flow reserve (CFR). All three of these variables are significantly inversely related to CFR
2.5.4.2 Ill Effects of Increased Aortic Stiffness and Wave Reflections on the Coronary Microcirculation
The concept of coronary blood flow reserve (CFR) was introduced to reflect the maximal oxygen delivery capacity during increasing myocardial oxygen demand. Since myocytes extract large amounts (70–80 %) of oxygen from the blood at rest, the best way of meeting increasing oxygen demand is by increasing coronary blood flow [171, 172]. An increase in coronary blood flow can be accomplished by decreasing coronary microvascular resistance, as occurs with elevated myocardial oxygen demand, or increasing oxygen supply by increasing coronary artery perfusion pressure. At rest, there is significant autoregulation in the coronary microvascular bed which ensures sufficient blood supply to the myocytes under a wide range of oxygen demand and perfusion pressure. Thus, resting coronary blood flow is mainly under control of tissue metabolic demand [173]. To test the maximum flow reserve capacity, the autoregulation must be uncoupled, which will create a linear relationship between perfusion pressure and coronary flow [174–177]. Thus, CFR in humans is usually measured during either exercise challenge or pharmacological stimuli such as dobutamine or adenosine [178]; in animals CFR is measured as reactive hyperemia following 10 or 20 s of total coronary artery occlusion and release [179]. Hemodynamically significant lesions in the epicardial coronary arteries (macrocirculation) are known to cause reduced CFR [178–180]. Furthermore, numerous recent studies have shown that some individuals (especially women) with normal epicardial coronary arteries have reduced CFR [181–187]. CFR is defined as the ratio of blood flow at maximal (or near maximal) vasodilation and basal (or resting) blood flow [175]. Vasodilation results from relaxation of SMC of the microcirculation and is associated with endothelial function. Therefore, in the absence of obstructive epicardial coronary artery disease, a reduction in CFR is frequently used as an index of “microvascular dysfunction” [185–188]; however, this association has been questioned by some. CFR is strongly dependent upon changes in the plateau level of basal perfusion and coronary flow. For example, in LVH resulting from chronically elevated afterload, total basal coronary blood flow is increased, but maximal flow does not change; therefore, CFR is reduced [175, 177, 189, 190]. Conditions that increase myocardial oxygen demand increase basal coronary blood flow and deplete a portion of the total reserve capacity of the microcirculation and, therefore, reduce CFR [172].
To fully appreciate the importance of coronary microvascular physiology (and pathophysiology), it must be realized that coronary blood flow changes dramatically during the cardiac cycle. Since the rhythmic contraction of the LV compresses and squeezes the coronary vessels and throttles blood flow during systole, the majority of flow (about 80 %) occurs during relaxation (or diastole) [191]. As central aortic stiffness and wave reflection amplitude increase, central systolic blood pressure rises, PP widens, and LV wall stress and myocardial oxygen demand increase, while aortic diastolic pressure decreases [123, 192, 193]. These alterations in pulsatile load cause LVH independent of change in the steady load component [60, 194]. Such abnormalities in ventricular/vascular coupling unbalance the favorable myocardial oxygen supply/demand ratio and promote myocardial ischemia and contractile dysfunction [3]. Information regarding the ill effects of aortic stiffening and wave reflections on the coronary circulation has come primarily from experimental animal models where the aorta was artificially stiffened or replaced with a rigid tube [26, 195–197]. In these studies when the heart ejected into a stiff or noncompliant aorta, systolic pressure and PP, wasted LV energy, and myocardial oxygen demand increased and diastolic pressure decreased, but coronary blood flow also increased in response to the marked increase in oxygen demand [26]. However, increased aortic stiffness and wave reflection caused a decrease in CFR [189, 196], and during increased myocardial contractility, subendocardial blood flow was impaired and the subendocardial electrocardiogram showed signs of ischemia [195]. These undesirable alterations in ventricle/vascular coupling were enhanced in the presence of a high-grade coronary artery stenosis [195] and during reductions in aortic diastolic blood pressure. During total coronary artery occlusion and myocardial ischemia, increased aortic stiffness caused marked enhancement in cardiac dysfunction [196]. In more recent experimental rat studies, Hachamovitch et al. [198] and Gosse and Clementy [190] found that age and hypertension, conditions associated with increased aortic stiffness and wave reflection, produced LVH and adversely affected the coronary circulation and CFR. These changes in coronary hemodynamics in response to increased aortic stiffness increase the potential for ischemic episodes, especially in the subendocardial region [198]. From these experimental animal studies, it appears that both acute and chronic preparations with artificially stiffened aortas or other interventions that increase myocardial oxygen demand have increased resting coronary blood flow and reduced CFR.
Stay updated, free articles. Join our Telegram channel

Full access? Get Clinical Tree


