Low-flow low-gradient aortic stenosis with normal ejection fraction (LFLGNEF AS) is a newly characterized poorly understood entity within the AS spectrum. Whether LFLGNEF AS has a worse prognosis than typical AS remains controversial. We retrospectively identified 4,546 individual patients with any type of AS on echocardiogram from 2003 through 2013 and categorized them into 5 cohorts: (1) mild AS, (2) moderate AS, (3) severe AS, (4) LFLGNEF AS (ejection fraction ≥55%), and (5) low-flow low-gradient low ejection fraction AS (LFLGLEF AS; ejection fraction <55%). Survival analysis was used to compare outcomes of LFLGNEF AS with those of the other cohorts. AS was classified as mild in 591 patients, moderate in 2,358, severe in 500, LFLGNEF in 776, and LFLGLEF in 318. The study group had a mean age of 80.5 years, 61% were women, and the patients were followed for 2.26 ± 1.16 years. Among subjects managed without valve replacement, total mortality for the LFLGNEF AS group was lower compared with that in both the severe AS and the LFLGLEF AS groups (p = 0.007 and p <0.001, respectively). The prognosis for LFLGNEF AS was worse, however, compared with those with mild and moderate AS (p <0.001, both). In conclusion, no survival differences were found among AS types among those who received valve replacement. The survival rate in LFLGNEF is better than that in severe AS or LFLGLEF but is worse than that in mild or moderate AS. Valve replacement seems reasonable to pursue in select patients.
Highlights
- •
Aortic stenosis (AS) is common in elderly population with a slight female predominance.
- •
Low-flow low-gradient low ejection fraction AS has the worst prognosis of all forms of AS when medically managed.
- •
No survival difference was seen between all forms of AS when surgically managed.
Aortic stenosis (AS) represents a major health care burden involving the aging population. Although the diagnostic criteria of the different types of AS are well established, the clinical management is less clear. Low-flow low-gradient AS with normal ejection fraction (LFLGNEF AS) is a unique entity of the AS spectrum and is typically seen in elderly patients with hypertension. Management of this phenomenon is complex and controversial. Evidence suggests better outcomes with surgical intervention as opposed to medical therapy only. The American College of Cardiology/American Heart Association guidelines for the management of valvular disease were recently updated and provide recommendations for the management LFLGNEF AS. The guidelines now recommend surgical intervention for patients with LFLGNEF AS if they are symptomatic (class IIa, level of evidence C) or if they are asymptomatic, with a high transvalvular flow, and low surgical risk, or have already planned another cardiac surgery (class I, level of evidence B).
The natural history and prognosis of LFLGNEF AS are still unknown. Across the spectrum of AS, it remains unclear whether aortic valve area (AVA) or mean valve gradient should determine the appropriateness for surgical intervention. We therefore sought to determine if LFLGNEF AS had an increased likelihood of all-cause mortality when treated medically or surgically, compared with other forms of AS.
Methods
We retrospectively reviewed all echocardiographic studies performed from January 2003 to November 2013 to identify a cohort of patients with AS defined as an AVA <2 cm 2 . We identified 9,838 echocardiograms with the diagnosis of AS. We excluded incomplete echocardiograms, patients aged ≤18 years, and those with prosthetic valves and complex congenital heart disease. This yielded 4,546 unique patients with AS. We divided these patients into 5 groups based on AVA, mean gradient (MG), and EF:
- •
Mild AS: AVA 1.5 to 2.0 cm 2 and MG <25 mm Hg
- •
Moderate AS: AVA 1.0 to 1.5 cm 2 and MG 25 to 40 mm Hg
- •
Severe AS: AVA <1.0 cm 2 or AVA i <0.6 cm 2 and MG >40 mm Hg
- •
LFLGNEF AS (or paradoxical low-flow low-gradient severe AS): AVA <1.0 cm 2 or AVA i <0.6 cm 2 /m 2 , MG <40 mm Hg, and EF ≥55%
- •
Low-flow low-gradient low ejection fraction aortic stenosis (LFLGLEF AS): AVA <1.0 cm 2 or AVA i <0.6 cm 2 /m 2 , MG <40 mm Hg, and EF <55%. Pseudo-AS excluded with dobutamine challenge testing.
Medical records were reviewed for co-morbidities and surgical interventions. The Montefiore Medical Center’s Institutional Review Board approved this study.
Clinical data included age, gender, hypertension (use of antihypertensive medications or blood pressure >140/90 mm Hg), hypercholesterolemia (use of cholesterol-lowering medication or elevated plasma low-density lipoprotein cholesterol level), coronary artery stenosis (history of myocardial infarction, percutaneous coronary intervention, or coronary artery bypass grafting), diabetes mellitus, peripheral vascular disease, cerebrovascular disease, chronic kidney disease (creatinine clearance <60 ml/min), chronic obstructive pulmonary disease, and history of tobacco use.
Two-dimensional and Doppler echocardiographic studies were performed on a commercially available ultrasound equipment (Philips iE33, Andover, Massachusetts). The AVA was determined by the continuity equation. Peak and mean transvalvular pressure gradients were derived from the modified Bernoulli equation, measured in the apical 5-chamber view. The EF was calculated using the biplane Simpson method. Normal EF was considered as EF ≥55%, as per the Joint Report of the American Society of Echocardiography and the European Association of Echocardiography. “True” or “fixed” AS on dobutamine stress echocardiogram was defined as an increase in transvalvular flow and MG without a change in AVA. “Relative” or “pseudo” AS was defined as an increase in transvalvular flow, MG, and AVA.
The primary end point was death from any cause. Aortic valve intervention, valvuloplasty, transcatheter aortic valve replacement (TAVR), or surgical aortic valve replacement (SAVR) was determined by reviewing medical records. Patient survival was assessed as of January 2014. Vital data were obtained from National Death Index Data Registry, Montefiore Medical Center, and affiliated electronic health records. Patients whose status could not be confirmed were excluded from the survival analysis.
Continuous variables are presented as means with SDs and were analyzed using analysis of variance. Categorical variables are presented as absolute numbers and percentages and were compared using the chi-square analysis. Time-to-outcome data are presented using Kaplan-Meier curves. The end point of interest was all-cause mortality. Analyses were stratified based on medical therapy only or surgical therapy. Univariate and multivariate Cox proportional hazards models were used to compare LFLGNEF AS with each other AS groups. Multivariate models were adjusted for age, gender, hypertension, hyperlipidemia, coronary artery disease, diabetes, stroke, peripheral vascular disease, chronic kidney disease, chronic obstructive pulmonary disease, and smoking. The surgical management stratum was also adjusted for time to surgery. All p values and 95% confidence intervals (CIs) were 2-sided. The level of significance was determined to be p <0.05. All analyses and plots were performed in Stata 12 (StataCorp, College Station, Texas).
Results
A total of 4,546 patients were included in this study. The LFLGNEF AS group included 776 patients who met the aforementioned echocardiographic criteria. They had an average age of 80.5 years, 31% were men, and 57% had hypertension. There were 594 patients with mild AS, mean age of 74.3 years, 46% men, and 60% hypertensive. The moderate AS group was composed of 2,358 patients, mean age of 77.2 years, 38% men, and 58% hypertensive. The severe AS group was composed of 500 patients with a mean age of 78 years, 36% men, and 53% hypertensive; and there were 318 patients with LFLGLEF AS, mean age of 78.5 years, 51% men, and 48% with hypertension. Complete baseline demographics are described in Table 1 . Compared with the other groups, the patients in the LFLGNEF AS group were older, had more women, and a greater prevalence of cerebrovascular disease. The prevalence of hypertension was highest in the mild AS group, followed by the moderate and LFLGNEF AS groups (60%, 58%, and 57%, respectively, p = 0.005).
| Variable | Mild (N = 594) | Moderate (N = 2958) | Severe (N = 500) | LFLGNEF (N = 776) | LFLGLEF (N = 318) | p Value |
|---|---|---|---|---|---|---|
| Age (years) | 74.3 ± 11.4 | 77.2 ± 12.5 | 78 ± 12.9 | 80.5 ± 11.4 | 78.5 ± 11.8 | <0.001 |
| Men | 275 (46%) | 906 (38%) | 181 (36%) | 237 (31%) | 163 (51%) | <0.001 |
| Hypertension | 356 (60%) | 1360 (58%) | 267 (53%) | 445 (57%) | 153 (48%) | 0.005 |
| Hyperlipidemia | 176 (30%) | 636 (27%) | 123 (25%) | 204 (26%) | 71 (22%) | 0.141 |
| Coronary artery disease | 226 (38%) | 1065 (45%) | 252 (50%) | 367 (47%) | 185 (58%) | <0.001 |
| Diabetes mellitus | 185 (31%) | 724 (31%) | 115 (23%) | 209 (27%) | 85 (27%) | 0.004 |
| Stroke | 70 (12%) | 270 (11%) | 35 (7%) | 94 (12%) | 33 (10%) | 0.039 |
| Peripheral artery disease | 30 (5%) | 111 (5%) | 12 (2%) | 28 (4%) | 25 (8%) | 0.004 |
| Chronic kidney disease | 123 (21%) | 446 (19%) | 69 (14%) | 132 (17%) | 70 (22%) | 0.01 |
| Chronic obstructive pulmonary disease | 54 (9%) | 198 (8%) | 38 (8%) | 66 (9%) | 19 (6%) | 0.539 |
| Smoker | 25 (4%) | 77 (3%) | 16 (3%) | 29 (4%) | 6 (2%) | 0.422 |
| Echocardiographic data | ||||||
| Aortic valve area (cm 2 ) | 1.73 ± 0.20 | 1.23 ± 0.20 | 0.63 ± 0.20 | 0.78 ± 0.10 | 0.72 ± 0.20 | <0.001 |
| Mean gradient (mm Hg) | 12 ± 4 | 27 ± 10 | 54 ± 12 | 27 ± 8 | 24 ± 9 | <0.001 |
| Stroke volume indexed (ml/m 2 ) | — | — | — | 32 ± 14 | 27 ± 11 | 0.018 |
| Ejection fraction (%) | 60 ± 10 | 59 ± 12 | 59.7 ± 12 | 63 ± 6 | 35 ± 10 | <0.001 |
The LFLGNEF group had a mean AVA of 0.78 cm 2 , MG 27 mm Hg, mean indexed stroke volume SV i 32 ml/m 2 , and mean EF of 63%. The LFLGLEF group had a mean AVA of 0.72 cm 2 , MG 24 mm Hg, mean SV i 27 ml/m 2 , and mean EF of 59%. The severe AS group had a mean AVA of 0.63 cm 2 , MG 54 mm Hg, and mean EF 60%. The severe AS group had the smallest AVA. Complete echocardiographic variables are represented in Table 1 .
Aortic valve replacement (AVR) was associated with significantly better survival in all patient groups except mild AS, as seen in Figure 1 . This was likely due to the small number of surgical patients in that group.
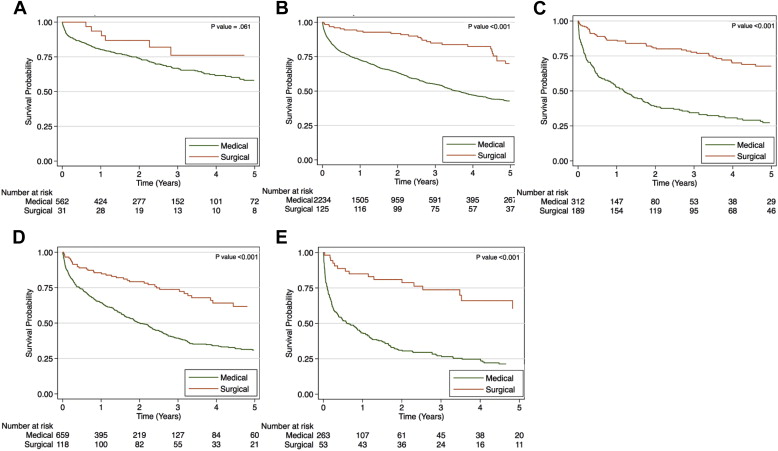
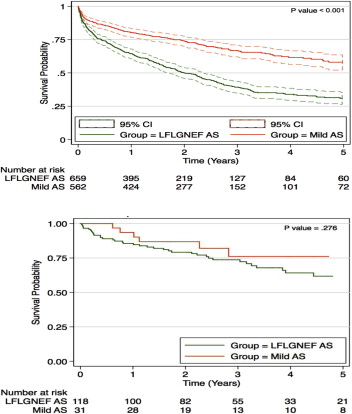
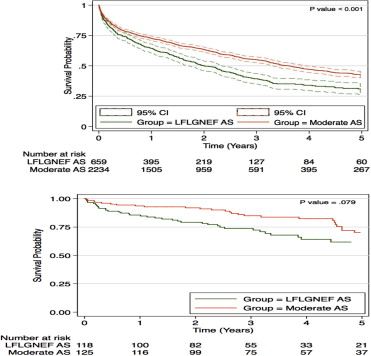
After a mean follow-up of 2.26 ± 2.16 years (range 0 to 9.7 years), there were 516 AVRs performed and 2,175 deaths (49%), as listed in Table 2 . In the LFLGNEF AS group, there were 418 deaths (54%). The survival rate at 1- and 5-year follow-ups in the patients who received medical therapy only was 60% and 10%, respectively. This was statistically worse than medically managed patients with mild and moderate AS, represented respectively in Figures 2 (top) and 3 (top) , but it was better than their medically managed counterparts with severe and LFLGLEF AS, represented in Figures 4 (top) and 5 (top) , respectively. There were 118 patients with LFLGNEF AS who received AVR at a mean time to surgery of 180 days. They had 1- and 5-year follow-up survival rates of 85% and 18%, respectively. There was no statistical difference in their outcomes compared with all the other AS groups, represented in Figures 2 to 5 (bottom).
| Outcomes | Mild (N = 594) | Moderate (N = 2958) | Severe (N = 500) | LFLGNEF (N = 776) | LFLGLEF (N = 318) | p Value |
|---|---|---|---|---|---|---|
| Aortic valve replacement | 31 (5%) | 125 (5%) | 189 (38%) | 118 (15%) | 53 (17%) | <0.001 |
| Death | 195 (33%) | 1086 (46%) | 254 (51%) | 418 (54%) | 222 (70%) | <0.001 |
| Mean time to surgery (days) | 188 ± 536 | 241 ± 437 | 87 ± 229 | 180 ± 330 | 72 ± 174 | <0.001 |
| Mean time to death (days) | 493 ± 605 | 510 ± 618 | 388 ± 549 | 417 ± 489 | 361 ± 569 | <0.001 |
Stay updated, free articles. Join our Telegram channel

Full access? Get Clinical Tree


