Optimizing Two-Dimensional Echocardiographic Imaging
Stanton K. Shernan
The operator of an echocardiographic console is not only responsible for accurately interpreting the information displayed on the ultrasound monitor, but like an artist, must be skillful and knowledgeable in assisting with the creation and development of the actual desired image. Ultrasound image acquisition requires an in-depth understanding of ultrasound physical principles and echocardiographic technology, in addition to an appreciation of cardiac anatomy and physiology. A thorough integration of these important variables is necessary before the clinician can utilize echocardiographic data to make correct diagnoses, and effectively influence perioperative anesthesia and surgical decision making. Without this knowledge the ultrasonographer may not be able to delineate important details of the generated image, and can misinterpret artifacts. Consequently, the inexperienced ultrasonographer is actually vulnerable to exposing patients to increased morbidity by either missing important pathology, or providing erroneous information that leads to unnecessary therapeutic intervention. This chapter will review the important concepts for optimizing the acquisition, processing, and display of real-time, two-dimensional transesophageal echocardiographic (TEE) images.
THE IMPACT OF ULTRASOUND PHYSICAL PROPERTIES ON IMAGE ACQUISITION
Ultrasound Physics
Echocardiography involves the generation of images of the heart and surrounding structures using reflected ultrasound. Generally speaking, a sound wave is a mechanical vibration in a physical medium. As the sound beam propagates, vibrations in the path of the beam result in compression and rarefaction of particles in the medium. A sound wave can be described by the following characteristics (Fig. 4.1):
Amplitude | The magnitude of the peak or trough of the generated sound wave measured in pascals (Pa) |
Cycle | The combination of one compression and one rarefaction |
Wavelength (λ) | The length of a complete cycle between one compression and one rarefaction |
Frequency (f) | The number of cycles per second measured in hertz (Hz) |
Velocity (v) | Propagation of sound in a medium measured in meters/second (m/s). |
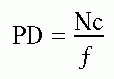
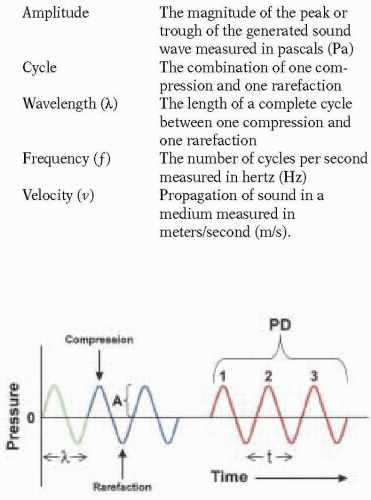 FIGURE 4.1. Characteristics of an ultrasound wave. The amplitude of a sound wave (A) is defined as the magnitude of the peak or trough of the generated sound wave measured in units of acoustic pressure called pascals (Pa). Amplitude is often described in terms of decibels (dB), which are logarithmic units describing the ratio of a measured value of acoustic pressure to a reference value. A cycle is a sequence of changes in amplitude that recur at regular intervals. The wavelength (λ) is the length of one complete cycle between one compression and one rarefaction. The frequency (f) is the number of cycles per second. The pulse duration (PD) is the product of the number of cycles (Nc = 3) within a packet of ultrasound, and its duration. The period of one cycle is t, time. |
Ultrasound is defined as sound waves with a frequency above 20,000 Hz, and is therefore inaudible to the human ear, which has a range of 20 Hz to 20 kHz. Ultrasound, however, is a practical and ideal source of energy because it obeys the laws of transmission, reflection, and refraction; can be directed in a beam; and is relatively safe in the quantities used for medical diagnostic purposes. In clinical practice, diagnostic ultrasound transducers typically use frequencies in the range of 1-20 MHz.
According to the formula for the velocity of sound propagation (v):
v = f × λ
the ultrasound wavelength (λ) is dependent upon both the frequency (f), which is determined by properties of the selected transducer, and the velocity (v), which is determined by the medium through which the beam is directed. Because the velocity in a given biological tissue is relatively constant at 1540 m/sec, the wavelength is primarily determined by the frequency.
Interaction of Ultrasound with Biological Tissues
A thorough understanding of the variables involved in optimizing the acquisition and display of ultrasound images requires an appreciation for the interaction between ultrasound and biological tissues, during transmission and reception. Sound-wave propagation is affected by the density and homogeneity of the interacting medium. When a wave propagates through an inhomogeneous medium, such as a biological tissue, only a portion is reflected back to the transducer for eventual image generation. To a certain extent, the amount of reflected ultrasound is directly proportional to the difference in the acoustic impedance between two different tissues. Acoustic impedance (Z) of a tissue is defined as the product of its density (p) and the velocity (v) of the traversing sound waves:
Z = p × v
As sound passes across the boundary of two tissues with different acoustic impedance, part of the sound wave is reflected back from the tissue interface. The remainder of the wave is absorbed, scattered, and refracted. Structures of greater density, such as calcified tissue or prosthetic material, will reflect ultrasound waves to a greater extent and thus appear more strongly echogenic.
Ultrasound reflection is also dependent upon several other factors, including the angle of impact, interface surface irregularities, the size of the interface relative to the ultrasound wavelength, and attenuation of the sound wave. When ultrasound encounters an interface at an angle, part of the wave is reflected off the interface with an angle of reflection equal to the angle of incidence. Images generated from contact of the ultrasound beam with a large, smooth, and perpendicular interface are referred to as specular echoes and result in a greater reflection of sound back to the transducer, thus producing better quality images. Conversely, less sound is reflected back towards the transducer as the angle of incidence becomes increasingly more acute. Consequently, when the ultrasound beam is parallel to a target, reflection is significantly limited and creates an area of echo lucency (echo dropout). Most structures have minor surface irregularities that create radiating scattered echoes with amplitudes 100 to 1,000 times less than specular reflectors. Small structures (< 1 wavelength in lateral dimension) also create scattered echoes (1). For example, red blood cells are sometimes called Rayleigh scatterers because of the scattered echoes they produce due to their small size (8 µm) compared to the wavelength of an ultrasound beam (300 µm for a 5 MHz transducer) (2). Thus, higher frequencies (shorter wavelengths) are required to visualize smaller objects, although scattered echoes may still be produced by inhomogeneities of the medium.
As an ultrasound wave traverses through tissues, it becomes weakened or attenuated, resulting in loss of the signal due to reflection, scattering, and absorption of sound energy with conversion to heat. Refraction of an ultrasound wave can also occur as it traverses an interface of two media in which the velocity of sound is different. Attenuation increases with higher frequencies and greater image depths. Thus, lower frequency (longer wavelength) transducers with greater penetration may be required to improve the evaluation of structures in the far field at the expense of near-field resolution (Fig. 4.2). Biological tissues with different acoustic impedances also have varying effects on attenuating ultrasound waves. For example, the distance a 2 MHz ultrasound wave can travel in blood before attenuating to one-half its amplitude is 200 times greater than the distance the same ultrasound wave can travel in air before weakening to a similar degree (3). This variability in the effect of different biological tissues on the propagation of ultrasound waves accounts for some of the difficulty in visualizing an air-filled lung (Fig. 4.3). In addition, the difficulty in imaging the aortic arch and great vessels with TEE is due to the presence of the interposing, air-filled, right mainstem bronchus (4). In attempting to obtain optimal images, an experienced ultrasonographer can compensate for some ultrasound physical limitations. For example, the aortic arch and great vessels can be seen in > 90% of patients using an appropriate probe-tip flexion and multiplane angle rotation (5). Alternatively, an epiaortic surface probe can be utilized to improve the quality of ascending aorta and aortic arch images. Loss of the TEE probe-tip-tissue-contact interface is also a significant
source of compromised image quality when imaging from the transgastric depth. However, ultrasound image quality can be improved at this depth by removing gastric air with orogastric suctioning and using a generous amount of ultrasonic lubrication immediately prior to TEE probe insertion, to maintain an airless contact between the probe tip and the gastroesophageal interface.
source of compromised image quality when imaging from the transgastric depth. However, ultrasound image quality can be improved at this depth by removing gastric air with orogastric suctioning and using a generous amount of ultrasonic lubrication immediately prior to TEE probe insertion, to maintain an airless contact between the probe tip and the gastroesophageal interface.
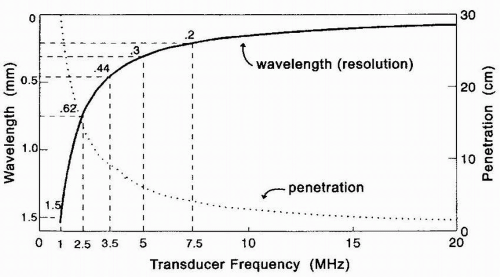 FIGURE 4.2. Graph of transducer frequency (horizontal axis) versus wavelength (solid line) and penetration (dotted line) of the ultrasound signal in soft tissue. Although higher frequency transducers (shorter wavelength) offer improved axial, lateral, and temporal resolution, the depth of penetration is greater with lower frequencies (longer wavelengths) and thus may permit better visualization of distant structures in the image scan. mm, millimeters; cm, centimeters; MHz, megahertz. From Otto C. Principles of echocardiographic image acquisition and Doppler analysis. In: Otto C, ed. Textbook of clinical echocardiography. 2nd ed. Philadelphia: W.B. Saunders Company, 2000, with permission. |
A thorough understanding of how two-dimensional TEE image acquisition and display can be optimized begins with an appreciation of ultrasound physical properties and its interaction with biological tissues during transmission and reception.
THE IMPACT OF ULTRASOUND INSTRUMENTATION ON IMAGE GENERATION AND DISPLAY
The conversion of reflected ultrasound signals into real-time, two-dimensional echocardiographic images is a complex process, involving numerous electronic and digital manipulations. The basic technological requirements for diagnostic medical ultrasound imaging include instrumentation capable of beam generation, reception of the returning echoes, signal processing and display (Fig. 4.4). Optimizing the generation of cardiac images requires an appreciation for the contributions of each essential component of this elaborate circuitry.
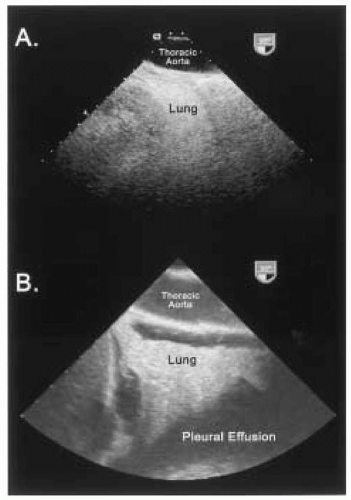 FIGURE 4.3. Effect of air on ultrasound wave propagation. A: Long-axis, transesophageal echocardiographic (TEE) view of the descending thoracic aorta and adjacent normal left lung. The propagation of an ultrasound wave is markedly attenuated by air-filled structures, such as the normal lung. In addition, most of the ultrasound wave is reflected at the air-tissue interface due to significant acoustic impedance mismatch. B: Long-axis, TEE view of the descending thoracic aorta and adjacent left lung, in the presence of a pleural effusion. The low attenuation coefficient of the serous fluid in the left thorax permits circumferential visualization of the partially collapsed lung. |
Master Synchronizer
The master synchronizer coordinates the elapsed time interval between electronic signal emission from the transmitter that results in the generation of the pulsed ultrasound beam from the transducer, and the electronic conversion of the received ultrasound signal (Fig. 4.4). This time interval is important for correlating the signal amplitude to the depth of the tissue interface. The returning sound wave amplitude ultimately determines pixel brightness, while the time for the sound to return determines the image depth. The synchronizer also assists with the introduction of any special amplification based on elapsed time (6). Decreasing the voltage amplitude
produced by the transmitter (power) results in a decrease in the amplitude of the ultrasound pulse produced by the transducer and a decrease in the corresponding amplitude of the returning signal.
produced by the transmitter (power) results in a decrease in the amplitude of the ultrasound pulse produced by the transducer and a decrease in the corresponding amplitude of the returning signal.
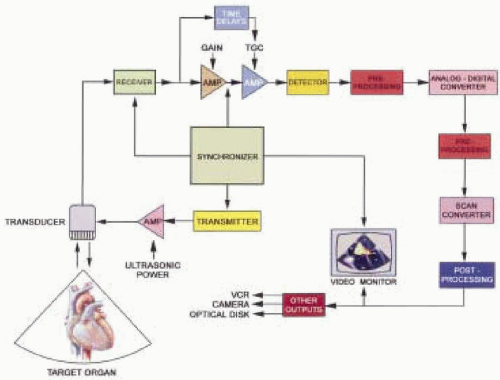 FIGURE 4.4. A basic block diagram of the essential ultrasound system components that are required to generate, transmit, receive, process, and display two-dimensional echocardiographic images. AMP, amplifier; TGC, time gain compensation; VCR, video cassette recorder. |
Transducers
The transducer serves as an electroacoustic conversion device composed of multiple piezoelectric crystals, which are capable of generating, transmitting, and receiving ultrasound waves. In response to an alternating electrical current from the transmitter, the crystal alternately compresses and expands, thereby generating an ultrasound wave. Conversely, when a returning ultrasound signal contacts a piezoelectric crystal, an electric current is generated that is eventually amplified and processed before being displayed on the ultrasound console monitor for interpretation. A transducer’s fundamental resonance frequency is inversely proportional to the thickness of the piezoelectric material. The pulse of ultrasound, however, is actually composed of a range of frequencies, called the frequency bandwidth.
In generating an ultrasound image the piezoelectric crystals of the transducer emit a short burst of ultrasound, which is followed by a passive period of “listening” for returning echoes. Ideally, all echoes from one pulse must be received before the next pulse is emitted. Emission of a pulse prior to the reception of all echoes from greater depths would result in range ambiguity. The number of times the crystal is pulsed or electrically stimulated per second is coordinated through the synchronizer and is called the pulse repetition frequency (PRF). The pulse repetition period is the amount of time required to transmit a pulsed ultrasound wave plus the time devoted to listening. The PRF is limited by the maximum sampling depth and the velocity of ultrasound in the medium. Because the velocity of ultrasound is nearly constant for most interacting tissues, the PRF will increase if the depth of interest is decreased.
The pulse duration is the product of the number of cycles within a burst or packet of ultrasound (Nc) and its duration (Fig. 4.1). The pulse duration (PD) can also be calculated using transducer frequency:
The length of the pulse (spatial pulse length) and pulse duration directly affect axial resolution, which is the ability to distinguish two structures that are close to each other along the direction of beam propagation as two separate structures (Fig. 4.5). One way for the ultrasonographer to optimize axial resolution is to increase the transducer frequency, which decreases the wavelength and therefore shortens the pulse duration. It is important to remember, however, that increasing the ultrasound frequency decreases the depth of penetration and may compromise far-field imaging. The pulse duration can also be shortened by
using transducers with broad frequency bandwidths, which include a greater mixture of high and low frequencies compared to narrow bandwidths. Consequently, broad bandwidth transducer pulses are more likely to preserve higher frequencies as ultrasound waves penetrate through tissue, and therefore have greater sensitivity than narrow frequency bandwidths (6). Finally the use of damping material in the construction of transducers minimizes piezoelectric crystal ringing and vibration thereby producing a shorter pulse duration. Thus, axial resolution can be improved by assuring a short pulse duration through the use of an appropriately dampened transducer with a high-frequency and broader frequency bandwidth (Fig. 4.6).
using transducers with broad frequency bandwidths, which include a greater mixture of high and low frequencies compared to narrow bandwidths. Consequently, broad bandwidth transducer pulses are more likely to preserve higher frequencies as ultrasound waves penetrate through tissue, and therefore have greater sensitivity than narrow frequency bandwidths (6). Finally the use of damping material in the construction of transducers minimizes piezoelectric crystal ringing and vibration thereby producing a shorter pulse duration. Thus, axial resolution can be improved by assuring a short pulse duration through the use of an appropriately dampened transducer with a high-frequency and broader frequency bandwidth (Fig. 4.6).
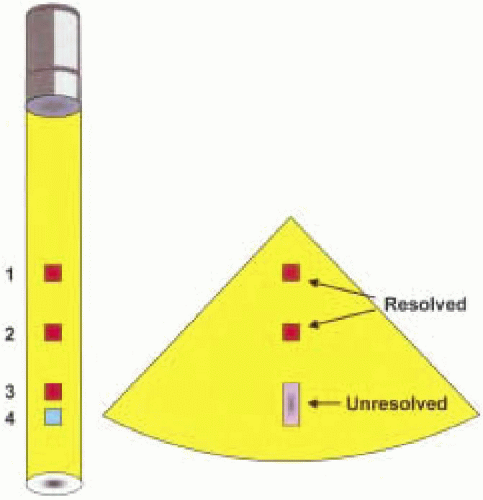 FIGURE 4.5. Axial resolution refers to the minimum distance between two structures oriented parallel to the ultrasound beam axis that permits visualization of the structures as separate, distinct reflectors on the monitor screen. The structures (squares 1 & 2) closest to the transducer are spaced far enough apart to be distinguished as separate reflectors. The two distant structures (squares 3 & 4) are too closely spaced along the direction of the ultrasound beam to be resolved and, therefore, appear merged on the monitor screen. From Zagebski J. Properties of ultrasound transducers. In: Zagebski J, ed. Essentials of ultrasound physics. St. Louis: Mosby, 1996, with permission. |
Ultrasound beam geometry is also an important factor for determining image quality and is dependent upon several factors. For a nonfocused transducer, the near field is columnar-shaped and nondivergent. The length of the near field, also known as the Fresnel zone, is determined by the diameter of the transducer face aperture (D) and the wavelength (λ) according to the equation:
Length = (D)2 / 4λ
The beam begins to diverge beyond the focal point into the far field known as the Fraunhofer zone. Objects are generally better imaged when they are in the Fresnel zone because the beam is comprised of more parallel waves, and reflecting surfaces in the zone tend to be more perpendicular (7). Lateral resolution is one of the most significant variables in determining ultrasound image quality and tends to deteriorate in the far-field region because of beam divergence. Lateral resolution describes the ability of a transducer to resolve two objects that are adjacent to each other and perpendicular to the beam axis (Fig. 4.7). Lateral resolution also refers to the ability of the beam to detect single small objects across the width of the beam (6). In general, lateral resolution is most optimal when the ultrasound beam width is narrow. Lateral resolution may therefore be improved by increasing the frequency (shortening the wavelength), although tissue penetration will be compromised (Fig. 4.8). Increasing the transducer aperture diameter may also improve lateral resolution by lengthening the near-field depth at the expense of a wider proximal near field. Furthermore, unlike transthoracic probes, the size of the transducer is somewhat limited by
esophageal diameter. Increasing the ultrasound signal amplitude increases the detection of echoes at the beam margins thus effectively increasing beam width and decreasing lateral resolution (7,8).
esophageal diameter. Increasing the ultrasound signal amplitude increases the detection of echoes at the beam margins thus effectively increasing beam width and decreasing lateral resolution (7,8).
Stay updated, free articles. Join our Telegram channel

Full access? Get Clinical Tree


