Non-smoking
Smoking
Statistics
Non-atopic (n = 43)
Atopic (n = 16)
Non-atopic (n = 44)
Atopic (n = 16)
Age (years)
44.9 (38.9; 48.8)a
44.8 (36.9; 55.0)
47.3 (41.1; 54.0)
35.6 (25.4; 44.6)
0.008
BMI (kg/m2)
26.0 (24.2; 29.5)
27.4 (23.4; 29.8)a
26.1 (24.4; 30.4)
25.2 (23.2; 29.2)
0.803
CO (vol%)
0.32 (0.16; 0.48)a
0.48 (0.32; 0.64)
2.96 (2.12; 4.16)a
3.52 (2.52; 4.40)
<0.0001
Pack-years
0
0
21.0 (9.5; 30.0)a
9.0 (4.6; 25.3)
<0.0001
sx1 (kU/L)
0.03 (0.02; 0.05)a
4.67 (0.88; 13.21)a
0.03 (0.02; 0.08)a
1.33 (0.74; 12.04)a
<0.0001
Occupational exposure
Duration (years)
12.3 (5.4; 17.1)
15.8 (6.4; 23.3)
10.8 (6.2; 18.3)a
4.4 (1.8; 15.6)
0.048
Level (low/high)
14/29
8/8
18/26
9/7
0.343
Filtered air supply (h)
2.0 (0; 4.0)a
1.5 (0; 6.0)
2.0 (0; 6.0)a
1.0 (0.3; 4.8)
0.820
3.2 Biomarkers in Exhaled Breath and Exhaled Breath Condensate
Due to the narrow time schedule or technical reasons, FeNO measurement and EBC sampling could not be applied in 14 and 5 workers, respectively. FeNO measurements revealed a median value of 14 (9; 21) ppb. EBC-pH could be determined in each sample with a median of 6.71 (6.25; 7.04). Based on the EBC volume collected, there were 110, 93, and 105 samples available for measurements of 8-iso-PGF2α, PGE2, and LTB4, respectively. In all samples the respective biomarkers were detectable, but partly below the LOQ. In detail, values below the LOQ were 1/110, 55/93 and 89/105 for 8-iso-PGF2α, PGE2, and LTB4, respectively. Concentration of 8-iso-PGF2α and PGE2 in EBC was 82.1 (61.9; 118.0) pg/mL and 26.1 (26.1; 54.8) pg/mL, respectively. LTB4 was transformed into binary categories using the LOQ as cut off. FeNO concentrations were not correlated to pH or biomarker concentrations in EBC when referring to all subjects or subgroups (data not shown). The only significant correlation between pH and an EBC biomarker concentration was observed in case of PGE2 in the subgroup of smokers (p = 0.007). Within EBC-biomarkers, 8-iso-PGF2α was positively correlated to PGE2 (p = 0.020). Concentrations of 8-iso-PGF2α and PGE2 were significantly higher in samples with LTB4 > LOQ compared to <LOQ (108.9 (77.8; 262.6) pg/mL vs. 76.3 (59.5; 99.2) pg/mL, p = 0.012 and 78.8 (65.2; 125.0) pg/mL vs. 26.1 (26.1; 50.1) pg/mL, p < 0.0001).
3.3 Intensity of Occupational Exposure and Markers of Effect
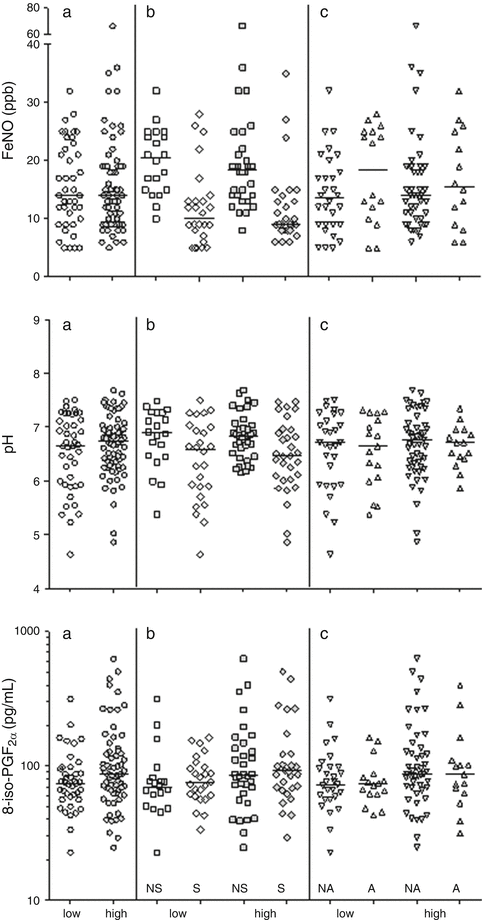
A rather high current bioaerosol exposure could be suspected in 70/119 compost workers. No differences with respect to the exposure intensity (high vs. low) could be observed for FeNO (14 (9; 19) ppb vs. 14 (10; 22) ppb, p = 0.806), pH (6.74 (6.30; 7.00) vs. 6.66 (5.93; 7.16), p = 0.459), PGE2 (26.1 (26.1; 54.8) pg/mL vs. 26.1 (26.1; 62.4) pg/mL, p = 0.780) or LTB4 (> LOQ/< LOQ; 12/53 vs. 4/36, p = 0.278). Levels of 8-iso-PGF2α were significantly increased in workers considered highly exposed to organic dust (86.6 (66.1; 128.8) pg/mL vs. 74.4 (56.3; 96.7) pg/mL, p = 0.047). Results of FeNO, pH measurements, and 8-iso-PGF2α concentrations in EBC stratified according to smoking habits and atopy are depicted in Fig. 1. No further differences could be revealed in case of PGE2 or LTB4 after stratification of results according to smoking habits and atopy (data not shown). Smoking demonstrated a significant negative impact on FeNO levels both in low (p = 0.0001) and high (p < 0.0001) exposed workers. A trend for higher FeNO levels in atopic subjects was observed in low exposed workers (p = 0.152). EBC-pH was significantly lower in smoking compared to non-smoking subjects which was more apparent in high exposed subjects (6.46 (6.02; 6.95) vs. 6.83 (6.48; 7.05), p = 0.009) compared to low exposed subjects (6.58 (5.84; 7.01) vs. 6.89 (6.45; 7.27), p = 0.049). EBC-pH was not different when referring to atopic status and exposure intensity. No association between pH and cumulative smoking dose (pack-years) could be revealed (p = 0.848) in smokers. Concerning 8-iso-PGF2α, differences between high and low exposed workers could be mainly attributed to differences in the subgroups of non-smokers (p = 0.087) and the subgroup of non-atopics (p = 0.072).


Fig. 1
FeNO, pH, and 8-iso-PGF 2α concentrations in EBC referring to all subjects (a) and stratified according to smoking habits (b), and atopy (c). L low exposure, H high exposure, NS never smokers, S smokers, NA non-atopic, A atopic
3.4 Correlation Between Markers of Effect and Exposure
Correlations between current (CO vol%) or cumulative cigarette exposure (pack-years) and current (clean air supply) or cumulative (years of employment) occupational exposure and effect markers referring to all subjects under investigation (n = 119) are shown in Table 2. LTB4 was not used for correlation analyses because of the high amount of values below the LOQ (84.8 %). Both current and cumulative cigarette exposure was negatively correlated to FeNO (p < 0.0001, each) and pH (0.005 and 0.010, respectively). No associations could be revealed between biomarkers in exhaled breath and EBC and occupational exposure.
Table 2
Correlations of exposure characteristics and biomarkers of inflammation
FeNO (ppb) | pH | 8-iso-PGF2α (pg/mL) | PGE2 (pg/mL) | ||
|---|---|---|---|---|---|
CO (vol%) | r | −0.516 | −0.264 | −0.002 | −0.034 |
p | <0.0001 | 0.005 | 0.980 | 0.746 | |
Pack-years | r | −0.510 | −0.242 | 0.030 | −0.025 |
p | <0.0001 | 0.010 | 0.760 | 0.813 | |
Clean air supply (h) | r | −0.148 | 0.051 | 0.040 | 0.016 |
p | 0.132 | 0.588 | 0.676 | 0.878 | |
Employment (years) | r | 0.017 | 0.059 | −0.095 | −0.083 |
p | 0.862 | 0.533 | 0.324 | 0.428 |
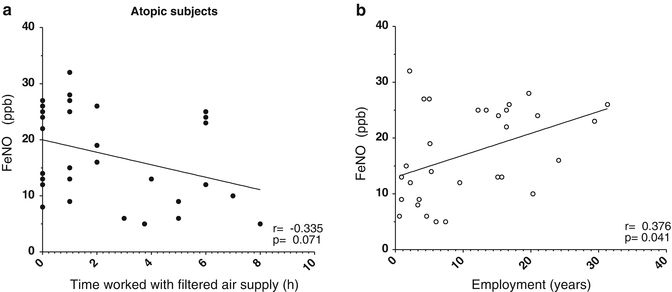
After stratification according to atopic status, an association could be suspected between FeNO and time daily worked under clean air supply in atopic workers (r = −0.335, p = 0.071; Fig. 2a). Moreover, there was a statistically significant correlation between FeNO and duration of employment in this subgroup (r = 0.376, p = 0.041; Fig. 2b). No associations were observed in any subgroup between means of exposure and biomarkers assessed in EBC (data not shown).


Fig. 2


Correlations between FeNO in atopic subjects and (a) the time daily worked with filtered air supply and (b) the duration of employment
Stay updated, free articles. Join our Telegram channel

Full access? Get Clinical Tree


