Nuclear Cardiac Imaging: A Primer
Nuclear cardiac imaging contributes significantly to the care of patients with known or suspected heart disease. Recent innovations in instrumentation and the use of advanced image reconstruction techniques have permitted reductions in patient radiation doses and shorter imaging times, further enhancing the application of nuclear imaging techniques in the clinical arena. Measurements of absolute myocardial perfusion (in milliliter of blood flow per minute per gram tissue) and perfusion reserve obtained with positron emission tomographic (PET) imaging, once feasible only in research labs, can now be derived from clinical imaging studies using commercially available software. The information provided by noninvasive nuclear imaging studies is valuable for the detection and localization of coronary artery disease, risk stratification, and assessment of myocardial viability. This chapter describes the fundamentals of nuclear imaging and relates them to their specific clinical application.
OVERVIEW OF NUCLEAR IMAGING
A conventional nuclear imaging study employs a gamma camera to record the naturally occurring emissions of a radioactive tracer that is selected to visualize a physiologic process occurring in vivo. The ideal radioactive tracer permits visualization of the physiologic process of interest without disturbing it. The tracer must be nontoxic, emit energies appropriate for imaging, have a high target organ to background ratio, and impart as low a patient radiation dose as possible. It should be readily available and inexpensive to be practical for clinical use. Most radioactive tracers used for cardiac imaging are administered intravenously, but some used for PET imaging (below) may be administered as inhaled gases.
Radioactive tracers spontaneously decay by emitting packets of electromagnetic energy, or photons. The emitted photons are captured by the gamma camera and used to create an image of the physiologic process of interest. However, some of the emitted photons will be attenuated (absorbed) before they leave the body and will not be used for image creation. The probability that a photon will be attenuated increases as the path length to exit the body increases.
A typical gamma camera has a lead collimator, a piece of metal with a “honeycomb” of openings that serves to focus the incident photons (Fig. 12.1). Most collimators used in cardiac imaging have holes that are parallel to each other (parallel-hole collimators). Photons traveling perpendicular to the camera pass through the holes and are used for image creation. Photons approaching the camera at an angle are stopped by the septa and are not used for imaging. Collimator performance depends on the length and diameter of its holes, as well as septal thickness. In general, spatial resolution improves as the ratio of the diameter of the hole to its length decreases. As spatial resolution improves, efficiency (the relative number of incident photons traversing the lead baffle) decreases. Collimator selection therefore reflects a trade-off between spatial resolution and count sensitivity. High-resolution collimators provide better spatial resolution but lower sensitivity than other collimators, because a larger proportion of photons are absorbed and do not reach the crystal. “General-purpose” or high-sensitivity collimators are capable of passing greater numbers of photons per unit of time, with somewhat poorer spatial resolution. “All-purpose” collimators have characteristics that are intermediate between these extremes.
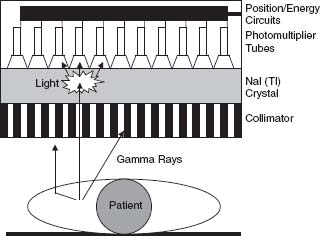
FIGURE 12.1 Schematic representation of a conventional gamma camera. Photons emitted by decay of the radiotracer of interest in the target organ can travel directly to the camera, or be scattered by interposed tissue. Photons that strike the lead collimator are absorbed and do not reach the crystal. The photons that pass through the collimator strike the crystal and interact with it, producing flashes of visible light. The photo-multiplier tube closest to the gamma-ray interaction receives the greatest amount of light, and comparison of the relative response from multiple photomultiplier tubes allows localization of the scintillation event. Light quanta strike the photo-cathodes of the photomultiplier tubes, causing the release of electrons. The electrical signal is amplified by the photomultiplier tubes and transmitted to the energy discrimination and positioning circuitry of the camera.
In a conventional gamma camera, photons exiting the collimator strike a sodium iodide crystal containing a trace amount of nonradioactive thallium. The crystal stops most of the photons and converts their energy into quanta of visible light. Photons that are more energetic produce a greater number of light quanta than less energetic photons. A “light pipe” directs the light quanta to adjacent photomultiplier tubes. The photomultiplier tubes convert the energy of the light quanta into an electrical current and then amplify the strength of the current by several thousandfold. Special electronic circuitry is used to locate the x and y positions of the initial light impulse and to analyze the energy of the incident photons.
Some photons originating in the heart may be deflected from their initial path, or scattered, before entering the camera. Photons that are scattered in tissue generally lose energy when they are deflected. Scattered photons degrade the image because they do not travel in a direct path to reach the camera. Some scattered photons are deflected toward the camera at an oblique angle and are prevented by the collimator from reaching the crystal. However, other scattered photons do traverse the collimator and strike the crystal with an energy that is less than that of the photons that are not scattered. The contribution of scattered counts to the image can be minimized by setting an optimal “energy window” on the camera. Photons that strike the crystal with energies that are outside of the “energy window” are rejected, thereby improving image quality.
A nuclear image gradually emerges as increasing numbers of photons (scintillation events) are recorded by the camera. Image quality improves nonlinearly as the number of counts (scintillation events) in the picture increases. Thus, it is important to use a high enough radiotracer dose and/or to image for a long enough period of time to acquire a sufficient number of counts to achieve satisfactory image quality. State-of-the-art gamma cameras are capable of imaging about 200,000 counts per second, and some multiwire cameras are capable of even higher count rates. A camera witn a high count rate capability is needed for high-quality first-pass imaging (imaging performed as the tracer is administered intravenously).
Nuclear images can be obtained using planar or single photon emission computed tomographic (SPECT) acquisition techniques. Planar images are obtained with the gamma camera positioned in a fixed location. Usually, planar images are acquired in anterior, left anterior oblique, and left lateral projections. On occasion, planar images may also be obtained from a right anterior oblique projection. Planar images may be acquired for a specific period of time, for a specific number of counts, or for a given number of cardiac cycles (radionuclide ventriculography).
CARDIAC SPECT IMAGING
In SPECT imaging, pictures are obtained from multiple angles (projections) about the body. Conventional SPECT devices employ between one and four camera heads that rotate about the patient. Images are acquired over 180- or 360-degree arcs, usually by “stepping and shooting” an image every 3 or 6 degrees. Information from the raw projection images is then reconstructed using either filtered back-projection or iterative reconstruction techniques. The reconstructed images are used to define the three-dimensional (3-D) distribution of the tracer in space. Image sets orthogonal to the long axis of the heart (vertical long axis, horizontal long axis, and short axis) are then generated for review.
SPECT images can be acquired with electrocardiogram (ECG) gating to permit assessment of ventricular function. The R–R interval of the ECG is usually divided into 8 or 16 equal time bins (frames) prior to study acquisition (Fig. 12.2). Each bin depicts a different portion of the cardiac cycle. At each step, the SPECT camera acquires 8 to 10 ECG gated images over multiple cardiac cycles. Gated image sets are reconstructed in the same cardiac axes as the nongated images, providing functional information for each of the “slices” in the image sets. Current software packages can also display the gated information as a 3-D rendering, permitting the study interpreter to visualize a graphical representation of the beating heart. Gated SPECT images provide information about regional wall motion and systolic thickening, as well as global left ventricular size and systolic function.
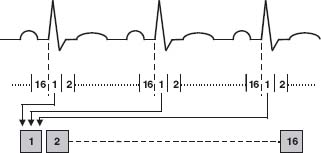
FIGURE 12.2 Graphic representation of the process of ECG gating. Using the R wave of the patient’s ECG as a timing signal, image count data from multiple cardiac cycles are added to the time bin corresponding to the portion of the R–R interval in which they were acquired. Counts in each bin increase with each succeeding cardiac cycle, improving the quality of the image represented by that time bin. Usually, 8 or 16 images are acquired per R–R interval, each representing a time-averaged look at that portion of the cardiac cycle. Once the images are acquired, they can be displayed in a continuous ciné loop, depicting global and regional ventricular function.
Several advances in instrumentation have served to enhance the quality of SPECT nuclear cardiac studies. Correction for photon attenuation can be performed using a density map of the chest (a set of transmission images) obtained with either an external line source of activity or a low dose x-ray CT scan. The density map is used to correct for the loss of counts resulting from attenuation of myocardial activity by interposed tissue, reducing the likelihood that an attenuation artifact will be mistaken for a true perfusion defect. Solid-state cameras dedicated to cardiac imaging employ detectors made of cadmium–zinc–telluride (CZT) or cesium iodide (CSI) instead of conventional sodium iodide (Tl) crystals to detect emitted photons. Some solid state cameras employ L-shaped detector heads that are large enough to fit around the chest. This permits imaging of the heart without moving the camera. Semiconductors in the solid-state detectors of these cameras directly convert the energy of incident photons into an electrical current. These instruments provide higher count sensitivity, improved energy resolution, and better spatial resolution than conventional gamma cameras. In some camera systems, the patient is imaged while seated in an upright or semiupright position. This improves patient comfort during imaging and helps to reduce movement artifacts. Accompanying the advances in instrumentation is the increasing application of iterative techniques for image reconstruction. Iterative reconstruction methods help to reduce noise and improve image quality in low-count studies. These developments have served to maintain image quality while permitting the use of shorter imaging times and/or lower radiopharmaceutical doses.
CARDIAC PET IMAGING
PET cardiac perfusion imaging is more sensitive and specific for the detection of coronary artery disease than conventional SPECT imaging. When PET imaging is performed with the metabolic tracer 18F-2-fluoro-2-deoxyglucose (FDG), it provides important information about regional myocardial viability. Tracers used for PET imaging decay by ejecting a positron (a β+ particle) from a proton-rich nucleus. Once ejected from the nucleus, the positron interacts with atoms in the surrounding medium, producing excitations and ionizations that slow its travel. As it slows, the positron eventually comes into close proximity with an electron in the surrounding medium. The electron and the positron are “anti-particles” and they mutually annihilate, liberating energy in the form of two 511-kiloelectron volt (keV) annihilation photons, which exit the annihilation site in opposite directions.
PET cameras employ circular banks of gamma-ray detectors to identify paired scintillation events occurring about 180 degrees apart (annihilation coincidence detection). If two detectors opposite each other simultaneously register photon hits in coincidence, then the annihilation event is localized to the volume between the two detectors (Fig. 12.3). If only a single photon is detected, the requirement for coincidence detection is not satisfied and the scintillation event is not used for image creation. Data from millions of annihilation events are reconstructed using standard filtered back-projection or iterative reconstruction techniques to create an image.
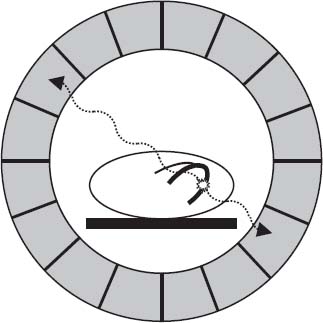
FIGURE 12.3 Schematic representation of PET imaging. When a PET radiotracer decays, it emits a positron, the antiparticle of the electron. The positron travels a short distance before interacting with an electron, resulting in their mutual annihilation. The annihilation event produces two 511-keV photons traveling in diametrically opposed directions. PET imaging relies on the detection of two photons “in coincidence” (arriving at opposite detectors at about the same time) to identify true annihilation events and localize them to the volume between the two detectors.
When a PET scanner operates in the two-dimensional (2-D) mode, each ring of detectors is separated from adjacent rings by lead or tungsten septa. An image is generated in the plane of each ring by using coincidence events occurring between detectors in that ring. A detector in one plane can also be in the “line of sight” and in coincidence with some of the detectors in the next higher or lower adjacent ring. By using interplane coincidences, an additional set of interpolated images is generated midway between the direct planes defined by the detector rings. The 3-D spatial distribution of the tracer is achieved by “stacking” images from multiple 2-D planes. When a PET camera operates in the 3-D mode, it operates without septa between the detector rings. Coincidences are identified between detectors lying in any ring combination. 3-D image reconstruction techniques are then used to define the tracer distribution over the entire volume that is imaged. The reconstruction techniques employed for a 3-D camera are more computationally demanding than those used for a 2-D camera. However, a PET camera operating in the 3-D mode is more sensitive for detecting annihilation events. This means that comparable image quality can be achieved using lower doses of radioactive tracers than those used for 2-D imaging.
PET images can be acquired at the moment of peak myocardial uptake of the tracer (static image acquisition), or a series of images can rapidly be acquired over time (dynamic list mode image acquisition). The images first acquired, the transverse images, are orthogonal to the body. Transverse images are reoriented into standard short-axis, and vertical and horizontal long-axis image sets analogous to those used in SPECT imaging. ECG-gated PET images can be obtained to assess segmental wall motion and thickening, ventricular volumes and ejection fractions.
PET has several advantages relative to SPECT for cardiac imaging, including better temporal and spatial image resolution and more accurate correction for attenuation of emitted photons. Current PET instruments can acquire multiple cross-sectional images of the entire heart as rapidly as every 5 seconds. PET cameras have spatial resolutions on the order of 6 to 8 mm full-width, half-maximum (FWHM) in the center of the field of view, as compared to 12 to 15 mm FWHM for conventional SPECT cameras. In addition, the radiation dose imparted to the patient from rubidium-82 or nitrogen-13 ammonia is less than half that of a conventional rest-stress SPECT perfusion study performed with a technetium-99m labeled tracer.
Cardiac PET images are corrected for attenuation using transmission images depicting the density of the thorax. In conventional PET systems, transmission images are acquired using an external ring source of activity. In newer PET/CT systems, which are the instruments used most frequently in clinical practice for imaging, transmission images are obtained using a low dose x-ray CT of the thorax. The transmission images are acquired immediately before or after the nuclear images. If desired, the CT portion of the camera can be used for coronary CT angiography and/or calcium scoring at the same session.
On a PET camera that has been appropriately calibrated, counts on the images accurately reflect true tissue activity concentrations. Rates of myocardial perfusion and/or metabolism can be measured by examining the change in tissue tracer concentrations over time on dynamic PET images. Because the acquisition time of each image frame is operator-defined, it is possible to generate time-activity curves depicting changing tissue and vascular tracer activity concentrations over time. Cardiac count data from the time-activity curves are then fit using a mathematical model that describes the biologic behavior of the radioactive label. The parameter of interest (e.g., myocardial blood flow in milliliters per minute per gram of tissue or glucose consumption in micromoles per minute per gram of tissue) is then determined by the equation best fitting the patient’s myocardial time-activity data. Commercially available software now permits noninvasive measurements of rest and hyperemic perfusion and myocardial perfusion reserves from dynamic rubidium-82 PET perfusion images.
INTERPRETATION OF NUCLEAR IMAGES
Myocardial perfusion images should be interpreted by an experienced physician. Care is taken to identify significant extracardiac activity that might impact image interpretation, to define cardiac chamber size, assess relative myocardial perfusion, and, where appropriate, examine regional and global myocardial thickening and wall motion. As a quality-control measure for the SPECT studies, the raw projection images are reviewed in a cinematic display. This enables the physician to look for motion and displacement of the heart during imaging (which may create image artifacts), to identify interposed tissue that might attenuate the images, and to determine if the extracardiac distribution of the radioactive tracer is normal.
Once the projection images have been examined, the short axis, vertical long axis, and horizontal long axis images are reviewed (Fig. 12.4). The standard 17-segment left ventricular model is typically used for study interpretation. In this model each segment represents a near-equal proportion of the ventricular mass (0% for each segment except for the apical cap, which constitutes 4% of left ventricular mass) (Fig. 12.5).
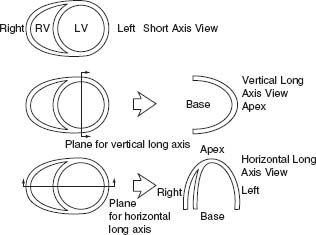
FIGURE 12.4 Cardiac plane definition. (From the Committee on Advanced Cardiac Imaging and Technology, Council on Clinical Cardiology, American Heart Association; Cardiovascular Imaging Committee, American College of Cardiology; and Board of Directors, Cardiovascular Council, Society of Nuclear Medicine. Standardization of cardiac tomographic imaging. Circulation. 1992;86:338–339, with permission from Wolters Kluwer Health.)


