Noninvasive Imaging Techniques for the Assessment of the Patient with Heart Failure
Swaminatha V. Gurudevan
Peng Li
Mani A. Vannan
Jagat Narula
A variety of noninvasive imaging modalities are available to the clinician in the assessment of patients with congestive heart failure. These include echocardiography, radionuclide imaging, and cardiovascular magnetic resonance imaging (CMRI). These methods offer insight into the structural characteristics of the left ventricle (LV) that can impact patient prognosis and guide the treatment of patients with congestive heart failure. They are also helpful in evaluating the structure and disease progression in patients with coexistent valvular heart disease. The progression of left ventricular remodeling and subsequent reverse remodeling after initiation of medical therapy can both be evaluated with these methods. Most importantly, these techniques offer insight into the etiology of ventricular dysfunction and can guide the clinician in selecting the most optimal treatment strategy.
Evaluation of Structural Cardiac Abnormalities
Left Ventricular Size and Mass
Measurement of LV cavity size and LV mass provides vital information regarding the etiology, pathophysiology, and prognosis of a patient’s heart failure syndrome. Patients with congestive heart failure with a dilated left ventricle a subset of individuals who should be identified and managed aggressively. Data from the SOLVD and trials (1,2) show that LV dilatation is associated with a significantly higher mortality in patients presenting with clinical evidence of congestive heart failure. Table 33-1 illustrates the data from SOLVD. In addition, dilation of the LV is associated with an increase in overall cardiovascular events following myocardial infarction (MI) (3) and a higher incidence of lethal ventricular arrhythmias post-MI (4). LV size can be followed serially and correlated with clinical improvement during the course of reverse remodeling in response to medical therapy. Successful reduction of LV size with medical therapy is associated with an improvement in mortality as shown in the SAVE trial, illustrated in Figure 33-1.
Echocardiography is the most commonly used method to evaluate the size of the LV cavity. Both two-dimensional and M-mode echocardiography are commonly used to generate measurements of LV end-diastolic diameter (LVEDD) and LV end-systolic diameter (LVESD). The excellent temporal resolution of M-mode echocardiography enables precise measurements of these parameters. Normal LVEDD at our institution ranges from 42 to 55 mm, while normal LVESD ranges from 25 to 36 mm. With the progressive LV enlargement that occurs with dilated cardiomyopathy, both LVEDD and LVESD rise; both variables fall following institution of successful medical therapy (6). This has major prognostic implications, as patients with massive LV enlargement (LVEDD >75 mm or LVESD >60 mm) are at high risk for adverse events, including sudden death (7). Figure 33-2 shows a parastenal long-axis two-dimensional and M-mode echocardiogram in a normal patient and a patient with dilated cardiomyopathy.
LV mass and wall thickness can also be assessed using M-mode echocardiography. Wall thickness is typically measured in the parasternal imaging plane with measurement of the interventricular septal wall thickness (IVST) and posterior wall thickness (PWT). Using the assumption that the LV is spherically shaped, the internal dimensions can be cubed and subtracted from the external dimensions
to determine the volume of the LV myocardium. This volume is then multiplied by the specific gravity of muscle (1.05 g/cm3), yielding a value of LV mass (8). Normal values of LV mass indexed to height using this method have been reported at 79.1 ± 19.2 g/m in men and 66.7 ± 15.7 g/m in women (9). These and other normal values for standard M-mode echo measurements are shown in Table 33-2.
to determine the volume of the LV myocardium. This volume is then multiplied by the specific gravity of muscle (1.05 g/cm3), yielding a value of LV mass (8). Normal values of LV mass indexed to height using this method have been reported at 79.1 ± 19.2 g/m in men and 66.7 ± 15.7 g/m in women (9). These and other normal values for standard M-mode echo measurements are shown in Table 33-2.
Table 33-1 Data from Solvd Trial: Left Ventricular Mass, Left Ventricular End-Systolic Dimension and Left Atrial Dimension as Strong Predictors of Mortality in Patients with Symptomatic Heart Failure | |||||||||||||||||||||||||||||
|---|---|---|---|---|---|---|---|---|---|---|---|---|---|---|---|---|---|---|---|---|---|---|---|---|---|---|---|---|---|
| |||||||||||||||||||||||||||||
LV mass carries significant prognostic implications for the survival of patients with congestive heart failure (10). In the Framingham Heart Study, LV mass calculated using this method was associated with a higher cardiovascular death rate and a higher all-cause mortality, independent of conventional risk factors (11). In addition, the investigators found a relative risk of cardiovascular disease of 1.49 for each incremental increase of 50 g/m in LV mass. These data are shown in Figure 33-3.
Real-time three-dimensional echocardiography is now commercially available and provides a powerful means to evaluate LV cavity size and mass. Using a pyramidal phasedarray ultrasound transducer, a full-volume data set acquisition can be performed on four cardiac cycles. This volume is analyzed off-line to determine precise measurements of LVEDD, LVESD, IVST, PWT, and LV mass. When compared with two-dimensional echo, three-dimensional echo has better reproducibility and less test-retest variability (12). It is also less dependent on LV geometric assumptions. This method holds significant promise for the future assessment of LV mass and dimensions. As the technique is relatively new, long-term prognostic data are not yet availble
able for three-dimensional measurements. Figure 33-4 shows a real-time three-dimensional echocardiographic analysis of LV volumes and ejection fraction (EF).
able for three-dimensional measurements. Figure 33-4 shows a real-time three-dimensional echocardiographic analysis of LV volumes and ejection fraction (EF).
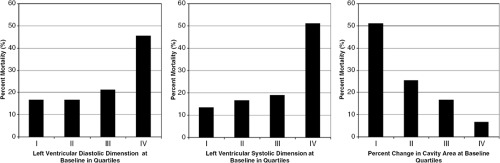 Figure 33-1 Data from the SAVE trial, in which 512 patients were randomized to placebo versus captoprll therapy post-myocardial infarction and underwent echocardiography at baseline and at 1 year postinfarction. Patients are divided into quartiles based on dimensions with I representing the quartile of patients with the smallest dimensions or change in dimensions and IV representing quartile of patients with the largest dimensions or change in dimensions. Left graph shows increasing mortality with increasing initial LV diastolic dimension with mortality. Center graph shows similar mortality increase with increasing LV systolic dimension. Right graph shows decreasing mortality with larger percentage change in cavity area at 1 year. (From St. John Sutton M, Pfeffer MA, Plappert T, et al. Quantitative two-dimensional echocardiographic measurements are major predictors of adverse cardiovascular events after acute myocardial infarction. The protective effects of captopril. Circulation. 1994;89:68–75 , with permission.) |
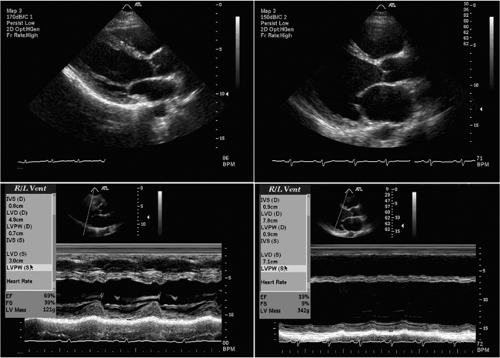 Figure 33-2 Parasternal long-axia two-dimensional and M-mode echocardiogram images from a normal patient (left) and a patient with dilated cardiomyopathy (DCM) (right). Note the marked increase in LV chamber size and LV mass along with a marked reduction in LV fractional shortening and EF in the patient with DCM. |
Table 33-2 Normal Values for Standard M-Mode Echocardiographic Variables for Men and Women | ||||||||||||||||||||||||||||||||||||||||||
|---|---|---|---|---|---|---|---|---|---|---|---|---|---|---|---|---|---|---|---|---|---|---|---|---|---|---|---|---|---|---|---|---|---|---|---|---|---|---|---|---|---|---|
| ||||||||||||||||||||||||||||||||||||||||||
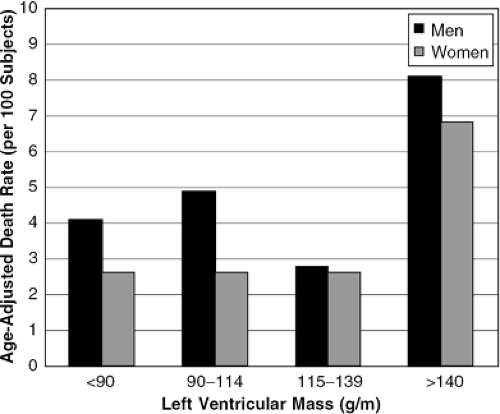 Figure 33-3 Data from the Framingham Heart Study showing age-adjusted death rate based on LV mass, adjusted to patient height. Dark bars represent men and gray bars represent women. (From Levy D, Garrison RJ, Savage DD, et al. Prognostic implications of echocardiographically determined left ventricular mass in the Framingham Heart Study. N Engl J Med. 1990;322:1561–1566 , with permission.) |
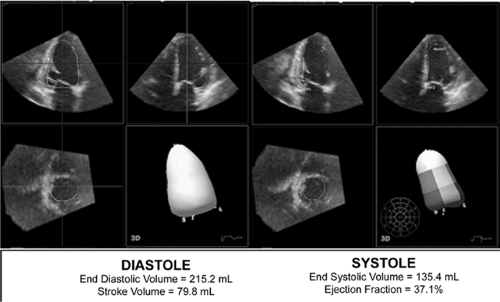 Figure 33-4 Real-time three-dimensional echocardiographic calculation of LV volume at end-diastole (left) and end-systole (right). Three-dimensional echocardiography enables a derivation of the true geometric shape of the LV, resulting in highly accurate, reproducible measures of LV volumes. |
While radionuclide ventriculography was originally developed in the 1970s as a method to quantify EF, two methods can be used to determine LV volumes: the first-pass method and the multiple ECG gated acquisition (MUGA) method. The first involves imaging Tc-99-sestamibi- or Tc-99-tetrofosmin-labeled red blood cells with a high temporal sampling rate during their initial transit through the central circulation and is known as the first-pass method. This method is limited to a single acquisition and is typically done in the right anterior oblique view (13). The gated method involves identifying a specific portion of the cardiac cycle by ECG and averaging the measured LV volumes during systole and diastole over several cardiac cycles (14). A quantitative assessment of radionuclide counts can then be obtained during systole and diastole and absolute LV volumes can be derived. Figure 33-5 shows a gated radionuclide assessment of LV volumes and EF.
Radionuclide ventriculography is advantageous as it has a high degree of reproducibility and has a low intraobserver and interobserver variability and analysis can be done independent of LV geometry or abnormalities in regional wall motion (16). Several studies have documented that LV volumes assessed using this method can be followed serially and correlate well with clinical improvement with medical therapy (17). In the SOLVD trial, patients treated with enalapril showed a significant reduction in LV volumes as measured by radionuclide ventriculography, while placebo patients had an increase in LV volumes. These changes in LV volumes correlated with the marked reduction in mortality seen with enalapril therapy (18).
Cardiovascular magnetic resonance imaging (CMRI) has experienced a significant technological evolution during the past 5 years and has emerged as a powerful method to assist the clinician in the assessment of LV volumes (19,20). CMRI provides a three-dimensional data set at multiple levels and phases throughout the cardiac cycle and can thus be performed independent of the geometric characteristics of the LV. Volumes are obtained in the long-axis, short-axis, four-chamber, and two-chamber imaging planes (19). Image acquisition is typically performed during a breath hold in expiration (19). CMRI has the advantages of having a high degree of temporal and spatial resolution and providing simultaneous structural and functional information. Due to their high degree of precision and reproducibility, CMRI measurements of LV mass are often used as the gold standard in living patients for the evaluation of two-dimensional and three-dimensional echo measurements of LV mass (19,20).
Image analysis with CMRI is usually performed offline, with calculation of LVEDV, LVESV, and LV mass. Disadvantages of CMRI include its lack of portability and accessibility to acutely ill patients, the need for breath-hold imaging which may limit utility in patients with heart failure, patient claustrophobia, and operator dependence on specific pulse sequences to achieve optimal image quality.
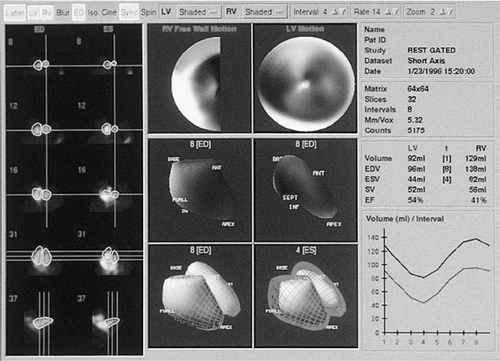 Figure 33-5 Gated blood pool SPECT with use of Tc-99-sestamibi to determine LV and RV volumes and EF. The calculations are based on the number of counts detected at end-systole and end-diastole and are therefore more quantitative and highly reproducible. (From Dilsizian VN, J, ed. Atlas of Nuclear Cardiology. Philadelphia: Current Medicine, Inc.; 2003 , with permission.) |
Left Atrial Size and Volume
Left atrial (LA) volume has been recognized as a powerful indicator of LV diastolic function. During diastole the LA is directly exposed to LV pressures, and LA volume thus reflects the severity and duration of increased LV filling pressure (21). Due to intrinsic variability in atrial size that occurs based on patient size and gender, LA volume is indexed based on body surface area and is often reported as left atrial volume index (LAVI), which is expressed in units of mL/m2. Normal LAVI has been previously reported as 20 ± 6 mL/m2 (22).
There are recent data from patients with nonischemic cardiomyopathy that suggest that an LAVI >68.5 mL/m2 is associated with a three- to fourfold lower survival free of cardiac transplantation (23). Even modest elevations in LAVI are associated with adverse outcomes: following acute MI, patients with an LAVI >32 mL/m2 had a sixfold higher mortality than those with LAVI (24). In this patient population, mortality rose progressively as LAVI increased, as shown in Figure 33-6.
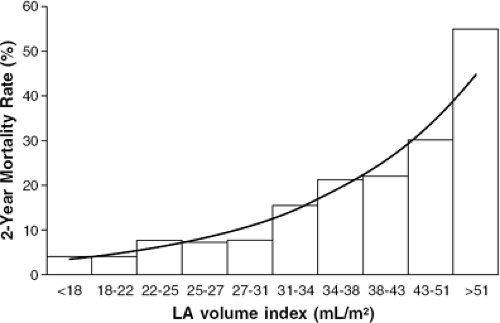 Figure 33-6 Relationship between LA volume index and 2-year mortality in 314 patients who underwent two-dimensional echocardiography following acute myocardial infarction. (From Moller JE, Hillis GS, Oh JK, et al. Left atrial volume: a powerful predictor of survival after acute myocardial infarction. Circulation. 2003;107:2207–2212 , with permission.) |
Echocardiography is the most common imaging modality used to assess LA size. Linear measurement of LA size is typically performed using M-mode echocardiography in the parasternal window. This measurement is performed at end-systole, just before mitral valve opening, during maximal LA volume. However, this technique is limited by its lack of spatial orientation.
There are two methods of assessing LA volume using two-dimensional echocardiography, as shown in Figure 33-7. The first involves the planimetry of the LA area in the apical four-chamber and apical two-chamber views, along with the measurement of the length of the LA from the mitral annulus to the posterior wall in the four-chamber view. LA volume is then calculated as:
LA volume = 0.85 × (four-chamber area) × (two-chamber area)/(atrial length)
LA volume can also be calculated by treating the LA as a prolate ellipse and measuring the anteroposterior length in the parasternal long-axis view and the two orthogonal lengths in the apical four-chamber view, and using the formula:
LA volume = φ/6 × (anteroposterior diameter from parasternal view) × (anteroposterior diameter from apical four-chamber view) × (medial-lateral diameter from apical four-chamber view).
CMRI can also be used to obtain a very accurate assessment of LA volume. Patients are imaged with a breath hold and the LA volume is calculated using the modified Simpson’s rule. This method involves considering the LA as a prolate ellipse and dividing it into 10-mm-thick slices. These slices are summed to determine LA volume. Both cine-MR and contrast-enhanced MR have been used with this method to evaluate LA volume, with excellent spatial resolution (25,26).
Right Ventricular Size and Function
Assessment of right ventricular (RV) size and systolic function provides additional prognostic information to the clinician caring for a patient with heart failure. Recent data have shown that RV function has a strong association with a patient’s functional capacity, short-term clinical outcome, and long-term survival (27). In a study by de Groote et al. of 205 patients with New York Heart Association (NYHA) Class II or III heart failure, RV ejection fraction (RVEF) derived from radionuclide ventriculography was the only significant independent predictor of event-free survival from cardiovascular mortality and urgent transplantation in this patient population (28).
Imaging of the RV with echocardiography is technically more challenging due to its unique pyramidal shape. When determining RV volume, certain assumptions about the geometric shape of the RV must be made which may not be accurate. The most common echo method employed to assess RV function is the planimetry of the RV fractional area in the apical four-chamber view. In this single
plane, end-systolic area is subtracted from end-diastolic area and the result is divided by the end-diastolic area to yield the fractional area change (8).
plane, end-systolic area is subtracted from end-diastolic area and the result is divided by the end-diastolic area to yield the fractional area change (8).
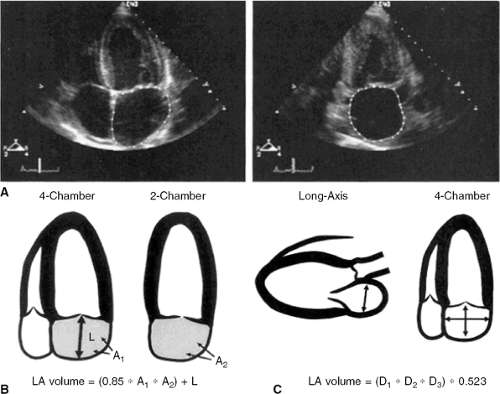 Figure 33-7 Two techniques for the measurement of LA volume by two-dimensional echocardiography. The first method involves planimetry of the LA area in the four-chamber and two-chamber views, while the second involves measurement of the three linear dimensions of the LA and multiplying by φ/6. (From Feigenbaum H, Armstrong WF, Ryan T. Feigenbaum’s Echocardiography. 6th ed. Philadelphia: Lippincott Williams & Wilkins; 2005 , with permission.) |
In the SAVE trial, on univariate analysis of 414 patients who were enrolled post-MI, RV fractional area change (FAC) was a predictor of mortality, cardiovascular mortality, and heart failure. RV dysfunction as indicated by an FAC less than 0.32 predicted a 31.2% event rate, compared with 12.7% in patients without RV dysfunction. In fact, each 5% decrease in RV FAC was associated with a 16% increased odds of cardiovascular mortality (29). Other methods of assessment of RV function include assessment of tricuspid annular plane systolic excursion and linear assessment of RV shortening (30). These methods are summarized in Figure 33-8.
The advent of three-dimensional echocardiography has significantly impacted our ability to assess RV function, as the assumptions about the shape of the RV are no longer necessary; a complete echocardiographic rendering of the RV cavity can be recorded and analyzed, with a more accurate assessment of RV volumes than is possible with two-dimensional echocardiography. This is demonstrated in Figure 33-9.
Radionuclide ventriculography is an established method for determination of RV volumes and EF. It can be performed using both first-pass and equilibriumgated measurement of radionuclide counts in the right ventricle. It has been considered the traditional gold standard for quantitative assessment of RV volumes and EF (31). CMRI also enables accurate assessment of RV volumes and EF and may become the gold standard for RV volumetric assessment due to its high degree of temporal and spatial resolution. Its reproducibility for RV volume measurements is poorer than for LV volume measurements but is still superior to echocardiographic methods (32).
Pulmonary Artery Pressures
Pulmonary artery pressure and pulmonary vascular resistance are important hemodynamic parameters in patients with chronic heart failure. Increased pulmonary artery pressure is a marker of poor prognosis in patients with LV dysfunction and is associated with a poor outcome following cardiac transplantation (33). Pulmonary hypertension may result from postcapillary pulmonary hypertension from chronically elevated LV and LA pressures, or from precapillary pulmonary hypertension that can occur secondary to remodeling of the pulmonary arterial tree (34).
Pulmonary artery (PA) pressures are typically assessed during right heart catheterization but can be accurately estimated using Doppler echocardiography. This is performed by measuring the peak velocity of tricuspid regurgitation (VTR) and the application of the modified Bernoulli equation, which states:
Pulmonary artery pressure = right atrial pressure + 4 × VTR2
Right atrial (RA) pressure can often be estimated by clinical exam and is assumed to be 5 to 7 mm Hg in a euvolemic patient. The use of tricuspid regurgitation velocity to estimate PA pressure is shown in Figure 33-10, taken from one patient with mild pul-monary hypertension and another with severe pulmonary hypertension.
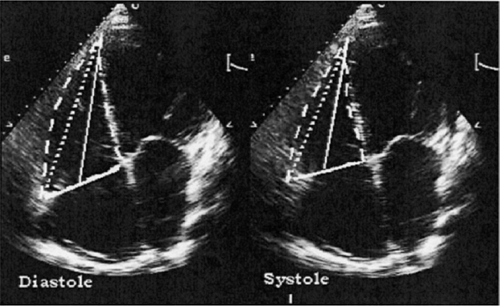 Figure 33-8 Methods of assessment of RV function using two-dimensional echocardiography. The dashed line (- – – – -) demonstrates planimetry of the fractional area during diastole and systole, the solid line (—) demonstrates assessment of tricuspid annular plane excursion, and the dotted line (••••••••) demonstrates assessment of RV shortening. (Adapted from Thohan V. Prognostic implications of echocardiography in advanced heart failure. Curr Opin Cardiol. 2004;19:238–249 , with permission.) |
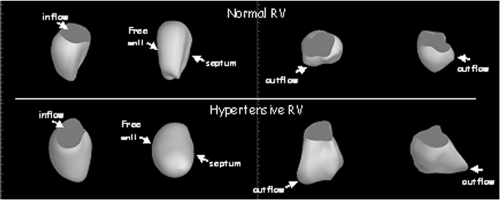 Figure 33-9 Three-dimensional echocardiographic reconstruction of RV volumes in a normal and hypertensive patient. The geometric shape of the RV can be more accurately rendered using three-dimensional echocardiography. (Image courtesy of Peng Li, M.D., University of California, Irvine Division of Cardiology.) |
Evaluation of Left Ventricular Function
Left Ventricular Systolic Function: Importance of Ejection Fraction
In patients with congestive heart failure, there is no prognostic indicator more important than LV systolic function. The most widely accepted standard for assessing LV systolic function is measurement of LVEF (8). EF depends not only on LV contractility but also on preload and afterload (30). Nonetheless, it remains a simple yet powerful predictor of outcome in all subgroups of patients with congestive heart failure and has a strong influence on the clinician’s treatment paradigm. In virtually every large-scale clinical trial that examined patients with systolic dysfunction (SOLVD, CONSENSUS, SAVE, V-HeFT), LVEF was a strong negative predictor of mortality; low EF predicted a higher incidence of recurrent cardiovascular events, ventricular arrhythmias, and cardiovascular death (3,6,35,36). In fact, in stable patients with coronary artery disease (CAD), EF is a stronger predictor of mortality than is the number of diseased vessels (37). In patients with ischemic cardiomyopathy, EF has a strong influence on mortality from sudden death and ventricular arrhythmias (38). Those patients with an EF less than 30% have a significant mortality benefit from implantable cardioverter defibrillator (ICD) therapy, as shown in the MADIT-II trial (39). Figure 33-11 shows data from the V-HeFT VA cooperative studies group that demonstrates improved survival following fractional improvements in ejection fraction with effective medical therapy of heart failure.
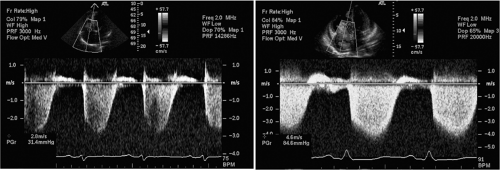 Figure 33-10 Assessment of pulmonary artery pressures using Doppler echocardiography in a patient with mild pulmonary hypertension (left) and severe pulmonary hypertension (right). The peak velocity of the tricuspid regurgitation jet is estimated using continuous-wave Doppler and the modified Bernoulli equation.
Stay updated, free articles. Join our Telegram channel
Full access? Get Clinical Tree
 Get Clinical Tree app for offline access

|