Fig. 8.1
Illustration of an x-ray source with a detector array
Scans were acquired in a “step and shoot” mode in which 35–40 continuous gapless slices of 1–3 mm thickness were acquired at 130 kV and a fixed tube output of 65 mAs. The images were acquired in an ECG-triggered mode at 40–80 % of the R-R interval.
Radiation exposure for EBCT is low, at approximately 1 mSv.
Multidetector computed tomography:
Most scanners used today for calcium scanning are multi-detector scanners, and calcium scanning is performed as either a screening test, or as an initial noncontrast scan prior to contrast CT angiography.
Recommended scanner settings include acquisition in triggered-mode (step and shoot) in late diastole, with a 0.625-mm collimation width. Typical scanner settings include 120 kV and 50 mAs (scalable). Images are reconstructed at 2.5–3 mm thickness.
Radiation exposure for this technique is approximately 1 mSv.
Although calcium scanning can be performed using a spiral CT acquisition technique (using retrospective gating, as often performed for CT angiography), radiation exposure with this scanner mode is unnecessarily high (4–5× higher) and therefore not recommended.
Using comparable tube output and voltage, there is excellent between-test agreement for EBCT and MDCT. Inter-test agreement coefficients >0.90 have been reported [1]. However, greater error is possible with MDCT at higher heart rates due to lower temporal resolution of the scanner and artifact due to coronary motion.
Quantitation of Coronary Calcium (Figs. 8.2, 8.3, and 8.4)
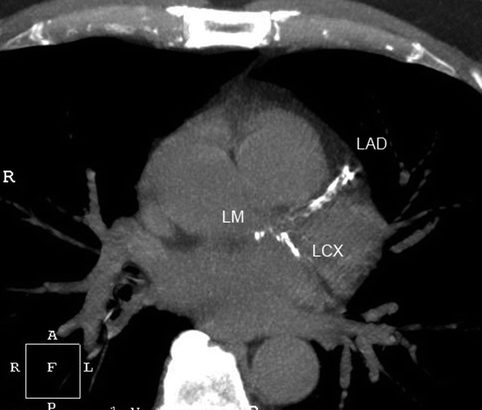
Fig. 8.2
Axial view multidetector noncontrast CT images (2.5 mm thick, 120 kV, 100 mAs) shown in thick section with coronary calcium in the left main, left anterior descending, and left circumflex arteries. The total coronary calcium score was 733 units quantified by the area-density method
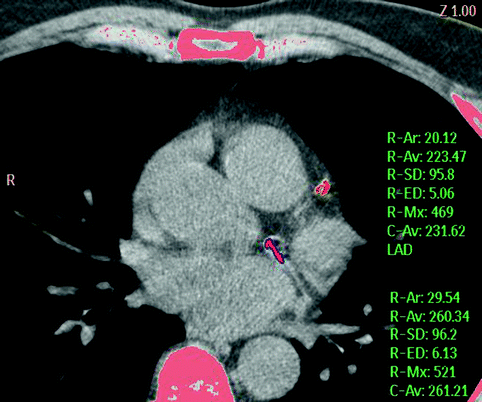
Fig. 8.3
Example of automated detection of calcified lesions in the left anterior descending coronary artery (red) and left circumflex coronary artery (pink) using automated lesion detection based upon the Hounsfield unit threshold
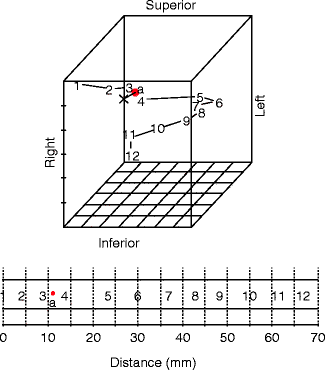
Fig. 8.4
The newly developed calcium coverage score incorporates the distribution and dispersion of coronary calcium through the coronary artery tree (Reproduced with permission from Brown et al. [2])
Quantitation of coronary calcium is typically performed on 2.5 mm axial CT slices, using the area and density (Agatston) method.
Calcified lesions are detected based upon their attenuation value, with an attenuation value of 130 HU units as the threshold for a calcified lesion.
The area of calcification in each of the slices is calculated and multiplied by a density weighting factor from 1 (low density calcium) to 4 (high density calcium) based upon the attenuation values of the lesion. The summation of all lesions across the coronary tree is the total calcium score.
Calcium scores are typically reported separately for each coronary artery and as a total value. The total value is the primary factor evaluated in the coronary risk factor assessment.
A coronary calcium score of 0 indicates no detectable coronary calcium. A score of 1 indicates the presence of at least 3 contiguous voxels meeting the Hounsfield unit threshold of 130 units. Although any calcium score greater than 0 is considered abnormal, low scores can be subject to error particularly in obese patients due to image noise from the low-energy CT.
Other methods for quantification of coronary calcium include the mass score and volume score.
The MESA study has developed a new calcium scoring algorithm called the calcium coverage score [2]. This scoring method accounts for the degree of dispersion of coronary calcium across the coronary arterial tree.
Calcium scores are dependent upon multiple factors including age, gender, ethnicity, family history, genetic factors, and measurable cardiovascular risk factors.
Selection of Patients
Selection of patients to undergo noncontrast CT is guided by several professional society statements including the American College of Cardiology Clinical Expert Consensus Document and the multi-society Appropriateness Criteria for cardiac CT.
Selection of intermediate risk patients (defined as a Framingham risk level of ≥10 % coronary heart disease risk over 10 years) is judged as reasonable to refine the coronary heart disease risk assessment. See Table 8.1.
Table 8.1
Recent society position statements on the clinical use of coronary artery calcium assessment
Statement
Year published
Conclusion
AHA cardiac CT statement [17]
2006
May be reasonable to measure the atherosclerosis burden using EBCT or MDCT to refine clinical risk prediction and to select patients for more aggressive target values for lipid-lowering therapies. Class IIb, Level of Evidence: B
ACC Clinical expert consensus document on coronary calcium [10]
2007
May be reasonable to consider use of CAC measurement in such patients based on available evidence that demonstrates incremental risk prediction information in this selected (intermediate risk) patient group.
ACCF Cardiac CT appropriateness criteria [18]
2010
Risk assessment: general population – asymptomatic calcium scoring
Appropriate in:
Intermediate CHD risk
Low CHD risk with positive family history
ACCF Clinical guidelines on initial CVD risk assessment in asymptomatic patients
2010
Class 2A: intermediate CHD risk
Application to Specific Populations
Ethnic group adjustments for calcium score distributions are required. Several studies have shown that ethnic groups systematically differ in the presence and severity of coronary calcium.
Caucasians are most likely to have coronary calcium present and to have higher coronary calcium scores. Population data from the Multi-Ethnic Study of Atherosclerosis (MESA) are the best source of race-adjusted calcium score severity [3]. Such distributions are shown (Fig. 8.5) for Caucasian, Black, Hispanic and Chinese men. Scores are highest for white and lowest for Chinese-Americans.
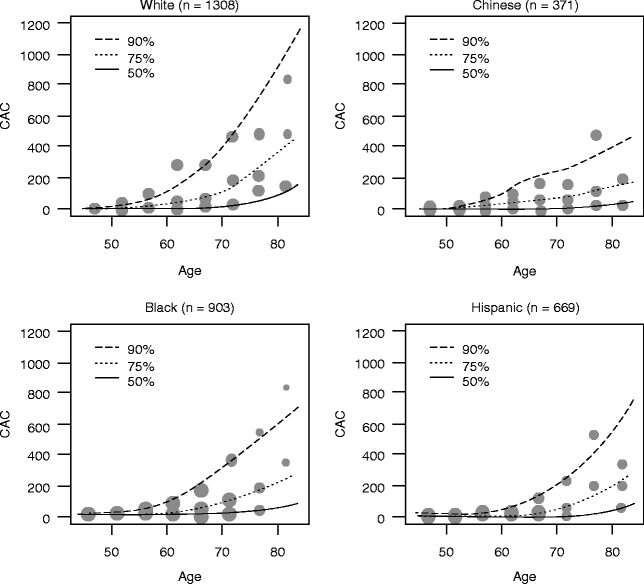
Fig. 8.5
Population data from the Multi-Ethnic Study of Atherosclerosis (MESA) show the race-specific relationship between calcium score severity and age. Such distributions are shown for Caucasian, Black, Hispanic and Chinese men. Scores are highest for white, and lowest for Chinese-Americans (Reproduced with permission from McClelland et al. [15])
The ethnic calcium score distributions are available at the MESA website (www.mesa-nhlbi.org). This site includes a calcium scoring tool in which clinical patients can be compared to the MESA data (Fig. 8.6). The calcium scoring tool indicates the likelihood of coronary calcium in a patient of a given age, gender, and ethnicity and provides an estimate of the percentile ranking.
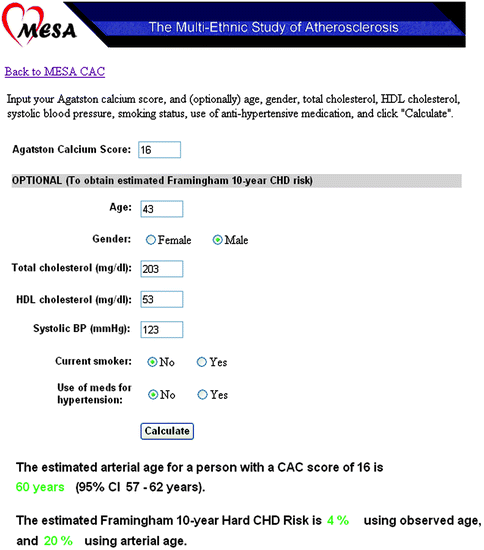
Fig. 8.6
Screen shot from the MESA calcium scoring tool (www.mesa-nhlbi.org) evaluating the likelihood of coronary calcium in a patient of a given age, gender, and ethnicity, and an estimate of the percentile ranking (Used with permission. Copyright © 2012 MESA Coordinating Center, University of Washington, Seattle, WA)
Due to their abnormal calcium-phosphate metabolism, individuals with renal failure are particular prone to arterial calcification, and evaluation of calcium score for such patients within normal population distributions is difficult. Despite the absence of coronary artery calcium, aortic wall calcification is seen (Fig. 8.7; arrow). Incidentally noted is a dialysis catheter in the right atrium.
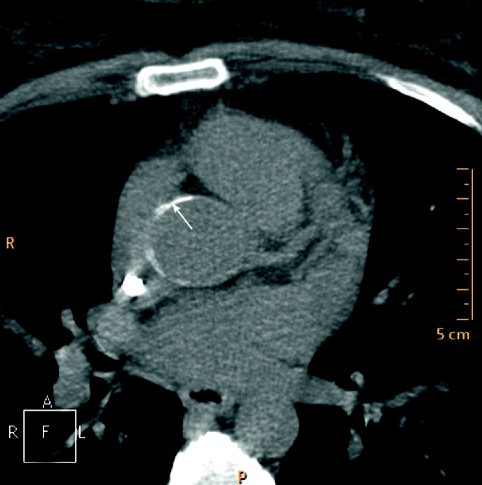
Fig. 8.7
Aortic wall calcification (arrow) in a patient with renal failure. Incidentally noted is a dialysis catheter in the right atrium
False positive identification of coronary calcification can be seen along the postero-lateral segment of the heart. This is seen to be in the region of the left circumflex artery but also near the annulus of the mitral valve. Distinguishing these two locations is crucial to avoid false positive findings of left circumflex calcification.
The location of the coronary artery is within the atrioventricular groove within low-attenuation (darker region) epicardial fat (Fig. 8.8; arrow). In comparison, the calcification shown in these images is in the region of tissue density of the myocardium and blood pool and in the mitral annulus. Calcification in this region should be excluded from the coronary calcium score. A dialysis catheter is also visible in the right heart. A thicker axial image (Fig. 8.9) shows the extent of the mitral annular calcification in the typical location along the posterior aspect of the heart (posterior to the posterior mitral valve leaflet).
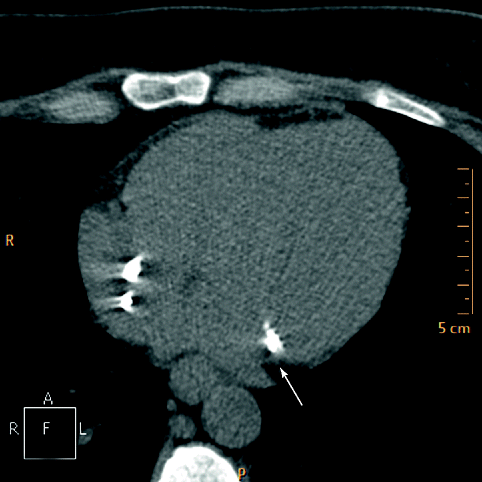
Fig. 8.8
The location of the coronary artery is within the atrioventricular groove within low-attenuation (darker region) epicardial fat (arrow). Calcifications in this image lie within the mitral annulus
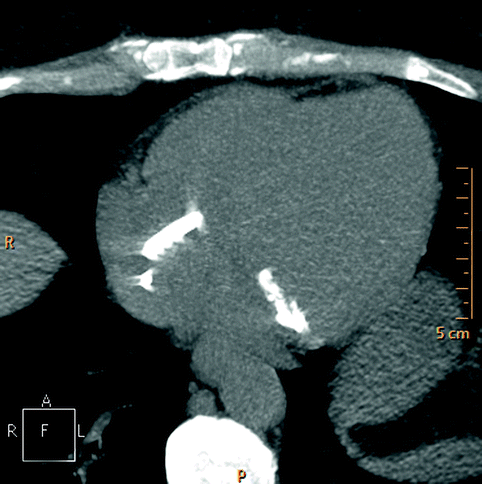
Fig. 8.9
Thicker axial image from Fig. 8.8 showing the extent of the mitral annular calcification in the typical location along the posterior aspect of the heart (posterior to the posterior mitral valve leaflet)
Obesity can also cause false positive findings of coronary calcium due to high image noise within the low-energy CT scan. The calcium scores in such cases tend to be very low (<10) and would be generally considered to be of limited prognostic importance.
Noise in coronary calcium scans is depicted as a granular appearance of the scan data. Noise can be quantitated as the standard deviation of the attenuation values in the image. See Fig. 8.10.
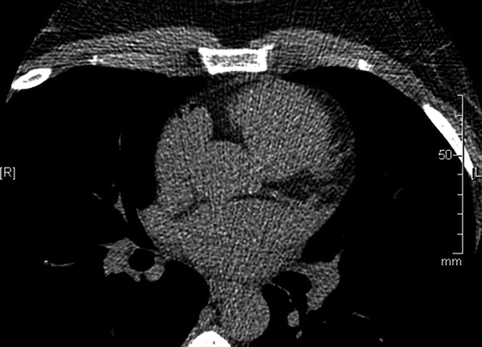
Fig. 8.10
Calcium scan image in a 38 year old Hispanic woman with a body mass index of 39 kg/m2. A small focus of coronary calcium was identified with a total coronary calcium score of 1, although this may be false positive due to high image noise from obesity
Stay updated, free articles. Join our Telegram channel

Full access? Get Clinical Tree


