13 Nonangiographic Coronary Lesion Assessment FFR, IVUS, OCT, NIRS
The rationale for using nonangiographic lesion assessment tools arises from two principles: (1) that revascularization (via percutaneous coronary intervention [PCI] or coronary artery bypass graft [CABG]) is justified best by the presence of ischemia, which depends on the hemodynamic significance of a lesion; and (2) that the coronary angiogram frequently fails to establish the hemodynamic significance of coronary stenoses with accuracy, particularly the intermediately narrowed (between 30% and 80% diameter stenosis) lesions. This limitation of angiography has been documented repeatedly by poor correlations to stress testing and is attributable to the anatomical complexity of the atherosclerotic lumen (Fig. 13-1).
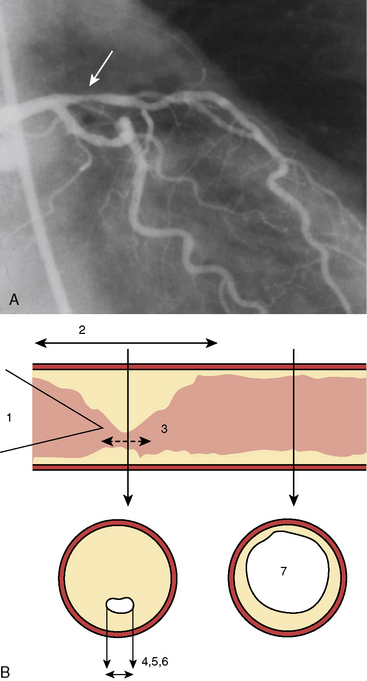
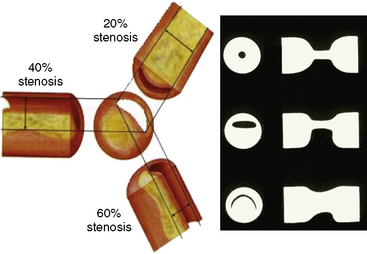
Coronary angiography can only produce a two-dimensional silhouette image of the three-dimensional vascular lumen. Angiographic accuracy is further limited by the inability to identify diffusely “diseased” and “normal” vessel segments. In addition, unlike intravascular ultrasound (IVUS), angiography does not provide vascular wall detail sufficient to characterize plaque size, length, and eccentricity. The eccentric lumen produces conflicting degrees of angiographic narrowing when viewed from different angulations, causing uncertainty related to lumen size and its impact on coronary blood flow. Moreover, there are at least six morphologic features that determine resistance to flow, most of which can be measured from the angiogram or even IVUS (Figs. 13-1, 13-2). Additional artifacts, including contrast streaming, branch overlap, vessel foreshortening, calcifications, and ostial origins, further contribute to uncertain angiographic lesion interpretation.
Coronary Pressure and Fractional Flow Reserve
Concept of FFR
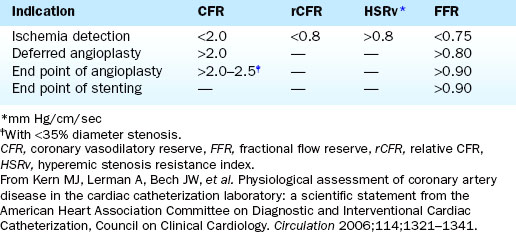
FFR is defined as the ratio of maximal hyperemic flow across an epicardial coronary stenosis compared with maximal hyperemic flow in the same artery without the stenosis. FFR is expressed as the percentage of normal maximal flow through the stenotic artery. FFR can be separately computed for the myocardium (FFRm), the epicardial coronary artery (FFRc), and the collaterals, (FFRcollat), based on translesional pressure measured during maximal hyperemia and in some cases coronary occlusion wedge pressure. Figures 13-3 and 13-4 illustrate the concept and data used to derive FFR. Table 13-1 lists the calculations for FFR and Table 13-2 lists the thresholds for clinical applications of FFR.
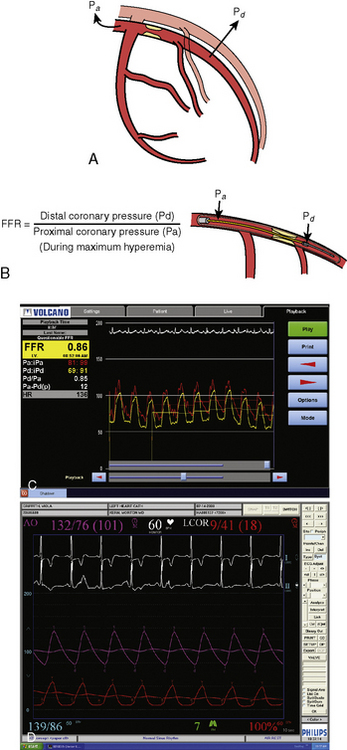
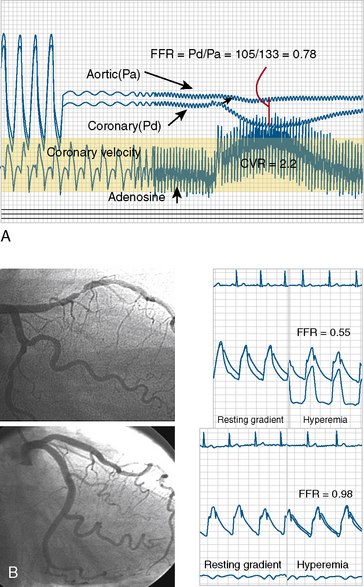
Table 13-1 Calculations of Fraction Flow Reserve From Pressure Measurements Taken During Maximal Arterial Vasodilation
| Myocardial fraction flow reserve (FFRmyo): FFRmyo= 1 – ΔP/Pa – Pv = Pc – Pv/Pa – Pv = Pc/Pa Coronary fractional flow reserve (FFRcor): FFRcor = 1 – ΔP(Pa – Pw) Collateral fractional flow reserve (FFRcoll): FFRcoll = FFRmyo – FFRcor |
Note: All measurements are made during hyperemia except Pw.
Pa, mean aortic pressure; Pc, distal coronary pressure; ΔP, mean translesional pressure gradient; Pv, mean right atrial pressure; Pw, mean coronary wedge pressure or distal coronary pressure during balloon inflation.
From Pijls NHJ, van Som AM, Kirkeeide RL, et al. Experimental basis of determining maximum coronary, myocardial, and collateral blood flow by pressure measurements for assessing functional stenosis severity before and after percutaneous transluminal coronary angioplasty. Circulation 1993;87:1354–1367.
Technique of FFR
1. The pressure wire is connected to the system’s pressure analyzer and calibrated and zeroed outside the body.
2. Anticoagulation intravenous (IV) heparin (usually 40 U/kg) and intracoronary (IC) nitroglycerin (100–200 μg bolus) are administered.
3. The wire is advanced through the guide to the coronary artery. The pressure wire signal and the guide pressure are matched (i.e., equalized, also called normalized) before crossing the stenosis. By early convention, the guidewire transducer was positioned at the end of the guide catheter. In fact, it does not matter exactly where the wire is in relation to the guide catheter or coronary ostium except that both should be in the aortic sinus when equalizing the signals.
4. The wire is then advanced across the stenosis about 2 cm distal to the coronary lesion.
5. Maximal hyperemia is induced with IV adenosine (140 μg/kg/min) or IC bolus adenosine (20–30 μg for the right coronary artery, 60–100 μg for the left coronary artery). Alternative hyperemic agents are rarely used but include IC papaverine (10 mg), nitroprusside (50–100 μg), or ATP (50–100 μg). FFR is measured at 2 min for IV adenosine and at 15 to 20 seconds after IC adenosine.
6. The ratio of the mean distal pressure to mean proximal pressure during maximal hyperemia is calculated as the FFR. An FFR <0.80 has a strong ischemic correlation and is an indication to proceed with PCI. If a PCI is deemed necessary, it can be performed using the pressure wire as the angioplasty guidewire. After the procedure, FFR can be remeasured to assess the adequacy of the intervention.
7. Finally, at the end of the procedure (either the assessment or the PCI), the pressure wire should be pulled back into the guide to confirm equal pressure readings, or the lack of pressure wire drift. Table 13-2 shows the criteria for FFR and associated clinical situations.
Coronary Hyperemia for FFR
IV adenosine is weight based, operator independent, and the preferred method of inducing hyperemia. By providing a prolonged hyperemic stimulus, IV adenosine allows for a slow pullback of the pressure wire, useful for identifying the exact location of the pressure dropoff or the presence of diffuse disease. It is also required for assessment of aorto-ostial narrowings to permit maximal coronary flow without guide catheter obstruction (Box 13-1, Table 13-3A, Box 13-2, Table 13-3B).
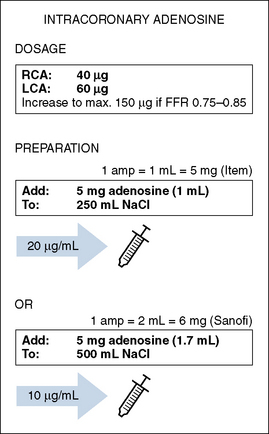
Table 13-3A Intracoronary Adenosine
| Effects: | |
| ≤10 seconds after administration. | |
| <20 seconds. | |
| Side Effects: | |
| Short and rapidly transient. Usually after injection in the RCA. | |
| Comments: | |
| Hyperemia generally | |
| Avoids performing measurements influenced by spasm. | |
| I.C. bolus injection generally | |
| Unknown amounts of the drug may spill into the aorta. | |
| Pressure damping may occur. This can be recognized by a ventricularized aortic pressure curve. | |
| I.C. adenosine specifically | |
| No steady-state hyperemia. | |
| Overestimation of FFR (underestimation of stenosis severity) may occur if only mean pressure is recorded. | |
| If too long, hyperemia will be over before aortic pressure can be measured again. | |
| The effects of adenosine wear off quickly. Wait between measurements just long enough for the previous dose to cease to have effect. | |
| In case of suboptimal hyperemia, overestimation of FFR (underestimation of stenosis severity) may occur. If FFR 0.75-0.85, check for pitfalls and repeat measurement, increase dose or switch to I.V. adenosine or another drug. In 10-15% of patients only submaximum hyperemia can be achieved using I.C. adenosine. FFR may be underestimated due to e.g., caffeine and theophylline (adenosine are inhibited by adenosine receptor antagonists, such as methylxanthines). | |
(Modified from Volcano Therapeutics.)
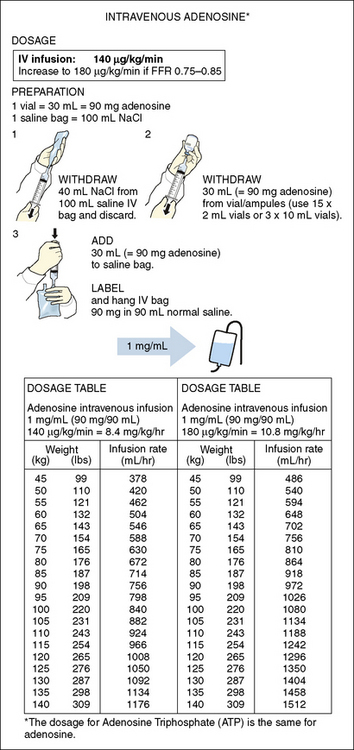
Table 13-3B Intravenous Adenosine
| Effects: | |
| ≤2 minutes after administration in central vein. | |
| Effect disappears within 2 minutes after infusion stopped. | |
| Side Effects: | |
| Rarely. | |
| Risk for bronchospasm. | |
| A slight increase in blood pressure often precedes the decrease. | |
| Disappears rapidly after ending the infusion. Harmless and does not indicate ischemia. Inform and reassure the patient in advance. | |
| Comments: | |
| Hyperemia generally: | |
| Avoids performing measurements influenced by spasm. | |
| I.V. infusion generally | |
| Inadequate infusion may result in suboptimal hyperemia. | |
| Improper infusion may result in fluctuations in pressure. | |
| I.V. adenosine specifically | |
| Steady-state hyperemia. | |
| Decrease of venous return = pressure signal fluctuations—overestimation of FFR. | |
| In case of suboptimal hyperemia, overestimation of FFR (underestimation of stenosis severity) may occur. If FFR 0.75-0.85, check for pitfalls and repeat measurement, increase dose, or switch to another drug. Only submaximum hyperemia can be achieved in approximately 8% of patients using IV adenosine. FFR may be underestimated due to e.g., caffeine and theophylline (adenosine is inhibited by adenosine receptor antagonists, such as methylxanthines). | |
(Modified from Volcano Therapeutics.)
Pitfalls of FFR
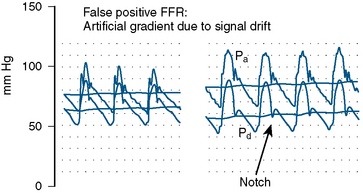
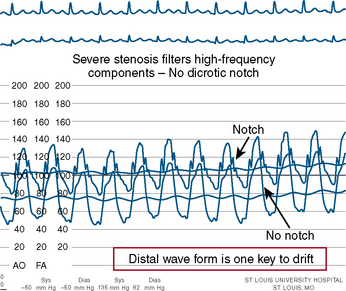
The errors in the performance of accurate FFR involve hemodynamic artifacts and failure to induce maximal hyperemia. Tables 13-4, 13-5, and 13-6 list these problems. Figures 13-5, 13-6, 13-7, and 13-8 show artifacts that may produce false FFR readings.
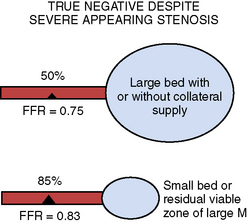
Table 13-4 Reasons for Nonischemic Fractional Flow Reserve (FFR) Despite an Apparently Severe Stenosis
| Physiologic Explanations |
|---|
| Interpretable Explanations |
| Technical Explanations |
| Actual False Negative FFR |
From Koolen JJ, Pijls NHJ. Coronary pressure never lies. Catheter Cardiovasc Interv 2008;72:248–256.
Table 13-5 Factors Involved in Fractional Flow Reserve Accuracy
Table 13-6 Most Common Reasons for False Negative and False Positive Fractional Flow Reserve (FFR)
| False Negative |
| Pressure Damping |
| No hyperemia |
| Wrong drug, not mixed not delivered (IV) or side holes |
| False Positive |
| Small artery, small territory |
| pressure signal drift |
| Cautionary considerations: pathophysiologic conditions theoretically limiting FFR |
| Left Ventricular Hypertrophy |
| Exercise-Induced Vasoconstriction |
| Microvascular Disease and Myocardial Infarction |
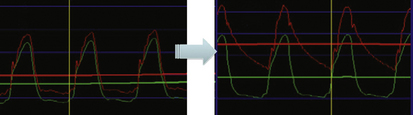
Figure 13-5 Example of pressure signal damping (left) and after withdrawal of guide catheter (right).
Use of FFR for Specific Angiographic Subsets
Intermediate Coronary Lesion
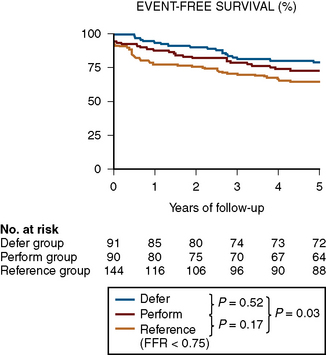
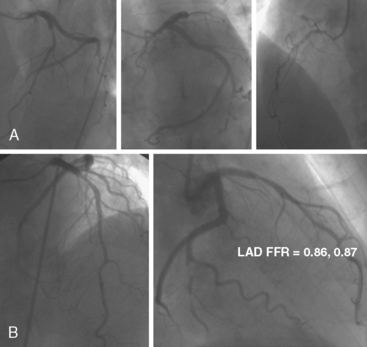
FFR assists the operator in deciding to treat or not treat coronary lesions based on ischemia. Some operators are concerned that not stenting intermediate but hemodynamically insignificant lesions will result in harm to the patient later. This concern is unfounded based on the 5-year outcomes of the DEFER study. The DEFER study randomized 325 patients scheduled for PCI into three groups: a deferral group (n = 91) in whom an FFR was ≥ 0.75 and medical therapy was continued; or despite an FFR > 0.75, the PCI performance group (n = 90), in which the lesions were treated with stents. The third group was the reference group (n = 144) who had an FFR < 0.75 and stents were placed as planned. For the deferred and performed groups, the event-free survival was the same (80% and 73% respectively, P = 0.52), and both were significantly better than in the reference group (63%, P = 0.03). The composite rate of cardiac death and acute myocardial infarction (MI) in the deferred, performed, and reference groups was 3%, 8%, and 16% respectively (P = 0.21 for deferred vs. performed and P = 0.003 for reference vs. both of the deferred and performed groups) (Fig. 13-9). The percentage of patients free from chest pain on follow-up was not different between the deferred and performed groups. The 5-year risk of cardiac death or MI in patients with a normal FFR is <1% per year and is not decreased by stenting. Treating patients with intermediate lesions assisted by FFR is associated with a low event rate, comparable to event rates in patients with normal noninvasive testing. Figure 13-10 is an example of FFR for intermediate lesion assessment. Similar outcomes for deferment of lesions with FFR > 0.80 were also reported in patients in the FAME study described in the next section.
Multivessel Disease PCI
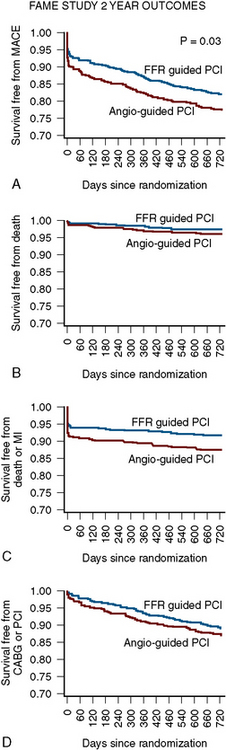
Compared with the Angio-PCI group, the FFR-PCI group used fewer stents per patient (1.9 ± 1.3 vs. 2.7 ± 1.2, P < 0.001) and less contrast (272 mL vs. 302 mL, P < 0.001), had a lower procedure cost (US$ 5,332 vs. US$ 6,007, P < 0.001), and had a shorter hospital stay (3.4 vs. 3.7 days, P = 0.05). More importantly, the 2-year rates of mortality or MI were 13% in the Angio-PCI group compared with 8% in the FFR-PCI group (P = 0.02). Composite rates of death, nonfatal MI, or revascularization were 22% and 18%, respectively (P = 0.08). For lesions deferred on the basis of FFR > 0.80, the rate of MI was only 0.2% and the rate of revascularization was 3.2 % after 2 years (Fig. 13-11).
Significance of Abnormal FFR after PCI
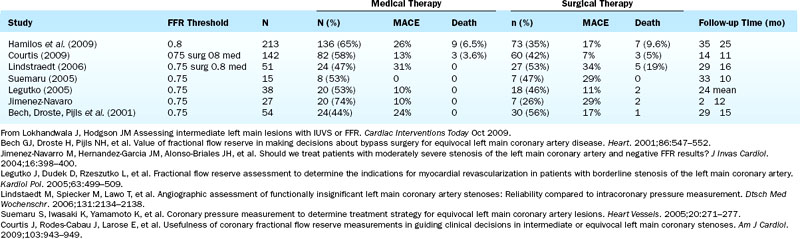
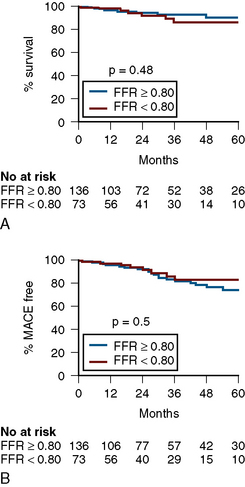
Left Main Stenosis
Numerous studies of FFR support its use in equivocal left main CAD (Table 13-7). Most recently, Hamilos et al., in a large multicenter prospective trial, examined FFR and 5-year outcomes in 213 patients with an angiographically equivocal left main coronary artery stenosis. When FFR was >0.80, patients were treated medically or another stenosis was treated by coronary angioplasty (nonsurgical group; n = 138). When FFR was <0.80, CABG surgery was performed (surgical group; n = 75). The 5-year survival estimates were 90% in the nonsurgical (FFR > 0.80) group and 85% in the surgical (FFR < 0.80) group (P = 0.48). The 5-year event-free survival estimates were 74% and 82% in the two groups, respectively (P = 0.50) (Fig. 13-12). Of note, only 23% of patients with a diameter stenosis >50% had a hemodynamically significant left main stenosis as measured by FFR. Table 13-7 lists studies with FFR for left main stenosis.