Figure 4-1.
(a) Norepinephrine (NE) cascade from synthesis to vesicular storage, release into synaptic cleft, reuptake, and partial inactivation. (b, c) The processes of synthesis, vesicular–axoplasmic exchange, metabolism, release, neuronal and extraneuronal uptake, spillover, and turnover of NE for sympathetic nerves of the normal (b) and failing (c) human heart at rest. Both NE release and uptake are increased in the failing heart; the efficiency of the NE uptake is reduced such that cardiac spillover of NE is increased disproportionately more than neuronal uptake. As such, cardiac NE stores are 50 % lower in HF. Numbers with each arrow represent the rates of each process in a hundredth of actual picomoles per minute value (100 pg or 1× is the normal amount of NE spilled into the circulation, and representation as 1/100th of values makes it easier to understand the relative changes in the NE cascade). AC adenyl cyclase, cAMP cyclic adenosine monophosphate, COMT catechol-O-methyltransferase; DA dopamine, DHPG dihydroxyphenylglycol, DOPA dihydroxyphalanine, NE norepinephrine, NMN normetanephrine, MAO, monoamineoxidase, RUT1 reuptake 1 (Adapted from Narula and Sarkar [33]).
Figure 4-2.
Representation of postganglionic presynaptic sympathetic neuron, synapse, and postsynaptic myocyte. MIBG enters the synapse and is taken up into the neuron by the NET and stored in NE vesicles. With each cycle of neuronal stimulation and release of NE, a small amount of MIBG reenters the synapse and diffuses back into the vascular system, where it is transported to and excreted by the kidneys unchanged. In HF patients, increased sympathetic outflow [34] and a decrease in the number and function of NET sites [35] result in more rapid clearance of neuronal MIBG, usually quantified by the parameter “washout” in terms of the percentage reduction in MIBG activity between early (15-min) and late (4-h) images. High levels of washout (>40–50 %) are associated with an increase in adverse events, such as HF progression and cardiac death [5].
Figure 4-3.
Time–activity curves from dynamic MIBG acquisition from the anterior chest of a 69-year-old patient with New York Heart Association (NYHA) class III HF. The MYO curve (blue) represents counts (CTS) in the whole heart, whereas the LV curve (red) reflects the myocardial region of interest (ROI), excluding the left ventricular cavity. Both MYO and LV curves reach a relative plateau by minute 4, reflecting first-pass extraction of MIBG, and then show a slow decrease in counts thereafter as a manifestation of washout. Washout typically is quantified in terms of relative decrease in myocardial activity between the 15-min (early) and 4-h (late) postinjection images, with a normal range of 10–20 %. Note that liver counts increase continuously throughout this period, reflecting the high proportion of MIBG that accumulates in this organ (typically about 30 % of the injected activity) [36]. MED mediastinum (Image courtesy of A. Jacobson).
MIBG Imaging and the Sympathetic Nervous System in Heart Failure
Figure 4-4.
MIBG images and quantitation of uptake on planar views. Images are commonly acquired shortly (15–20 min) after MIBG administration (“early”) and repeated after 3–4 h (“late”). (a) In a normal heart, both early and late images show uniform myocardial uptake of MIBG, with clear delineation from the surrounding lung and mediastinum. There is always intense liver uptake, as this organ accumulates about 30 % of the injected dose. (b) Quantitation of myocardial uptake usually is done in terms of the heart/mediastinum (H/M) ratio of counts/pixel values; a typical method for drawing ROIs on planar anterior thorax images is illustrated here. Normal H/M values primarily depend on the type of collimator used on the nuclear camera [37]; for late images, these ratios typically are in the 1.8–2.2 range for the low-energy high-resolution collimators widely used in the United States and Europe [38] and 2.4–2.8 for the low–medium and medium energy collimators more commonly used in Japan [5]. (c), Washout rate (WR) reflects the change in myocardial activity between early and late images. The normal washout rate typically is in the 10–20 % range, whereas HF patients commonly have rates as high as 30–50 % [8]. Both low late H/M ratios and high washout rates are associated with poor outcomes in HF patients [9]. (a and b from AdreView package insert; images courtesy of GE Healthcare. c from Yamada et al. [8]; with permission).
Figure 4-5.
Spectrum of 4-h delayed planar MIBG images of the anterior chest. (a) This image, from a patient without heart disease, shows uniform uptake and a normal H/M ratio (2.4). (b) This image, from a patient with NYHA class II nonischemic cardiomyopathy, shows relatively preserved uptake with an H/M ratio of 1.8. (c, d), These images are from HF patients with moderate and severe reduction in MIBG cardiac uptake; H/M ratios are 1.3 and 1.0, respectively. HF patients with poor cardiac uptake of MIBG are at increased risk for adverse cardiac outcomes [38].
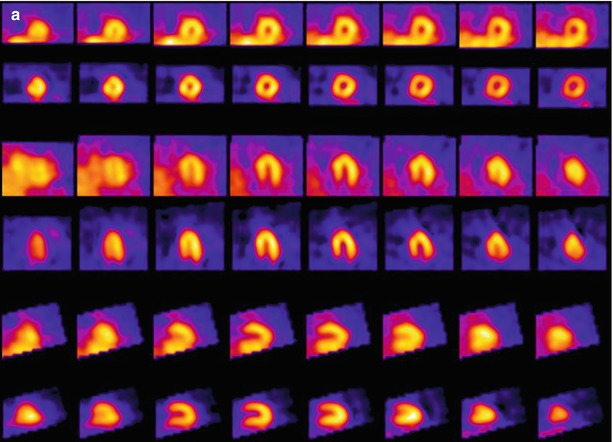
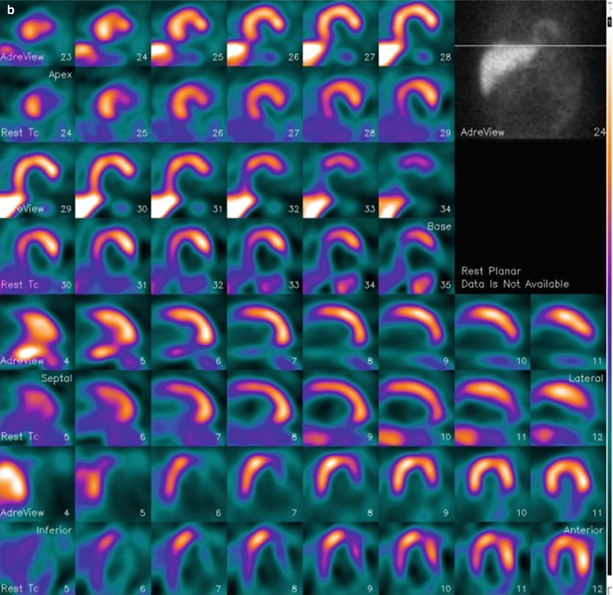
Figure 4-6.
MIBG and technetium-99m (99mTc)-tetrofosmin SPECT in a patient without heart disease (a) and in a patient with ischemic HF (b). Each display alternates between rows of MIBG and myocardial perfusion imaging (MPI) slices. There is uniform uptake in all myocardial walls of the normal patient. The HF patient has a perfusion defect in the basal inferolateral wall (white arrow), consistent with a prior myocardial infarction (MI). The associated innervation defect is much larger, involving most of the surrounding inferior and lateral walls and apex (blue arrows). This pattern of innervation/perfusion mismatch—that is, abnormal innervation in a region with preserved perfusion—is common in patients with MI and has been associated with increased susceptibility to ventricular arrhythmic events [22, 39].
Figure 4-7.
Polar maps of myocardial distribution (center–apex to periphery–base) of MIBG from early (15 min post injection) and late (4 h post injection) SPECT images of the normal heart for comparison with those of selected carbon-11 (11C)-labeled positron emission tomography (PET) tracers also used to assess functional status of the sympathetic nervous system. The mechanism of neuronal uptake for hydroxyephedrine (HED) and epinephrine is the same as that for MIBG, with the NET responsible for transferring the compounds into the neuronal cytoplasm. CGP12388 binds to postsynaptic β-receptors, providing a means to assess the distribution and density of these adrenergic receptors. Distribution patterns for all five image sets are equivalently uniform, confirming that all tracers are interrogating attributes of the same physiologic system [40].
Figure 4-8.
MIBG imaging in conjunction with the NET inhibitor amitriptyline as a means to stress the neuronal system to uncover covert dysfunction. (a) MIBG polar maps from SPECT studies performed at rest and after administration of amitriptyline show induction of a severe regional decrease in tracer uptake in the inferior, septal, and apical walls after pharmacologic stress. (b) Individual change in regional distribution of cardiac MIBG uptake based on a polar map (20-segment model) in six patients demonstrates the variable effect of amitriptyline, with patients 3 and 5 showing substantially greater reduction in uptake than the other four patients. This might reflect a greater susceptibility to worsening neuronal dysfunction with cardiac stress (ischemic, psychological, etc.) that might place the patient at increased risk for morbidity and mortality [41] (a from Estorch et al. [41]; b adapted from Estorch et al. [41]).
Planar MIBG Imaging for Prognostic Assessment
Figure 4-9.
(a) One- and 2-year all-cause mortality rates for the 961 HF subjects in the ADMIRE-HFX (AdreView Myocardial Imaging for Risk Evaluation in Heart Failure Extension) study. For the 10 % of subjects with the lowest H/M ratios (H/M < 1.20, n = 92), mortality rates were 13 and 7 times greater, respectively, than for the 20 % of subjects with H/M ≥ 1.60 (n = 201). (b–d) The clinical consequence of this difference in innervation status is illustrated in these scans from three NYHA class II male patients in the trial: (b) a 65-year-old with a left ventricular ejection fraction (LVEF) 25 % and an H/M of 0.96 (outcome: death from HF progression at 8 months); (c), a 51-year-old with an LVEF of 33 % and an H/M of 1.38 (outcome: SCD at 8 months); and (d), a 64-year-old with an LVEF of 30 % and an H/M of 1.67 (outcome: survival to 2 years with no events) (Bar graph adapted from AdreView Package insert; images courtesy of GE Healthcare).
Figure 4-10.
The largest amount of data on MIBG imaging in HF has been collected in Japan. (a) Based on data from 1322 NYHA I to IV HF patients followed up for a median of 5.6 years after planar MIBG imaging [10], the optimal values for distinguishing patients with a higher risk of all-cause mortality from those with a lower one were an H/M ratio (HMR) of 1.68 and a washout rate of 43 %. (b) These discriminators were independent of LVEF, as shown here, confirming previous observations that cardiac neuronal imaging provides information different from that obtained by measuring ventricular systolic function [42]. As such, MIBG may be used to evaluate prognosis in HF patients who have either reduced or preserved systolic function.
Figure 4-11.
Event-free survival analyses from a European meta-analysis of 636 HF patients studied with planar MIBG imaging. Shown are curves for all-cause mortality (a), cardiac mortality (b), arrhythmic events (resuscitated cardiac arrest, appropriate ICD discharge, or sustained ventricular tachycardia longer than 30 s and heart rate >100 bpm) (c), and cardiac transplantation (d). During a maximum follow-up of 60 months (mean 36 mo), there were 83 deaths (67 cardiac), 33 arrhythmic events, and 56 cardiac transplantations. H/M first quintile (blue line) was ≤1.32, second to fourth quintiles (green, beige, and purple lines respectively) were 1.33–1.97, and fifth quintile (horizontal yellow line at 1.0) was ≥1.98. For all end points, decreasing late H/M was associated with increased event risk, but for arrhythmic events, the differences among quintiles were not statistically significant. This reflects the nonlinear relationship between arrhythmic events and cardiac MIBG uptake, as presented in further detail in Fig. 4.12 [11].
Figure 4-12.
Occurrence of arrhythmic events in relation to H/M ratio on planar MIBG imaging. (a) Data from a European retrospective study with 290 HF patients. (b) Data from 961 HF patients in the prospective ADMIRE-HF study. In the European study, the highest event proportions for cardiac transplant and cardiac death were in patients with H/M ratios in the lowest quartile (≤1.45), whereas the lowest proportions were for those in the highest H/M ratio quartile (≥2.18) [43]. In contrast, the highest proportion of arrhythmic events was among patients in the second quartile (1.46–1.74), representing those with only mild–moderate neuronal dysfunction. This observation was confirmed in the 2-year results from ADMIRE-HF, in which the highest arrhythmic event rate (nonfatal and fatal) was in subjects with an H/M between 1.30 and 1.59 [44]; 1.30 was the lower limit of normal for control subjects in the trial, and 1.60 was the prospectively defined threshold for preserved cardiac innervation. The event rate difference among H/M ratio groups was particularly dramatic among the 471 subjects with LVEF above the median value of 29 %. This suggests that in HF patients with less severe left ventricular (LV) dysfunction, cardiac neuronal abnormalities of moderate severity play an important role in the occurrence of unstable ventricular rhythms.
MIBG SPECT for Arrhythmic Risk Assessment
Figure 4-13.
Relationship between planar and SPECT MIBG results in patients with ischemic HF (n = 471). The graph shows the results of late H/M ratio on planar images compared with summed defect score determined by visual assessment of SPECT images using a 17-segment model (0–4 score, maximum 68). There is moderate correlation between the values. However, there is a wide distribution of SPECT scores for patients with H/M ratios <2.0, reflecting the relative insensitivity of the two-dimensional planar technique for detecting potentially significant regional neuronal abnormalities, especially in the posterolateral wall and toward the base of the heart. These results suggest that planar and SPECT MIBG imaging methods provide complementary information and should both be performed when feasible [45].
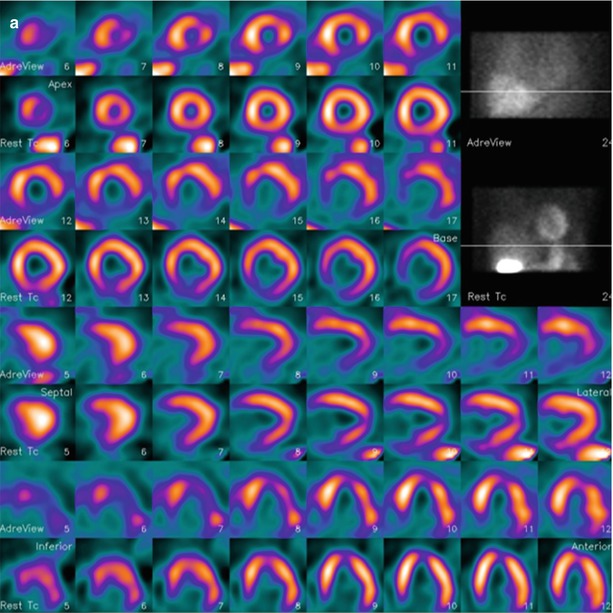
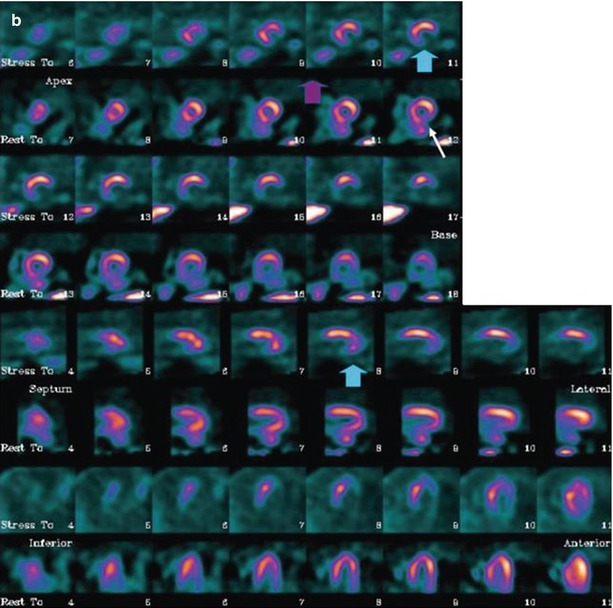
Figure 4-14.
SPECT studies with MIBG (rows 1, 3, 5, and 7) and rest 99mTc-tetrofosmin (rows 2, 4, 6, and 8) in two patients with ischemic HF. MIBG defect scores are based on visual assessment using a standard 17-segment model (score 0–4, maximum 68). (a) This patient has moderate cavity dilatation on MPI, but uptake is nearly normal except for a small area at the base of the inferior septum. There is a larger abnormality in the inferior wall on the MIBG images, representing an area of innervation/perfusion mismatch (MIBG defect score, 14). (b) This patient has a large matched defect in the inferior and inferolateral walls on both MIBG and tetrofosmin images (MIBG defect score, 22). Based on the results of several studies, the risk for arrhythmic events is increased for HF patients with large innervation defects on MIBG SPECT imaging [45, 46]. The 123I-MIBG/perfusion mismatch score hazard ratio (HR) is 1.06 (95 % confidence interval [CI], 1.02–1.09), P < 0.01 on univariate Cox analysis and 1.01 (95 % CI, 0.97–1.06), P = 0.5 on multivariate Cox analysis (Images courtesy of GE Healthcare).
Figure 4-15.
Analyses examining the prognostic significance of mismatch between MIBG and MPI SPECT for the occurrence of arrhythmic events. Although numerous studies have examined the significance of innervation/perfusion mismatch, results based on visual scoring of SPECT scans occasionally have been contradictory. (a) In a study in 50 patients with ischemic heart disease referred for electrophysiologic (EP) testing, mismatch score did not predict the inducibility of sustained ventricular tachycardia [24]. SS summed score. (b) In a study with 116 HF patients referred for ICD placement, mismatch score predicted subsequent ICD shocks on univariate but not multivariate Cox analysis [46]. (c) A small study of 27 HF patients referred for ICD placement showed the significance of mismatch scores as a predictor of ICD activations during a mean follow-up of 16 months [39]. NS not significant, SRS summed rest score. (d) A recent informed reread of 500 MIBG and tetrofosmin SPECT studies from ischemic HF patients in ADMIRE-HF found that those with innervation/perfusion mismatches in one or two wall regions (of anterior, septum, inferior, lateral, and apex) had a 2-year arrhythmic event rate two times higher than patients with either less or greater abnormalities [45]. In all four studies cited, MIBG SPECT defect score was a significant predictor of subsequent arrhythmic events. In aggregate, these and other studies have confirmed that medium to large innervation defects on MIBG SPECT studies (typically involving 20–50 % of the myocardium) are associated with an increased risk for arrhythmias. Although the precise role of MPI SPECT as an adjunctive technique remains to be elucidated, interpretation of location and severity of MIBG defects on visual reads is facilitated by the availability of correlative perfusion SPECT images.
Risk Assessment with MIBG Imaging in Conjunction with Other Clinical Measurements and Multivariate Models
Figure 4-16.


Use of MIBG imaging combined with B-type natriuretic peptide (BNP) and LVEF. In ADMIRE-HF, a planar H/M ratio of 1.60 was prospectively defined as the lower limit of preserved neuronal uptake. (a) Considering the end point of cardiac death, this threshold identified patients at low absolute risk, with only two events (among 201 patients) over a median follow-up of 17 months. (b, c), Using the median values of BNP (140 ng/L) and LVEF (29 %) as further discriminators, the highest event rates clearly were found among those with high BNP and low LVEF. (d) Cumulative event curves for cardiac death, categorized in terms of the presence of parameter values in the most abnormal quartile. In relation to the most abnormal quartiles of BNP (>310 ng/L), LVEF (≤23 %), and H/M (≤1.30), there was a significant difference between subjects with zero or one such value and those with two or three values. Cardiac death during 2 years was about six times more likely in a patient with the highest risk values of LVEF, BNP, and H/M compared with a patient with no such values. The multivariate event model developed from the ADMIRE-HF study included four variables: H/M ratio, LVEF, NYHA functional class, and BNP [38].
Stay updated, free articles. Join our Telegram channel
Full access? Get Clinical Tree
