β-Blockers
Angiotensin-converting enzyme inhibitors
Angiotensin receptor blockers
Aldosterone inhibitors
Cell transplantation
Coronary arterial revascularization
Mitral valve repair/replacement
CRT
LVAD
Inhibition of the β-adrenergic system or renin–angiotensin–aldosterone system (RAAS) is known to induce reduction in LV chamber size and hence reverse remodeling. Cell transplantation may be a promising option for treating patients with end-stage HF who are resistant to conventional therapies. Device-based interventions such as CRT and LVAD implantation also may induce reverse remodeling and lead to a better prognosis. However, it should be noted that not all patients will show significant improvement in response to these therapeutic options. We expect that imaging-based biomarkers, such as those obtained by MIBG imaging, will provide clues for better patient selection and therapy monitoring.
Figure 6-1.
Representative example of reverse remodeling induced by LVAD therapy. Serial chest radiographs and echocardiograms (M mode, parasternal long-axis view) from a male patient with a multiyear history of idiopathic dilated cardiomyopathy and HF refractory to standard therapy, including inotropes (a–c). The patient underwent a combination of LVAD unloading and pharmacologic therapy and was weaned from the LVAD successfully 6 months after implantation. He continued on standard HF pharmacologic therapy and achieved a sustained functional recovery with no signs or symptoms of HF over a 7-year follow-up period. EF ejection fraction (left ventricular), LVIDd LV end-diastolic diameter (From Drakos et al. [14]; with permission).
Figure 6-2.
(a) Quantitative relationship between drug/device effects on ejection fraction (EF) and mortality: each data point represents a placebo-corrected change in EF from an individual remodeling trial plotted against the mortality odds ratio (OR) for the specific therapy. Color-coded mortality effect based on meta-analysis of published data. Interventions were classified as favorable (blue circles) if the upper limit of the 95 % confidence interval (CI) of the OR for death from the mortality trials was less than 1, neutral (black circles) if the 95 % CI crossed 1, and adverse (red circles) if the lower limit of the 95 % CI was greater than 1. There was a significant correlation between short-term therapeutic effect on LVEF and longer-term therapeutic effect on mortality (ρ = −0.51, P < 0.001). Remodeling data were derived from analysis of 86 randomized controlled trials (RCTs) of 25 interventions involving 19,092 patients. (b) Predicted probability of a categorical mortality outcome based on drug/device effect on EF: the lines represent the likelihood of a categorical mortality outcome based on an intervention’s trial-level effect on EF compared with placebo (unadjusted, weighted, ordered logistic regression). Color-coded mortality effect based on meta-analysis of published data. Definition of mortality effect for a given intervention is as described in A. The graph suggests that if the mean change in EF is 10 % in the short-term studies, the probabilities that the long-term mortality studies will be significantly favorable (blue line), neutral (black line), or significantly unfavorable (red line) are approximately 85 %, 15 %, and 1 %, respectively. As such, the degree of drug/device-induced reverse remodeling as reflected by EF change is a quantitative marker of favorable prognosis (Adapted from Kramer et al. [4]).
Figure 6-3.
(a) Quantitative relationship between drug/device effects on end-diastolic volume (EDV) and mortality: each data point represents a placebo-corrected change in EDV from an individual remodeling trial plotted against the mortality OR for the specific therapy. Color-coded mortality effect based on meta-analysis of published data: favorable (blue circles), neutral (black circles), or adverse (red circles). Definition of mortality effect for a given intervention is as described in Fig. 6.2. There was a significant correlation between effect sizes in the mortality trials and mean therapy-induced changes in EDV (ρ = 0.44, P = 0.002). Remodeling data derived from analysis of 50 randomized controlled trials (RCTs) of 19 interventions, including 10,855 total patients. (b) Predicted probability of a categorical mortality outcome based on drug/device effect on EDV: the lines represent the likelihood of a categorical mortality outcome based on an intervention’s trial-level effect on EDV compared with placebo (unadjusted, weighted, ordered logistic regression). Color-coded mortality effect based on meta-analysis of published data. Definition of mortality effect for a given intervention is as described in Fig. 6.2. The graph suggests that if the mean change in EDV is −10 mL in the short-term studies, the probability that the long-term mortality studies will be significantly favorable (blue line), neutral (black line), or significantly unfavorable (red line) is approximately 56 %, 43 %, and 1 %, respectively. As such, the degree of drug/device-induced reverse remodeling as reflected by EDV change is a quantitative marker of favorable prognosis (Adapted from Kramer et al. [4]).
Figure 6-4.
(a) Quantitative relationship between drug/device effects on end-systolic volume (ESV) and mortality: each data point represents a placebo-corrected change in ESV from an individual remodeling trial plotted against the mortality OR for the specific therapy. Color-coded mortality effect based on meta-analysis of published data: favorable (blue circles), neutral (black circles), or adverse (red circles). Definition of mortality effect for a given intervention is as described in Fig. 6.2. There was a significant correlation between effect sizes in the mortality trials and the effect sizes on ESV in the remodeling studies (ρ = 0.48, P = 0.002). Remodeling data are derived from analysis of 40 randomized controlled trials (RCTs) of 16 interventions, including 5,435 total patients. (b) Predicted probability of a favorable mortality outcome based on drug/device effect on ESV. The blue line represents the likelihood of a favorable mortality outcome based on an intervention’s trial-level effect on ESV compared with placebo (unadjusted weighted logistic regression). There was insufficient remodeling data for ESV to model the probability for neutral or adverse outcomes individually. Color-coded mortality effect based on meta-analysis of published data. Definition of mortality effect for a given intervention is as described in Fig. 6.2. The graph suggests that if the mean change in ESV is +25 mL in the short-term studies, the probability that the long-term mortality studies will be significantly favorable is approximately 20 %. This is equivalent to stating that the probability that the long-term mortality studies are neutral or significantly unfavorable is approximately 80 % (100−20 %). As such, the degree of drug/device-induced reverse remodeling as reflected by ESV change is a quantitative marker of favorable prognosis (Adapted from Kramer et al. [4]).
Figure 6-5.
Schematic representation of the β-adrenergic system in the setting of remodeling and reverse remodeling. Remodeling is associated with excessive activation of sympathetic nerve activity [15], reduction in functional neuronal density [16, 17], and downregulation of β-adrenergic receptors [18–20]. It also is noteworthy that the degree of increase in sympathetic nerve activity is related to that of downregulation of β-adrenergic receptors [19]. Reverse remodeling, on the other hand, likely is associated with normalization of such adaptive or maladaptive changes.
Effects of LVADs on Sympathetic Neuronal Imaging
Table 6-2.
Summary of published results assessing the effect of LVAD on cardiac sympathetic activity using serial MIB) imaging.
Authors | Publication year | Patients, n | Imaging time points | Imaging parameters | Imaging results |
|---|---|---|---|---|---|
Miyagawa et al. [21] | 2001 | 2 (10)a | 2 months and >1 year | Early, late HMR; WR | No significant change |
Drakos et al. [6] | 2010 | 12 | Before and at 3 months | Early, late HMR; WR | Increase in both early and late HMR, decrease in WR |
George et al. [22] | 2013 | 14 | 35 ± 20 and 243 ± 92 days | Early, late HMR; WR | Increase in both early and late HMR, decrease in WR |
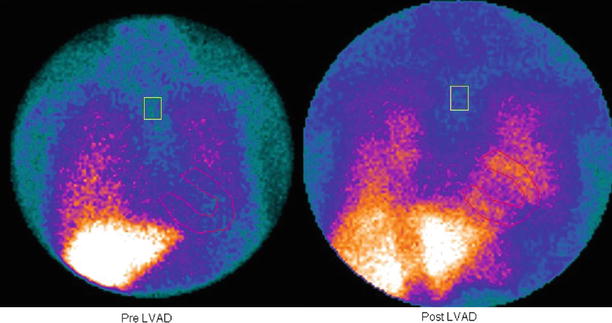
Figure 6-6.
Effect of an LVAD on late MIBG imaging in a patient with dilated cardiomyopathy. There was an increase in cardiac MIBG uptake after 3 months of LVAD support, indicating sympathetic reverse remodeling (From Drakos et al. [6]; with permission).

Figure 6-7.
Effect of an LVAD on late heart-to-mediastinum MIBG uptake ratio (H/M Late). There was a significant increase in H/M Late after 3 months of LVAD support, which was associated with improved LV function and decreased LV size, indicating that sympathetic reverse remodeling is linked to geometric reverse remodeling (Adapted from Drakos et al. [6]).
Figure 6-8.
Effect of an LVAD on MIBG WR. The WR decreased significantly after 3 months of LVAD support, indicating improvement of excessive β-adrenergic activity (Adapted from Drakos et al. [6]).
Effects of CRT on Sympathetic Neuronal Imaging
Table 6-3.
Summary of published results assessing the effect of CRT on cardiac sympathetic activity using serial MIBG imaging.
Authors | Publication year | Patients, n | Imaging time points | Imaging parameters | Imaging results |
|---|---|---|---|---|---|
Erol-Yilmaz et al. [23] | 2005 | 13 | Before and at 6 months | Early, late HMR; WR | Increase in late HMR, and decrease in WR |
Gould et al. [24] | 2007 | 10 | 2 scans (CRT-on and CRT-off) with 2-week interval | Early, late HMR; WR | Increase in both early and late HMR |
Nishioka et al. [7] | 2007 | 30 | Before and >3 months after | Early, late HMR; WR | Increase in both early and late HMR; decrease in WR only in responders |
Burri et al. [25] | 2008 | 16 | Before and >6 months after | Early, late HMR; WR | Decrease in WR only in responders |
Cha et al. [26] | 2008 | 16 | Before and at 6 months | Early, late HMR; WR | Increase in late HMR and decrease in WR |
Cha et al. [27] | 2011 | 45 | Before and at 6 months | Early, late HMR; WR | Increase in late HMR; decrease in WR only in responders |
Shinohara et al. [28] | 2011 | 27 | Before and at 6 months | Early, late HMR; WR | Increase in late HMR only in responders |
Figure 6-9.
Effect of CRT on late MIBG imaging in a patient with HF. MIBG images before (a) and during CRT (b). Cardiac MIBG uptake increased after 2 weeks of CRT, indicating CRT-induced sympathetic reverse remodeling (From Gould et al. [24]; with permission).
Figure 6-10.


Correlation between change in LVEF and change in MIBG washout (both in absolute terms) induced by CRT. There was a moderate but significant negative correlation between the two parameters, supporting the notion that sympathetic reverse remodeling is linked to geometric reverse remodeling (Adapted from Burri et al. [25]).
Stay updated, free articles. Join our Telegram channel
Full access? Get Clinical Tree
