The status of neointimal coverage on the drug-eluting stent (DES) struts, which are placed across the side-branch vessels, remains unclear. The degree of neointimal coverage of stent struts crossing the side-branch vessel was evaluated according to the different types of DESs. Follow-up optical coherence tomography images at 9.3 months after the index procedure were identified in 51 patients who had undergone DES (sirolimus-eluting stents [SESs] in 22 patients, paclitaxel-eluting stents [PESs] in 15, and zotarolimus-eluting stents [ZESs] in 14) implantation with crossover of the side-branch vessels (size >2.0 mm). The enrolled patients were classified as a covered group if every unapposed strut showed neointimal coverage or an uncovered group if any struts lacked neointimal coverage. The neointimal hyperplasia thickness was also measured. The number of patients in the covered group was 15 (29%), with 36 patients in the uncovered group. Significant differences were found in the proportion of the covered group among the 3 DES types (6 [27%] of 22 with SESs, 1 [7%] of 15 with PESs, and 8 [57%] of 14 with ZESs; p = 0.011). The percentage of neointimal coverage in the overall stent struts was also significantly different among the 3 DES types (65% of 356 struts, 20% of 165 struts, and 83% of 143 struts for the SESs, PESs, and ZESs, respectively; p<0.001). The neointimal hyperplasia thickness in the PES group was significantly smaller than those of the ZES and SES groups (0.02 ± 0.02 mm vs 0.08 ± 0.06 mm and 0.04 ± 0.03 mm, respectively; p = 0.002). In conclusion, different patterns of neointimal coverage of the stent struts crossing the side branch vessels were observed according to the type of DES.
Neointimal proliferation or the restenosis process after stenting results from migration and proliferation of smooth muscle cells from adventitia to the luminal side. When stent implantation is performed to cross over the side-branch vessel, the stent struts that are positioned on the side-branch vessels are not intrinsically attached to the vessel wall. The lack of attachment of the stent struts that cross over the side-branch vessel to the vessel wall does not allow the migration and proliferation of smooth muscle cells from the adventitia. Theoretically, neointimal coverage on the stent struts across the side-branch vessels might not be expected. Although drug-eluting stents (DESs) have reduced the rate of restenosis compared to bare metal stents, safety concerns have been raised about the occurrence of late stent thrombosis. Several pathologic studies have suggested that late stent thrombosis might be associated with delayed arterial healing, characterized by incomplete or absent neointimal coverage in the DESs. The stent struts that are placed across the side-branch vessels might be intrinsically typical examples of the lack of neointimal coverage. Few published data are available regarding neointimal coverage on the stent struts across the side-branch vessels. Therefore, we investigated the degree of neointimal coverage on the DES struts according to the different types of DESs.
Methods
The Yonsei Optical Coherence Tomography (OCT) registry was a study in which follow-up OCT was performed to evaluate the neointimal coverage in patients who had undergone coronary stent implantation. The study included 379 patients who had undergone follow-up OCT at 9.3 ± 1.0 months after stent implantation from August 2007 to May 2009. A total of 51 patients were identified from the Yonsei OCT registry who had undergone DES implantation across the side-branch vessels. The DES types consisted of sirolimus-eluting stents (SESs, Cypher, Cordis, Miami Lakes, Florida) in 22 patients, paclitaxel-eluting stents (PESs, Taxus, Boston Scientific, Natick, Massachusetts) in 15, and zotarolimus-eluting stents (ZESs, Endeavor Splint, Medtronic, Santa Rosa, California) in 14 patients. The inclusion criteria for the present study were as follows: (1) a de novo lesion with >50% diameter stenosis, (2) a main vessel diameter of ≥2.5 mm, and (3) a side-branch vessel diameter of ≥2.0 mm. To measure the main vessel and side-branch vessel size to determine whether the patients met the inclusion criteria, quantitative coronary angiographic analysis was performed using an off-line quantitative coronary angiographic analysis system (CASS System, Pie Medical Instruments, Maastricht, The Netherlands). The exclusion criteria were as follows: (1) untreated significant left main coronary artery disease, (2) apparent congestive heart failure, (3) renal insufficiency with a baseline creatinine of ≥2.0 mg/dl, (4) unsuitable lesions for OCT (vessel size ≥3.5 mm or proximal lesions within 10 mm of the ostium of each major epicardial artery), (5) poor image quality from OCT, (6) overlapped stent segments, and (7) bifurcation lesions treated with stent implantation in both the main vessel and the side branch. DES implantation was performed using conventional techniques without other complications. Unfractionated heparin was administered at an initial bolus of 100 IU/kg, with additional boluses administered during the procedure to achieve an activated clotting time of 250 to 300 seconds. Dual (aspirin and clopidogrel) antiplatelet therapy was given to all patients until follow-up angiography and OCT had been performed. All patients gave written informed consent, and the institutional review boards at our centers approved the present study.
OCT was performed using a conventional optical coherence tomographic system (model M2, Cardiology Imaging System, LightLab Imaging, Westford, Massachusetts) with a motorized pull-back system at 1.0 mm/s. The occlusion catheter was positioned proximal to the stent, and a 0.014-in. wire-type imaging catheter (ImageWire, LightLab Imaging) was positioned distal to the stent. During image acquisition, the occlusion balloon (Helios, Avantec Vascular, Sunnyvale, California) was inflated to 0.4 to 0.6 atm, and Ringer’s lactate solution was infused at the speed of 0.5 to 1.0 ml/s. The imaging wire was pulled from distal to proximal, and continuous images were stored digitally for subsequent analysis. OCT into the side-branch vessel through the stent struts was not performed.
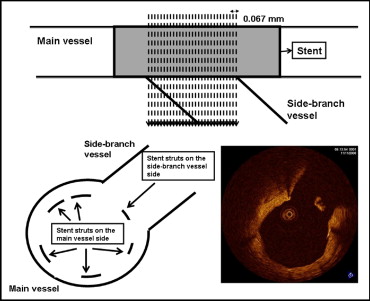
Quantitative analysis of the cross-sectional optical coherence tomographic images was performed by independent staff who were unaware of the patient information and stent type. Each cross-sectional still frame from OCT was selected with a 0.067-mm interval at the limited segments with the stent struts crossing a side branch ( Figure 1 ). The stented segment was chosen where the side-branch vessels took >45° of the main vessel’s circumference at entrance. The still frames were selected according to the appearance of the stent struts and lack of image artifacts such as motion artifacts. Each unapposed stent strut on the side-branch vessels was classified as either covered or uncovered, according to the presence of neointimal coverage. The enrolled patients were included in the covered group if every strut within the segment showed neointimal coverage or the uncovered group if any strut lacked neointimal coverage. In addition, the neointimal hyperplasia (NIH) thickness was measured as the distance between the endoluminal surface of the neointima and the stent strut. A NIH thickness of 0 μm was defined as an uncovered stent strut. The mean values of the optical coherence tomographic variables are reported in the present study. The inter- and intraobserver variability results for the optical coherence tomographic variables have been previously reported.
All analyses were performed using the Statistical Analysis Systems statistical package, version 9.1.3 (SAS Institute, Cary, North Carolina). Continuous variables are presented as the mean ± SD and were analyzed using Student’s t test or analysis of variance. The categorical data are presented as numbers and frequencies and were compared using the chi-square test or Fisher’s exact test. All statistical tests were 2-sided, and the differences were considered statistically significant at p <0.05.
Results
The number of patients in the covered group was 15 (29%), with 36 patients in the uncovered group. No significant differences were found in the demographic data, cardiovascular risk factors, or medications, including dual antiplatelet therapy, between the covered and uncovered groups ( Table 1 ). Finally, kissing balloon angioplasty for side-branch lesions was performed in 2 patients (6%) in the uncovered group and 1 patient (7%) in the covered group (p = 0.88). The results of the optical coherence tomographic analysis between the 2 groups is listed in Table 2 . Significant differences were found in the proportion of strut coverage among the 3 types of DESs (6 [27%] of 22 with SESs, 1 [7%] of 15 with PESs, and 8 [57%] of 14 with ZESs; p = 0.011). The baseline clinical characteristics among the patients treated with 3 types of DESs are listed in Table 3 . The patients who underwent ZES implantation had more hypercholesterolemia. The optical coherence tomographic analysis among the 3 types of DESs is listed in Table 4 . Compared to the PES and ZES group, the SES group had a significantly smaller stent area (9.0 ± 2.0 mm 2 and 8.3 ± 1.6 mm 2 vs 7.3 ± 1.5 mm 2 , respectively, p = 0.014) and NIH area (1.6 ± 0.7 mm 2 and 2.2 ± 0.9 mm 2 vs 0.5 ± 0.3 mm 2 , respectively, p <0.001). The overall percentage of neointimal coverage in the stent struts was also significantly different among the 3 DES types (65% of 356 struts, 20% of 165 struts, and 83% of 143 struts for the SESs, PESs, and ZESs, respectively; p <0.001). The NIH thickness in the PES group was significantly smaller than that of the ZES and SES groups (0.02 ± 0.02 mm vs 0.08 ± 0.06 mm and 0.04 ± 0.03 mm, respectively, p = 0.002; Figure 2 ). A weak correlation was found for NIH thickness between the main vessel and side-branch vessel in all patients (Pearson’s correlation coefficient, r = 0.217, p <0.001; r = 0.265, p <0.001 for SES; r = −0.413, p <0.001 for PES; and r = 0.251, p = 0.021 for ZES).
| Variable | Uncovered (n = 36) | Covered (n = 15) | p Value |
|---|---|---|---|
| Age (years) | 61 ± 9 | 61 ± 11 | 0.858 |
| Men | 22 (61%) | 10 (66%) | 0.708 |
| Diabetes mellitus | 10 (27%) | 2 (13%) | 0.268 |
| Hypertension ⁎ | 20 (55%) | 5 (33%) | 0.148 |
| Hypercholesterolemia (total cholesterol ≥240 mg/dl) | 10 (27%) | 5 (33%) | 0.692 |
| Current smoker | 10 (27%) | 6 (40%) | 0.685 |
| Acute coronary syndrome | 27 (75%) | 12 (80%) | 0.701 |
| Medications | |||
| Aspirin | 36 (100%) | 15 (100%) | 1.0 |
| β Blocker | 30 (83%) | 15 (100%) | 0.092 |
| Angiotensin-converting enzyme inhibitors | 10 (27%) | 2 (13%) | 0.248 |
| Angiotensin receptor blocker | 22 (61%) | 11 (73%) | 0.474 |
| Calcium channel blocker | 3 (8%) | 1 (6%) | 0.225 |
| Statin | 34 (94%) | 15 (100%) | 0.352 |
| Duration of dual antiplatelet treatment (days) | 422 ± 143 | 371 ± 186 | 0.321 |
| Target coronary arteries | 0.741 | ||
| Left anterior descending | 25 | 9 | |
| Left circumflex | 5 | 2 | |
| Right | 6 | 4 |
⁎ Included patients with systolic blood pressure >140 mm Hg and/or diastolic blood pressure >90 mm Hg or taking antihypertensive medication.
| Variable | Uncovered (n = 36) | Covered (n = 15) | p Value |
|---|---|---|---|
| Duration between index procedure and follow-up OCT (days) | 285 ± 29 | 271 ± 25 | 0.120 |
| No. of struts on side branch | 15 ± 11 | 11 ± 9 | 0.163 |
| No. of struts on main vessel | 68 ± 40 | 60 ± 45 | 0.518 |
| Lumen area (mm 2 ) | 6.9 ± 1.6 | 6.3 ± 1.7 | 0.239 |
| Stent area (mm 2 ) | 8.2 ± 1.9 | 7.9 ± 1.6 | 0.594 |
| Neointimal hyperplasia area (mm 2 ) | 1.2 ± 0.9 | 1.5 ± 1.2 | 0.339 |
| Percentage of neointimal hyperplasia (%) | 14 ± 9 | 19 ± 14 | 0.252 |
| Stent type | 0.011 | ||
| Sirolimus eluting | 16 | 6 | |
| Paclitaxel eluting | 14 | 1 | |
| Zotarolimus eluting | 6 | 8 |
| Characteristic | DES | p Value | ||
|---|---|---|---|---|
| Sirolimus (n = 22) | Paclitaxel (n = 15) | Zotarolimus (n = 14) | ||
| Age (years) | 61 ± 10 | 63 ± 11 | 60 ± 9 | 0.727 |
| Men | 11 (50%) | 12 (80%) | 9 (64%) | 0.178 |
| Diabetes mellitus | 6 (27%) | 1 (7%) | 5 (36%) | 0.157 |
| Hypertension | 10 (45%) | 6 (40%) | 9 (64%) | 0.386 |
| Hypercholesterolemia | 4 (18%) | 2 (13%) | 9 (64%) | 0.003 |
| Current smoker | 9 (41%) | 5 (33%) | 2 (14%) | 0.123 |
| Acute coronary syndrome | 16 (72%) | 11 (73%) | 12 (85%) | 0.632 |
| Medications | ||||
| Aspirin | 22 (100%) | 15 (100%) | 14 (100%) | 1.0 |
| β Blocker | 18 (82%) | 14 (93%) | 13 (93%) | 0.464 |
| Angiotensin-converting enzyme inhibitors | 5 (23%) | 4 (26%) | 3 (21%) | 0.947 |
| Angiotensin receptor blocker | 14 (64%) | 8 (53%) | 11 (78%) | 0.357 |
| Calcium channel blocker | 3 (13%) | 1 (6%) | 0 (0%) | 0.666 |
| Statin | 21 (95%) | 15 (100%) | 13 (93%) | 0.600 |
| Duration of dual antiplatelet treatment (days) | 445 ± 155 | 426 ± 101 | 319 ± 189 | 0.083 |
| Target coronary arteries | 0.406 | |||
| Left anterior descending | 16 | 10 | 8 | |
| Left circumflex | 4 | 2 | 1 | |
| Right | 2 | 3 | 5 | |
Stay updated, free articles. Join our Telegram channel

Full access? Get Clinical Tree


