In recent years, the prevalence of myocardial infarction (MI) has increased among women and decreased among men aged 35 to 54 years. To determine the extent to which changes in incidence account for recent variations in prevalence, we assessed the temporal trends in gender-specific hospitalization rates for MI. Using the Nationwide Inpatient Sample, we identified patients aged 35 to 64 years admitted to United States hospitals with a primary discharge diagnosis of MI from 1997 to 2006 (n = 2,824,615). The age-standardized MI hospitalization rates per 100,000 subjects were assessed for men and women aged 35 to 44, 45 to 54, and 55 to 64 years. The MI hospitalization rates per 100,000 subjects decreased by 26% from 168 to 126 for men and by 18% from 56 to 46 for women (both p <0.001). The reductions in the MI hospitalization rates were greatest among men aged 45 to 54, men aged 55 to 64, and women aged 55 to 64 years (standardized rates of change −3%, −4%, and −3% annually, p <0.001). The MI hospitalization rates decreased slightly for women aged 45 to 54 years and men aged 35 to 44 years (standardized rate of change −2% annually, p <0.001) and increased for women aged 35 to 44 years (standardized rate of change 2% annually, p = 0.008). In conclusion, from 1997 to 2006, men and women aged 35 to 64 years experienced an overall decrease in MI hospitalization rates; the reductions were more pronounced in men than in women. The slight increase in MI hospitalizations among women aged 35 to 44 years might have played a small role in the previously noted increases in MI prevalence among middle-age women.
A recent analysis of the gender-specific prevalence of myocardial infarction (MI) among subjects aged 35 to 54 years in the United States revealed that during the past 2 decades, the MI prevalence rates increased among women and decreased among men. Given the sparse data on the gender-specific MI incidence among midlife subjects, it is unclear whether the increase in MI prevalence among midlife women resulted from an increase in the incidence or an improvement in survival. The objective of the present study was to assess recent gender-specific temporal trends in the hospitalization rates for MI among middle-aged subjects in the United States.
Methods
Data were obtained from the Nationwide Inpatient Sample (NIS), developed as a part of the Healthcare Cost and Utilization Project. The NIS approximates a stratified 20% sample of all non-Federal, short-term, general, and specialty hospitals serving adults in the United States. The sampling strategy selects hospitals within states that have State Inpatient Databases according to defined strata determined by ownership, bed size, teaching status, urban/rural location, and region. All discharges from sampled hospitals for the calendar year are then selected for inclusion into the NIS. To allow extrapolation for national estimates, both hospital and discharge weights are provided. Detailed information on the design of the NIS is available at www.hcup-us.ahrq.gov . From 1997 to 2006, the NIS captured discharge-level information on primary and secondary diagnoses and procedures, discharge vital status, and demographics for several million discharges annually. The data elements that could directly or indirectly identify subjects are excluded. The unit of analysis was the discharge rather than the patient; discharges were therefore all considered independent. A unique hospital identifier allowed for linkage of the discharge data to an NIS data set with hospital characteristics.
All patients with a diagnosis of MI aged 35 to 64 years at hospital admission were included regardless of whether they were alive or dead at discharge. We identified all patients with a primary discharge diagnosis of acute MI using the International Classification of Diseases, 9th Revision, Clinical Modification code 410.×0 or 410.×1.
We computed the weighted frequencies of MI hospitalizations by year, gender, and age group using the Healthcare Cost and Utilization Project-NIS data to obtain the rate numerators. The rate denominators were obtained using United States census data. Age standardization was subsequently performed using the 2000 standard United States population. We did not adjust for race, given the large amount of missing data for this variable (25%). We assessed the trends in the hospitalization rates by gender and age group using linear regression analysis with the weighted hospitalization rate as the outcome and year, gender, and year by gender interaction as the predictors, by age group and overall. To test for curvilinear trends, we included the year as a continuous variable, together with the quadratic term to the regression models. We report the average slopes (yearly rates of change on the absolute scale) expressed as the number of MIs/100,000 subjects annually using the above regression models. Because the MI hospitalization rates substantially varied by age and gender, we computed the standardized slopes by dividing the slope on the absolute scale using the 1997 MI hospitalization rate for each age–gender group (standardized yearly rates of change) expressed as a percentage of the 1997 hospitalization rate. The p values for assessing the gender differences in the hospitalization rates across the 10-year study period were computed using Z tests. All data analyses were conducted using SAS, version 9.1 (SAS Institute, Cary, North Carolina). Statistical hypotheses were tested using p <0.05 as the level of statistical significance.
Results
From 1997 to 2006, 2,047,593 men and 777,022 women aged 35 to 64 years were hospitalized for acute MI in the United States. The demographic and hospital characteristics for MI admissions in 1997 and 2006 were similar; in both years, most patients were white and men and had private insurance. Most MI admissions were to urban hospitals, and most patients were admitted through the emergency department ( Table 1 ). The only notable difference was the greater percentage of admissions to teaching hospitals in 2006 compared to 1997 ( Table 1 ).
| 1997 | 2006 | |||||||
|---|---|---|---|---|---|---|---|---|
| Sample Frequency | Weighted Frequency | Weighted Percentage | SE | Sample Frequency | Weighted Frequency | Weighted Percentage | SE | |
| Gender | ||||||||
| Male | 40,043 | 195,440 | 74 | 0.3 | 41,760 | 203,017 | 72 | 0.3 |
| Female | 13,928 | 68,171 | 26 | 0.3 | 16,230 | 78,909 | 28 | 0.3 |
| Race | ||||||||
| White | 34,676 | 168,166 | 82 | 1.0 | 31,246 | 151,570 | 76 | 1.4 |
| Black | 3,947 | 19,352 | 9 | 0.6 | 4,424 | 21,427 | 11 | 0.7 |
| Hispanic | 2,290 | 10,873 | 5 | 0.6 | 3,606 | 17,285 | 8 | 0.8 |
| Other | 1693 | 7,783 | 4 | 0.5 | 2,471 | 11,962 | 6 | 0.6 |
| Primary payer | ||||||||
| Medicare | 5,411 | 26,511 | 10 | 0.2 | 7,608 | 37,041 | 13 | 0.3 |
| Medicaid | 4,450 | 21,883 | 8 | 0.3 | 5,691 | 27,884 | 10 | 0.5 |
| Private | 36,453 | 178,113 | 68 | 0.8 | 33,908 | 165,339 | 59 | 0.9 |
| Other | 7,517 | 36,271 | 14 | 0.6 | 10,702 | 51,286 | 18 | 0.6 |
| Hospital region | ||||||||
| Northeast | 12,315 | 61,529 | 23 | 1.6 | 9,637 | 50,801 | 18 | 1.6 |
| Midwest | 11,651 | 58,643 | 22 | 1.3 | 12,638 | 64,513 | 23 | 1.5 |
| South | 21,100 | 101,689 | 39 | 1.7 | 26,347 | 122,645 | 43 | 1.9 |
| West | 8,908 | 41,765 | 16 | 0.9 | 9,381 | 44,030 | 16 | 1.2 |
| Hospital location | ||||||||
| Rural | 6,871 | 34,829 | 13 | 0.9 | 4,114 | 21,010 | 7 | 0.8 |
| Urban | 46,967 | 228,135 | 87 | 0.9 | 53,742 | 260,299 | 93 | 0.8 |
| Teaching status | ||||||||
| Nonteaching | 34,126 | 164,657 | 63 | 1.8 | 27,679 | 130,680 | 46 | 1.9 |
| Teaching | 19,712 | 98,307 | 37 | 1.8 | 30,177 | 150,629 | 54 | 1.9 |
| Admission source | ||||||||
| Emergency | 30,610 | 149,132 | 58 | 1.7 | 33,527 | 162,815 | 58 | 1.8 |
| Another hospital, another health facility, court/law enforcement | 12,368 | 60,766 | 24 | 13,422 | 65,441 | 23 | 1.5 | |
| Routine, other | 9,214 | 45,790 | 18 | 0.9 | 10,910 | 53,024 | 19 | 1.3 |
| Age | Q1 | Median | Q3 | Q1 | Median | Q3 | ||
| 48 | 54 | 59 | 49 | 55 | 60 | |||
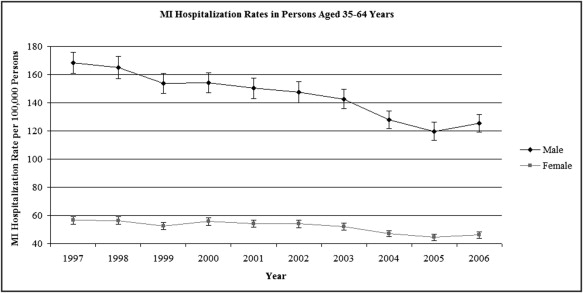
Among those aged 35 to 64 years, men consistently had greater MI hospitalization rates than women ( Figure 1 ) . The temporal trends showed reductions in the MI hospitalization rates in both men and women, with slightly greater relative improvements in the men. The age-standardized rate decreased during the decade by 26% from 168 to 126 MI hospitalizations per 100,000 subjects (linear trend, p <0.001) in men aged 35 to 64 years and by 18% from 56 to 46 MI hospitalizations per 100,000 subjects (linear trend, p <0.001) in women aged 35 to 64 years ( Table 2 and Figure 1 ). Comparatively, the absolute reduction in the MI hospitalization rates was greater in men than in women (slope −5 MIs/100,000 subjects annually vs −1 MIs/100,000 subjects annually, p <0.001).
| Year | Men | Women | ||||
|---|---|---|---|---|---|---|
| Total MI Hospitalizations | Age-Adjusted Rate MI Hospitalization (/100,000 Subjects) | 95% CI | Total MI Hospitalizations | Age-Adjusted Rate MI Hospitalization (/100,000 Subjects) | 95% CI | |
| 1997 | 205,600 | 168 | 161–176 | 73,642 | 56 | 54–59 |
| 1998 | 207,868 | 165 | 157–173 | 75,764 | 56 | 54–59 |
| 1999 | 199,475 | 154 | 147–161 | 72,783 | 52 | 50–55 |
| 2000 | 210,250 | 154 | 147–161 | 80,252 | 56 | 53–58 |
| 2001 | 210,335 | 150 | 143–158 | 79,987 | 54 | 52–57 |
| 2002 | 213,554 | 148 | 140–155 | 82,701 | 54 | 51–57 |
| 2003 | 212,675 | 143 | 136–150 | 82,318 | 52 | 50–54 |
| 2004 | 196,163 | 128 | 122–134 | 76,397 | 47 | 45–49 |
| 2005 | 188,656 | 120 | 113–126 | 74,267 | 44 | 42–47 |
| 2006 | 203,017 | 126 | 119–132 | 78,909 | 46 | 44–48 |
| Average slope | −5 | −6 to −4 | −1 | −2 to −0.05 | ||
Stay updated, free articles. Join our Telegram channel

Full access? Get Clinical Tree


