Myocardial Perfusion in Ischemic Heart Disease
Juerg Schwitter
INTRODUCTION
Coronary artery disease (CAD) is the leading cause of death in the industrialized world causing more than 36% of all deaths in the United States (1). More than 50,000 individuals per million are estimated at risk for a heart attack at some time during the course of their CAD (2). In addition to causing more than seven million deaths worldwide each year (3), the total human burden of CAD was estimated at 47 millions of disability-adjusted life years in 1990 and rising to 82 million in 2020 (3). The economic burden is also important. For instance, the total direct and indirect costs of CAD and stroke in the United States for 2008 was estimated at $156 billion (4).
Treatment of CAD showed intriguing progress in the past years based on therapeutic strategies aimed at risk factor modifications, for example, through lipid-lowering interventions, and through new options for revascularizations, for example, by the introduction of drug-eluting stents. These improvements were somehow contrasted by a lack of efficient diagnostics. Invasive coronary angiography detects disease reliably, but is costly and bears a small risk for complications. Noninvasive techniques such as stress echocardiography is safe, but its robustness is suboptimal resulting in a compromised reproducibility and wrong diagnoses (5). Scintigraphic techniques demonstrate adequate reproducibility, but some limitations in spatial resolution reduce sensitivity, while attenuation artifacts compromise specificity (6,7). As a consequence of these limitations, in a randomized controlled prospective trial an exercise ECG was shown to be as effective as SPECT to guide the management of women with suspected CAD and consequently, exercise ECG reduced costs of CAD management substantially (8). Finally, SPECT exposes patients to radiation, which becomes important if the technique should screen patients for presence of disease and/or should monitor progression of disease in patients with known CAD. Similarly, this limitation of radiation also applies for CT coronary angiography. MR perfusion imaging is not affected by any of these limitations. Instead, it shows an unbeatable versatility. Therefore, in the first place, the pathophysiologic events during CAD development will be summarized followed by some technical considerations concerning pulse sequences, imaging parameters, contrast media (CM), and data analysis. Taking its technical complexity into account, the performance of MR perfusion imaging in multicenter trials is of particular importance and there is an increasing number of positive trials available (9,10,11 and 12). These and future studies will define the position of MR perfusion imaging in the work-up of cardiac patients.
PATHOPHYSIOLOGY OF CORONARY ARTERY DISEASE
DEVELOPMENT OF CORONARY ARTERY LESIONS
A large number of clinical and experimental studies could relate endothelial dysfunction to cardiovascular risk factors (RFs), thereby supporting the concept of endothelial dysfunction being a crucial initial step in the development of atherosclerosis (13,14 and 15). In dysfunctional endothelium, the production of NO is reduced which in turn enhances the expression of endothelial adhesion molecules, and consequently, promotes the recruitment of leucocytes to the vessel intima (16). While mononuclear leucocytes typically become foam cells by accumulating lipids and form reversible fatty streaks, accumulation of smooth muscle cells and their production of extracellular matrix may induce the formation of fibrous lesions during this phase of atherogenesis. Inflammatory mediators can impede the ability of smooth muscle cells to maintain the collagen content in atherosclerotic lesions (17). Further, activated macrophages are also known to produce matrix-degrading enzymes (18), which can cause destabilization of the fibrous cap of atheromas, finally resulting in plaque rupture (19). Repetitive plaque ruptures, often clinically silent, and subsequent healing may account for an intermittent progression of atherosclerotic lesions (20,21 and 22). With progressive disease, ruptures of larger plaques containing considerable amounts of lipids and tissue factor, a powerful procoagulant can cause ultimate thrombus formation and acute vessel occlusion (23). In line with this concept, invasive studies demonstrated an increasing risk for rupture for lesions with increasing severity of stenosis (22,24,25). Accordingly, vulnerable plaques are characterized by four major criteria (26): (1) Thin cap with large lipid core, (2) stenosis >90%, (3) endothelial denudation with superficial platelet aggregation, and (4) fissured plaque. A major goal of noninvasive imaging is to identify vulnerable plaques in the various perfusion beds, particularly the heart, the carotids, renals, and peripheral arteries of the lower limbs.
Ideally, identification of vulnerable plaques would include determination of location, mass (i.e., stenosis severity), and composition of lesions. Direct visualization of plaques in the coronary circulation has been performed in several studies and is discussed in detail in Chapters 27 and 28. In this context, it might be useful to consider the following: In a 3-mm coronary vessel imaged with a currently available spatial resolution of 0.5 × 0.5 mm2 for coronary MRA, signal distribution in as little as 27 pixels would determine the degree of stenosis. With respect to plaque composition, as little as 6 pixels per component would characterize plaque tissue of a 70% stenosis (considering three components in the plaque: Fibrosis, lipid necrotic core, and inflammatory cell-rich component, and each occupying a third of plaque area) in a 3-mm vessel. Alternatively, one could aim at determining the severity of stenosis by assessing myocardial perfusion disturbances, whereby one would neglect the additional information contained in the plaque composition. In this case, a 3-mm vessel is assumed to supply approximately 60 g of muscle tissue (27), which corresponds to about 1,875 pixels (considering a spatial resolution of 2×2 mm2 for perfusion imaging, slice thickness of 8 mm). It seems obvious that a change in stenosis severity would be more reliably detected by interrogating 1,875 pixels in the myocardium than 27 pixels covering the cross-sectional area of the coronary vessel. Besides these technical considerations, there is overwhelming evidence from the literature that ischemia burden is one of the most important predictors of future complications in patients with CAD (28,29 and 30). Thus, ischemia is identifying the patient population at risk which should benefit from treatment/revascularization. This concept is supported by a large number of studies demonstrating an excellent prognosis in patients without ischemia (this aspect is discussed in detail in Chapter 19). Also, the assessment of ischemia by fractional flow reserve (FFR), an invasive tool, proved the importance of ischemia as a prognostic factor and its usefulness to guide treatment decisions. In the FAME trial in >1,000 patients, treatment decisions, when based on ischemia assessment by FFR, improved patient outcome (31) and FFR-based decisions were cost-effective over coronary ang iography alone (32). In this light, the high diagnostic agreement between ischemia assessment by perfusion CMR and FFR is of particular importance (see also Table 15.2).
DETECTION OF HEMODYNAMICALLY SIGNIFICANT CORONARY LESIONS
Once the decision is made to assess myocardial perfusion, in order to assess coronary artery stenoses, two major strategies are currently proposed to achieve this goal. One is based on the concept that a hemodynamically significant stenosis limits flow during hyperemia, which can be induced by IV infusion of a pharmacologic vasodilator such as adenosine (or dipyridamole). In order to detect a reduction in hyperemic flow in a given subject, the measured hyperemic flow must be compared with a normal value for hyperemic flow. Conversely, the concept proposing coronary flow reserve (CFR) in order to detect hemodynamically significant stenoses, suggests to “normalize” hyperemic flow by dividing it through resting flow, yielding a ratio (flowhyperemic/flowrest). Several PET studies demonstrated a close correlation of CFR versus percent area stenosis with a tendency toward better correlations of hyperemic flow versus percent area stenosis (47,48 and 49). While the first approach, that is, a stress-only protocol, requires a normal database to provide threshold values for the hyperemic flow state, the second approach, that is, the CFR approach, incorporates measurements of resting flow. Division of hyperemic flow by resting flow may become problematic taking into account that many factors influencing resting flow (e.g., heart rate, contractility, loading conditions) (50) cannot be controlled for during a clinical application of the technique. Further, matching myocardial regions, for example, the subendocardial layer, for both rest and hyperemic condition may be difficult (since geometry of the heart is changing with changing heart rate, loading, etc.). And finally, to obtain accurate results for the CFR calculation, one must guarantee a linear relationship between MR parameters representing flow over a wide range of flow conditions (i.e., resting and hyperemic flow).
TECHNICAL ASPECTS OF MR PERFUSION IMAGING
NONCONTRAST MEDIUM-BASED APPROACHES
An elegant approach for perfusion measurements aims at exploiting the decrease in T2 relaxation time of deoxygenated and thus, paramagnetic hemoglobin (while oxygenated hemoglobin is slightly diamagnetic causing less of T2 shortening). With this blood oxygen level dependent (BOLD) method, a T2– or T2*-weighted pulse sequence allows for an estimation of an increased content of oxygenated blood, which is expected to occur in the presence of unrestricted hyperemic flow (which is associated with a lower O2 extraction). However, this approach is sensitive to magnetic field inhomogeneities and the robustness of the method is not yet demonstrated (51,52). Also, signal differences in normally perfused regions versus hyperemic regions (with a fourfold increase in flow) is as low as 32% in an experimental setting (53). This low signal difference might be problematic, since studies with CM first-pass approaches performed in humans showed differences in the order of 80% to 100% to be clinically inadequate while signal differences in the order of 250% to 300% were required for reliable detection of ischemic regions in patients (54). Another technique which also does not require the administration of exogenous CM is arterial spin labeling (55,56 and 57). This approach is based on T1 measurements after global and slice-selective spin preparation (using appropriate ECG-triggered pulse sequences). Due to the inflow of unsaturated proton spins, T1 in tissue is shortened after slice-selective preparation compared with global preparation. Assuming a two-compartment model absolute tissue perfusion is calculated. However, this concept is not yet well established for an application in humans. Magnetization transfer techniques are also under investigation to assess myocardial perfusion (58). A schematic of the various pulse sequences for perfusion assessment is given in Figure 15.1.
MAGNETIC RESONANCE PULSE SEQUENCES FOR CONTRAST MEDIA FIRST-PASS STUDIES
Most experience exists for the so-called CM first-pass approaches used for the detection of perfusion abnormalities. With this technique, a bolus of CM is injected into a peripheral vein and its effect on myocardial signal during hyperemia (stress-only protocol) and during resting conditions (stress-rest protocol) is monitored with fast MR pulse sequences. Common for all CM first-pass techniques either under development or in clinical routine are the requirements to (1) provide high spatial resolution to permit detection of small subendocardial perfusion deficits, (2) provide adequate cardiac coverage to allow for assessment of the extent of perfusion deficits, and (3) feature high CM sensitivity to generate optimum contrast between normally and abnormally perfused myocardium during CM first pass. Finally, acquisition of perfusion data should occur every 1 to 2 heartbeats to yield signal intensity—time curves of adequate temporal resolution which allow for extraction of various perfusion parameters (see below). To fulfill these requirements, speed of data acquisition and time-efficient magnetization preparation are crucial. Since passage of CM during hyperemic conditions only last 5 to 10 seconds, breathing motion is typically minimized by a breath-hold maneuver while cardiac motion is eliminated by ECG triggering. In contrast to scintigraphic techniques, this control of cardiac and breathing motion preserves the high spatial resolution of the MR perfusion data in the order of 1 to 3 × 1 to 3 mm. Most commonly used are the extravascular gadolinium chelates in combination with heavily T1-weighted pulse sequences. Signal increase in the myocardium during first-pass of these CM is dependent on both, perfusion of the myocardium and diffusion of CM into the interstitial space. Since these CM are excluded from the intracellular compartment, that is, of viable cells with intact cell membranes, a perfusion deficit during first pass can reflect either hypoperfused viable myocardium or scar tissue. Conversely, for scintigraphic techniques, the flow tracers are taken up by viable myocytes causing tracer accumulation, and consequently, an increase in signal (a schematic is given in Figure 15.2). In order to differentiate by MR imaging viable hypoperfused myocardium from scar, both demonstrating slow CM wash-in during MR first-pass studies, it is recommended to wait for establishment of equilibrium distribution of CM in the various compartments, that is, blood and extracellular, interstitial space (of viable myocardium and scar), which occurs within 10 to 20 minutes post-CM injection. During this condition, late enhancement imaging (with the inversion time set to null normal myocardium) displays hypoperfused but viable myocardium as dark tissue, while scar tissue appears bright (due to the high distribution volume of CM in the enlarged interstitial space of fibrous tissue). For comparison, during equilibrium distribution of scintigraphic tracers (occurring after
rest injection or rest re-injection) tracer is not taken up by scar tissue, which consequently appears as a cold spot, while viable tissue appears as a hot spot (see also Figure 15.2).
rest injection or rest re-injection) tracer is not taken up by scar tissue, which consequently appears as a cold spot, while viable tissue appears as a hot spot (see also Figure 15.2).
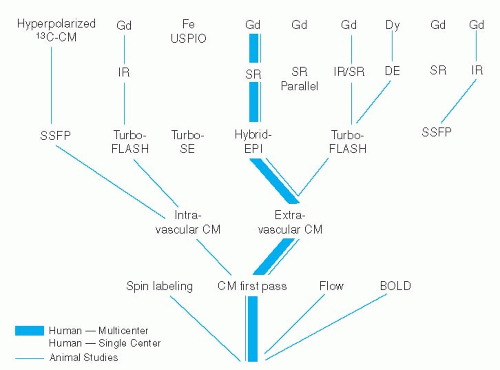 Figure 15.1. Overview on various strategies and pulse sequences aimed at perfusion imaging.The most frequently used contrast media combined with these pulse sequences are also mentioned. All approaches given in the figure have been reported for cardiac imaging except for hyperpolarized 13C-CM, which have only been used for cerebral perfusion imaging so far. BOLD, blood oxygen level dependent (imaging); CM, contrast medium; DE, driven equilibrium (yielding T2 weighting); Gd-chelate, gadolinium-chelate; EPI, echo-planar imaging; Fe, iron-based CM; FLASH, fast low-angle shot (imaging); IR, inversion recovery; SE, spin-echo; SR, saturation recovery; SSFP, steady-state free precession; USPIO, ultra-small paramagnetic iron oxide particle. |
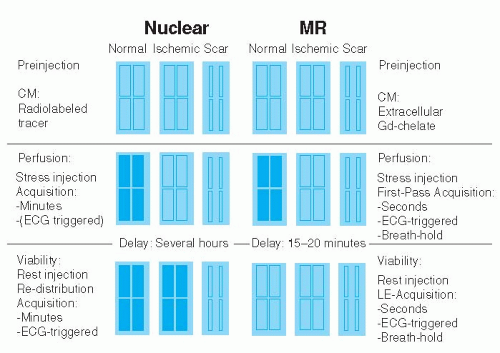 Figure 15.2. Mechanism for MR and scintigraphic assessment of perfusion and viability. Upper row: The three main conditions of myocardium are depicted before administration of contrast media (CM), that is, normal (nonischemic) myocardium, ischemic myocardium, and chronic scar tissue. Large rectangles represent intact myocytes and small rectangles represent fibrocytes (within large interstitial compartment). Middle row demonstrates perfusion assessment: Radiolabeled tracer is trapped within viable myocytes, less tracer accumulation occurs in hypoperfused, ischemic tissue (middle column), which appears as cold spot. For MR, in normally perfused myocardium, MR-CM accumulates in the extracellular compartment during first pass. In hypoperfused myocardium (middle column), wash-in kinetics are delayed. In hypoperfused scar tissue, negligible radiotracer and MR-CM accumulation occur. For viability assessment (bottom row), equilibrium distribution is required for both radiotracer and MR-CM. Fibrocytes do not accumulate radiotracer and scar appears as a cold spot (= fixed defect, see middle row). Ischemic myocardium with viable myocytes accumulates radiotracer yielding a hot spot (reversible defect, see above). For MR, distribution volume for MR-CM in scar tissue is large with consequent high concentration of MR-CM: Scar tissue appears bright on late enhancement MR imaging (with inversion time nulling viable myocardium).For MR imaging, the combined perfusion-viability study is short since equilibrium distribution is typically achieved within 15 to 20 minutes. Data acquisition by MR last a few seconds only, allowing to use breath-holding and ECG triggering, which preserves a high spatial resolution of perfusion data. |
MAGNETIZATION PREPARATION. In the beginning of firstpass perfusion-CMR imaging, a high contrast between abnormally and normally perfused myocardium during peak effect of bolus was achieved by preparing the myocardium by a 180-degree inversion pulse (IR technique). To obtain maximum contrast, the signal of precontrast myocardium was nulled by applying inversion recovery times in the order of 300 to 400 milliseconds (time from preparation to recovery, i.e., readout of central k-space lines: TPR) (59,60,61,62,63,64,65,66 and 67). However, combining this IR-preparation scheme with a turboFLASH (fast low-angle shot), readout resulted in long acquisition windows of 650 to 750 milliseconds per slice, which precludes the acquisition of multiple slices during 1 to 2 heartbeats. Partial preparation flip angles, for example, of 45 to 60 degrees were suggested which allow for shorter delay times (TPR) (68,69). However, this approach limited the dynamic range of signal response (54). Therefore, nowadays a saturation recovery preparation by a 90-degree pulse is typically applied, since it shortens the delay time TPR to 100 to 150 milliseconds (54), and additionally it renders the sequence heart rate independent. Simulations in Figure 15.3 demonstrate the influence of increasing TPR following a 90-degree preparation on signal response for a fast gradientecho pulse sequence (TR/TE: 5/1 milliseconds, r1 and r2* of CM is 4 and 6/mmol/sec, respectively). With increasing TPR the sensitivity of the pulse sequence for low CM concentrations increases, however, at the cost of reduced sensitivity of higher CM concentrations. In order to select the optimum TPR, not only the signal intensity—CM concentration relationship is important—but also the number of excitations required achieving steady state of magnetization. Further, TPR should result in acquisition windows which are placed within phases of minimal motion during the cardiac cycle. A TPR of 120 milliseconds in combination with a hybrid echoplanar readout scheme can result in an acquisition window as short as 240 milliseconds per slice (33). This combination avoids data acquisitions during rapid cardiac motion, that is, during early systole, early diastole, and late diastole (atrial contraction) over a wide range of heart rates which may occur during hyperemia. This very fast approach allows for multislice data acquisition, while preserving a high sampling rate. To speed up the acquisition, it was suggested to play out one single nonslice-selective 90-degree saturation pulse, and to acquire all slices in series thereafter (36). With this scheme, however, the delay time varies from slice to slice, and consequently, CM sensitivity becomes dependent upon
slice position, which potentially complicates data analysis. In a modified version of a saturation preparation, the entire myocardium is experiencing a 90-degree saturation pulse except that slice of tissue which is immediately imaged after preparation (70). With this scheme the time period for readout of slicen is utilized to prepare slicen+1 and so on, that is, the acquisition window equals the saturation recovery time. This approach allows acquisitions of up to seven slices every 2 heartbeats at heart rates below 115 beats per minute.
slice position, which potentially complicates data analysis. In a modified version of a saturation preparation, the entire myocardium is experiencing a 90-degree saturation pulse except that slice of tissue which is immediately imaged after preparation (70). With this scheme the time period for readout of slicen is utilized to prepare slicen+1 and so on, that is, the acquisition window equals the saturation recovery time. This approach allows acquisitions of up to seven slices every 2 heartbeats at heart rates below 115 beats per minute.
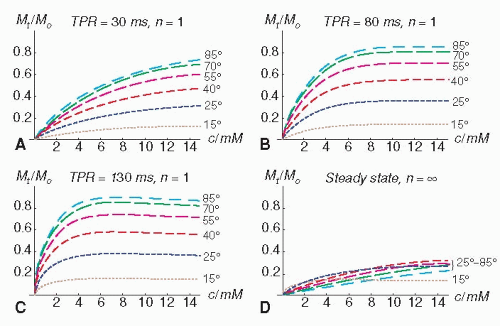 Figure 15.3. The simulations show the influence of the delay time between a 90-degree saturation recovery preparation pulse and readout (= time of preparation recovery: TPR) on the signal response (fast gradient-echo pulse sequence with TR/TE of 5/1 milliseconds) for various contrast medium (CM) concentrations c with r1 and r2 of 4 and 6/mmol/s, respectively (native T1 and T2: 1 second and 35 milliseconds). The signal-response curves are shown for the first TR period (n = 1; A–C) and for the steady state (n = ∞D). The read-out flip angles are 15, 25, 40, 55, 70, and 85 degrees (with dash lengths increasing with flip angle). The maximum signal and the sensitivity to changes of the CM concentration c at low concentrations increase with TPR (Figure 15.3A–C). At higher concentrations, however, c cannot be unambiguously inferred from the signal with increasing TPR (clipping of the signal, Figure 15.3B,C). The steady-state signal does no longer depend on details of the magnetization preparation (Figure 15.3D). |
MR DATA READOUT. Conventional TurboFlash pulse sequences were often used in the past for perfusion imaging. With this technique each k-line is preceded by a radiofrequency excitation, which results in a readout duration in the order of 350 to 450 milliseconds depending on the number of phase-encoding steps and duration of TR (59,60,61,62,63,64,65 and 66). Since this acquisition window is too long to allow for multislice imaging, faster echo-planar pulse sequences became popular (71,72 and 73), particularly when broken up in fewer lines per radiofrequency excitation, known as hybrid echo-planar pulse sequences (33,54,68,69). This technique reduces TE, and consequently, renders the sequence more robust with respect to potential susceptibility artifacts. With these accelerated pulse sequences several k-lines are acquired following one single radiofrequency excitation reducing the TR per k-line down to <2 milliseconds and consequently, reducing total acquisition window/slice substantially. Since fast imaging is inherently conflicting with lower signal-to-noise ratio, readout strategies during steady-state conditions of magnetization appear promising, since they preserve magnetization and thus, a high signal-to-noise ratio. This technique has been employed successfully in animal models for monitoring CM first pass through the myocardium (74). In a human volunteer study, however, ECG triggering was problematic as well as the presence of artifacts (banding artifact probably due to off-resonance) and a low signal increase (approximately 40% of baseline signal) (75). A high image quality, reflected by a substantial signal increase in the myocardium during first pass, appears crucial for reliable CAD detection, and even offsets some compromise in cardiac coverage (54). Nevertheless, improving cardiac coverage without the need to reduce spatial and temporal resolution would be beneficial, since extent of CAD correlates with outcome. Parallel imaging approaches can increase coverage without compromise in spatial and temporal resolution. In a recent study in human volunteers, the loss in signal-to-noise ratio given by g × vR (with g being the so-called geometry factor and R the accelerating factor) was compensated for by a longer TR (due to implementation of TSENSE, a modification of SENSE (76)) and increasing the readout flip angle from 20 to 30 degrees. This accelerated hybrid echo-planar saturation recovery technique yielded twice as many slices as obtained with the nonparallel approach, while signal-tonoise ratio improved by approximately 20% (77). Finally, even faster imaging is possible by exploiting correlations in k-space and time (k-t) combined with sensitivity encoding (78) yielding spatial resolutions of 1.4 × 1.4 mm2 with high diagnostic yield (79,80). This approach was recently used to acquire three-dimensional (3D) myocardial perfusion data at 3 T with a spatial resolution of 2.3 × 2.3 × 10 mm3 (16 slices) acquired within a 200-millisecond window (40). While a 3D acquisition might be advantageous with respect to SNR and registration during postprocessing, larger studies, ideally, multicenter trials would be needed to show an incremental benefit of these highly accelerated strategies versus conventional perfusion sequences.
IMAGING PARAMETERS AND MYOCARDIAL SIGNAL RESPONSE. The concept of CM first-pass perfusion imaging is based on the assumption that the CM administered intravenously is delivered to the myocardium in relation to tissue perfusion, and consequently, the relationship between signal intensity and CM concentration should be known. With fast gradient-echo pulse sequences the extravascular Gd-chelates typically show an increase in myocardial signal intensity up to a maximum (T1-dominated behavior), and signal decreases at higher CM concentrations (T2-dominated behavior). It is desirable that the pulse sequence applied shows a linear CM concentration — signal intensity relationship. This relationship is dependent on the type of pulse sequence and the imaging parameters such as magnetization preparation, delay time between preparation and readout (TPR), readout flip angle, k-space trajectories during readout, and others. The simulations in Figure 15.3 demonstrate that signal response is not only influenced by TPR, but also be the readout flip angle. During the readout period, all the curves shown in Figures 15.3A-C approach steadystate magnetization which yields the curves shown in Figure 15.3D. Varying signal responses for different TR periods, however, cause signal inhomogeneities in k-space, and thus, image artifacts. The simulations in Figure 15.4 show the course of signal response during successive TR periods in relation to TPR and readout flip angle. At higher flip angles (e.g., 55 degrees), the steady state is approached earlier (= 6 TR periods at a TPR of 130 milliseconds), while a shorter TPR of 11.6 milliseconds achieves steady state already after first TR. These considerations may illustrate that imaging parameters strongly affect signal response and should be optimized with respect to dynamic range of signal response, signal intensity-CM concentration relationship, homogeneity of signal in k-space, and timing of acquisition during the cardiac cycle. In a study in phantoms, it could be shown that optimization of a hybrid echo-planar pulse sequence (68) with respect to TPR, readout flip angle and preparation flip angle, improved signal response of Gd-DTPA-doped phantoms from 80% (of nondoped phantom) to 250%, which ultimately increased diagnostic performance in patients significantly (54). However, changes in these parameters typically go along with changes in the acquisition window/slice which can affect cardiac coverage.
Ideally, perfusion data would be evaluated by dedicated algorithms rather than by subjective reading (see below). This approach would allow comparing signal response in an individual patient with a normal database, which could render the technique less observer dependent. Such observer-independent comparisons with a normal database would require adaptation of normal values in case, the pulse sequence and/or imaging parameters had been changed. These technical considerations illustrate that myocardial signal response is strongly dependent on imaging parameters. Therefore, two important multicenter prospective trials (MR-IMPACT I and II) proved the high
diagnostic yield of pulse sequences being based on comparable sequence parameters implemented on various vendor platforms (12,44).
diagnostic yield of pulse sequences being based on comparable sequence parameters implemented on various vendor platforms (12,44).
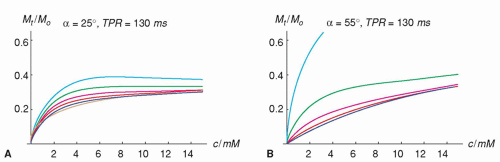 Figure 15.4. The simulations show the change in signal response for different TR periods, n. Signalresponse curves for every second of the first 64 TR periods are shown for two different flip angles 25 degrees and 55 degrees in A and B, respectively (other assumptions are as for simulations shown in Figure 15.3). Assuming ideal spoiling of transverse magnetization, the steady state is approached in earlier TR periods for higher flip angles. At 55 degrees, all signals acquired after approximately six dummy scans well match the steady-state signal, which results in a signal response that is homogenous in k-space. This could possibly reduce artifacts along the phase-encoding direction and keep their magnitude at a constant level for all contrast medium concentrations. In contrast, for a flip angle of 25 degrees and a delay time TPR of 130 milliseconds, the signal for different TR periods varies considerably. |
CONTRAST MEDIA
In MR first-pass perfusion imaging, an exogenous CM is administered into the circulation, in general into a peripheral vein. Myocardial signal changes induced by CM washin during first pass then reflect changes in the concentration of the CM and thus, are related to perfusion. However, the relation between signal change and change in CM concentration is complex. While conventional T1-shortening CM, such as extravascular Gd-chelates, induce a signal increase in normally perfused myocardium during first pass, other classes of extravascular CM, for example, T2*-shortening CM such as dysprosium chelates, induce a signal loss (Figure 15.5). Even Gd-chelates at higher concentrations can induce a signal decrease during first pass when combined with a T2-weighted sequence (81,82). Thus, the signal intensity-CM concentration relationship is typically nonlinear and can even be inverse depending on CM type, dose, and pulse sequences applied. This is fundamentally different from ischemia detection based on the assessment of wall motion, where a decrease in motion during inotropic stress unambiguously indicates the presence of ischemia.
T1-ENHANCING EXTRAVASCULAR CONTRAST MEDIA
These CM are most frequently used and represent the conventional extravascular Gd-chelates. Administration of these CM typically induce an increase in myocardial signal during first pass, which allows detection of hypoperfused myocardium as territories of lower signal by visual assessment, or by a quantitative approach extracting various parameters from the signal intensity-time curves (see below). Studies demonstrated a strong impact of maximum signal increase
in the myocardium achievable during first pass and diagnostic performance (54). Therefore, best test performance is expected for high CM doses (in combination with pulse sequences with strong T1 weighting), which provide a large dynamic range of signal response in the myocardium, that is, a large signal difference between normally perfused and hypoperfused territories. However, at higher CM doses, susceptibility artifacts may occur at the subendocardium, where differences in CM concentrations between blood and myocardium are particularly high during first pass. To optimize the CM dose (providing high signal increase in the myocardium without causing susceptibility artifacts in the subendocardium), several multicenter MR perfusion trials were performed. For strongly T1-weighted sequences, they showed absence of a susceptibility-induced signal drop in the subendocardial layer up to doses of 0.15 mmol/kg of a Gd-chelate (9).
in the myocardium achievable during first pass and diagnostic performance (54). Therefore, best test performance is expected for high CM doses (in combination with pulse sequences with strong T1 weighting), which provide a large dynamic range of signal response in the myocardium, that is, a large signal difference between normally perfused and hypoperfused territories. However, at higher CM doses, susceptibility artifacts may occur at the subendocardium, where differences in CM concentrations between blood and myocardium are particularly high during first pass. To optimize the CM dose (providing high signal increase in the myocardium without causing susceptibility artifacts in the subendocardium), several multicenter MR perfusion trials were performed. For strongly T1-weighted sequences, they showed absence of a susceptibility-induced signal drop in the subendocardial layer up to doses of 0.15 mmol/kg of a Gd-chelate (9).
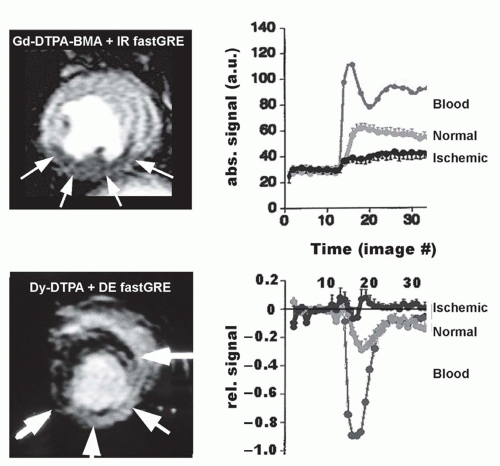 Figure 15.5. Effect of type of contrast medium and pulse sequence on signal response in blood and myocardium. Top row: A conventional extravascular gadolinium-chelate (Gd-DTPA-BMA) is administered in a dog model with critical stenosis of the left circumflex coronary artery during vasodilation (induced by dipyridamole). At the peak effect of the bolus (left), hypoperfused myocardium appears dark (arrows), normally perfused myocardium appears bright. The gray signal intensity-time curve on the right shows normal signal increase, the black curve shows delayed signal increase of hypoperfused myocardium. Bottom row: An extravascular dysprosium-chelate is applied to the same animal model. In combination with a T2-weighted (driven equilibrium) fast gradient-echo sequence, the CM induces a signal loss. Consequently, at the peak effect of the CM (left), the hypoperfused myocardium appears bright (arrows), normally perfused myocardium appears dark. Accordingly, the signal intensity-time curve of normal myocardium shows a signal drop (gray curve). (Images with courtesy of C.B. Higgins, MD, M. Saeed, PhD, and M. Wendland, PhD, from the University of California, San Francisco.) |
The safety of Gd-based CM when applied for stress perfusion CMR was recently reported from the European CMR registry (83). In 17,767 patients, no severe adverse event occurred. Thirty acute adverse reactions were observed (0.17%), all classified as mild according to the American College of Radiology definition (83).
INTRAVASCULAR CONTRAST MEDIA
T1-enhancing intravascular CM such as albumin-targeted MS-325 (69) or poly-lysine-Gd (84,85) have been applied in animal models. In these studies, differences (for group means) between normally perfused and stenosis-dependent, hypoperfused myocardium were reported. However, as to our knowledge, these intravascular Gd-based CM have not yet been tested in humans. Intravascular superparamagnetic iron oxide nanoparticles (USPIO) with a starch coating were used for perfusion studies in humans (86). In combination with a T2-weighted turbo spin-echo sequence, a signal drop in normal myocardium of 59% (in eight volunteers) was observed (this CM is no longer under investigation due to iron accumulation in the liver). Since susceptibility influences signal drop of T2*-enhancing CM, not only the concentration of CM in the voxel but also intravoxel distribution (homogeneous vs. inhomogeneous) determines its T2*-shortening effect, thus, rendering such an approach susceptible to vessel architecture (orientation, inter-vessel distance) within the myocardium. This principle was demonstrated with a dysprosium chelate in an elegant experimental model of reperfusion injury (87). Since T2* approaches are affected by these geometry factors (which are not known a priori), measurements of CM concentrations by T1 techniques are considered superior.
HYPERPOLARIZED CONTRAST MEDIA
Conventional Gd-chelates act by modulating the signal from surrounding water molecules by accelerating their relaxation rates. The low polarization level of the spin population of the NMR-active nuclei at the thermal equilibrium at a field strength of 1.5 T is compensated by the vast abundance of water molecules. One way to increase signal could be achieved by increasing the field strength, since the polarization level increases with magnetic flux density. Alternatively, however, the polarization level of the spin population of specific nuclei, such as liquid 13C in various compounds, can be increased by a factor of up to 100,000 compared with polarization of water protons at the thermal equilibrium by two techniques, that is, dynamic nuclear polarization (88) and parahydrogen-induced polarization (89). A major advantage of hyperpolarized 13C-CM is the fact that signal is only received from the 13C-nuclei, thus, no signal from background tissue is obtained. This theoretically allows for absolute quantification of perfusion, since signal is directly proportional to the amount of 13C-molecules (90). However, since the spin population of 13C-molecules is far away from thermal equilibrium, application of RF pulsing irreversibly destroys longitudinal magnetization. This means that CM depolarization must be taken into account similarly to radiotracer modeling which corrects for tracer decay. In addition, depolarization due to RF pulsing has to be considered, which is depending on the pulse sequence and the imaging parameters. Johansson et al. (91) showed that depolarization can be approximated by a monoexponential function with a time constant TD and successfully applied this concept for cerebral perfusion quantification.
ANALYSIS OF PERFUSION DATA
A variety of studies demonstrated visual assessment of myocardial CM wash-in kinetics to allow for the detection of hypoperfused myocardium supplied by stenosed coronary arteries (9,10,33,66,67,92


Stay updated, free articles. Join our Telegram channel
Full access? Get Clinical Tree
