Fig. 7.1
(a) Apical four chamber echocardiographic view in a 37 year old man with pericarditis revealing a large circumferential pericardial effusion. (b) Subcostal echocardiographic view in the same patient as in (a) with pericarditis again revealing a large circumferential pericardial effusion. Intrapericardial effusion stranding is noted (arrowheads). (c) Parasternal short axis echocardiographic view revealing the same large circumferential pericardial effusion
In spite of the ever increasing armamentarium of more detailed and sophisticated imaging modalities, chest x-ray (CXR) remains a simple, easy, and inexpensive imaging modality which invariably provides valuable information as the crucial first step in the differential diagnosis of pericardial diseases. Often, incidental pericardial findings are found on chest x-rays performed for unrelated reasons which spur further investigations. Occasionally, it is also useful in following the progression of the disease, and with its wide field of view may reveal additional mediastinal and pulmonary pathology.
Cardiac CT (CCT) has good spatial and temporal resolution, a wide field of view, and images that can be reconstructed for a particular view during post processing. It is the ideal technique for the evaluation of pericardial calcification and is very useful in preoperative planning. Although recent advances in scanner technology and software have significantly decreased the radiation exposure to patients undergoing CCT, the use of CCT exposes patients to ionizing radiation and iodinated contrast medium. In addition, functional evaluation is limited unless a retrospective study is performed, which is associated with a higher radiation dose than CCT studies acquired with prospective ECG gating. The newer generation CT scanners can now perform retrospective ECG gated cardiac studies using radiation doses lower than a typical dose of conventional chest CT. Performing CCT can be challenging in patients with irregular heart rates or those who are unable to lay flat or hold their breath.
Cardiovascular MR (CMR) is a valuable imaging tool—for both morphologic and functional assessments—to evaluate pericardial abnormalities. CMR has the advantages of being noninvasive and not exposing patients to ionizing radiation. In addition, CMR has good spatial resolution; can differentiate among types of soft tissue; has a wide field of view; and multiplanar imaging capabilities. These characteristics of CMR are useful in the evaluation of the pericardium, particularly for tissue characterization, assessment of inflammation, and to evaluate processes that may affect the myocardium. CMR is ideally suited for evaluation of small or loculated pericardial effusions, pericardial inflammation, and functional abnormalities caused by pericardial constriction and for characterization of pericardial masses. The wide field of view enables assessment of surrounding structures as well. However, acquiring good quality CMR images can be challenging, with prolonged study times, in patients with underlying cardiac arrhythmias and inability to co-operate during prolonged breath holding maneuvers. In the presence of significant arrhythmias, nongated CMR images can still provide valuable information about the underlying morphological and structural abnormalities. Until recently, CMR was contraindicated in patients with implanted cardiac devices. However, with newer devices and protocols based on device selection, appropriate programming, and monitoring, CMR can be performed in a safe fashion [1]. CMR is also not ideally suitable for the detection of calcifications [2, 3].
Normal Pericardial Anatomy
Pericardial Anatomy
The pericardium is an avascular flask-shaped fibrous sac which surrounds the heart and the origin of the large blood vessels, the ascending aorta, pulmonary artery, left pulmonary veins, and superior vena cava. It consists of two layers: the inner serosal layer and the outer fibrous pericardium. The inner serosal layer is further comprised of a visceral and parietal pericardium [4]. The parietal layer lines the inner surface of the fibrous pericardium to which it adheres, whereas the visceral layer envelops the epicardial surface of the heart, separated from it only by a layer of epicardial fat that contains the coronary vessels. In autopsy studies, the normal pericardium measures 0.4–1.0 mm in thickness [4]. A potential space separates the visceral and the parietal serosal layers and normally contains up to 50 ml of serous fluid distributed mostly over the atrioventricular and interventricular grooves. Like visceral abdominal fat, the thickness of the epicardial fat is generally increased in obesity. This epicardial fat distribution is typically asymmetric, with three to four times more epicardial fat present along the right ventricle (RV) than along the left border of the heart [5].
Appearance on Cardiac Imaging of the Normal Pericardium
CXR (Fig. 7.2)
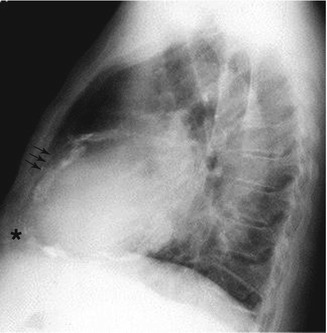
Fig. 7.2
Radiographic view from a lateral chest roentgenogram revealing calcified pericardium (arrows) on the anterior portion above the apex of the heart (asterisk)
The normal pericardium is frequently identified on a lateral plain chest radiograph as a thin, linear opacity between the anterior subxiphoid mediastinal fat and subepicardial fat [6]. In the posteroanterior (PA) view, the pericardium may be seen along the left heart border.
CCT (Figs. 7.3, 7.4, and 7.5)
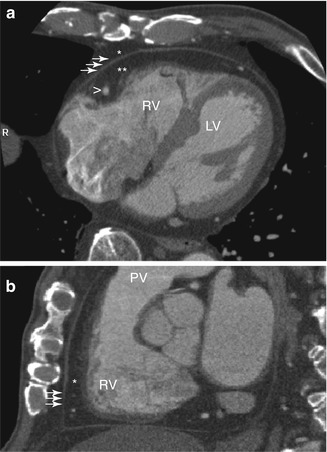
Fig. 7.3
(a) Transaxial CT tomogram of the heart in the horizontal long axis of the left ventricle (LV) at a level halfway between the cranial and caudal ends of the heart. Pericardium of normal thickness (arrows) is noted in the typical location over the free wall of the right ventricle (RV) between the subpericardial (double asterisk) and mediastinal (asterisk) layers of fat. Also noted in this image is the right coronary artery which courses within the subpericardial fat layer (arrowhead). (b) Sagittal CT tomogram of the heart in the short axis at the level of the mid portion of the RV. Normal thickness pericardium (arrows) is seen extending from near the diaphragm over the RV to above the level of the pulmonary valve (PV). The normal subpericardial layer of fat is also noted adjacent to the right ventricle (asterisk)
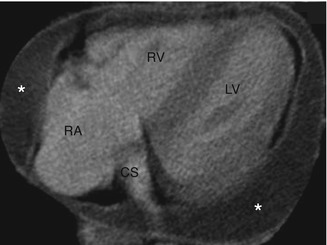
Fig. 7.4
Transaxial CT tomogram image of the heart at the level of the coronary sinus (CS). Water-density fluid (asterisk) is present posterior to the left ventricle (LV) and adjacent to the right atrium (RA) and right ventricle (RV), consistent with pericardial effusion separating the external fibrous and serous inner layers of the pericardium
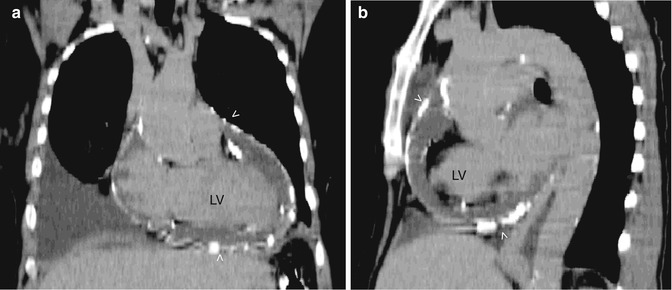
Fig. 7.5
Noncontrast CT tomogram in the coronal view (a) and sagital view (b) showing the left ventricle (LV). These views shows extensive calcification (arrowheads) of the pericardium in a patient with constrictive pericarditis
For pericardial imaging by means of CT equipped with multidetector technology, use of high-resolution volumetric acquisition with a section thickness >3 mm generally yields excellent anatomic depiction of the pericardium [7]. With CCT, the normal pericardium is best imaged in systole and appears as a line with an average thickness of 1.3–2.5 mm (almost always <4 mm; Fig. 7.3). The pericardium is a bright, linear structure that is easily detectable in both contrast- and noncontrast enhanced CCT examinations because of its visibility against the low attenuation of the surrounding epicardial fat [8–11]. Hence, visualization of the pericardium varies with location and amount of pericardial fat. It is sometimes difficult to visualize the pericardium against the lateral, posterior, and inferior left ventricular wall. Although dynamic evaluation of the ventricular septum to evaluate constrictive physiology is theoretically possible with ECG gated CT, real time functional imaging is much easier and more accurately assessed by using echocardiography or CMR [3].
CMR (Figs. 7.6, 7.7, 7.8, 7.9, and 7.10 and Table 7.1)
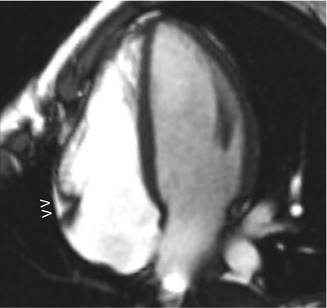
Fig. 7.6
Gradient echo MRI sequence in the horizontal long axis of the heart showing normal pericardium and minimal subpericardial fat in the right atrioventricular groove (arrowheads). Note that fat appears bright in this MRI sequence
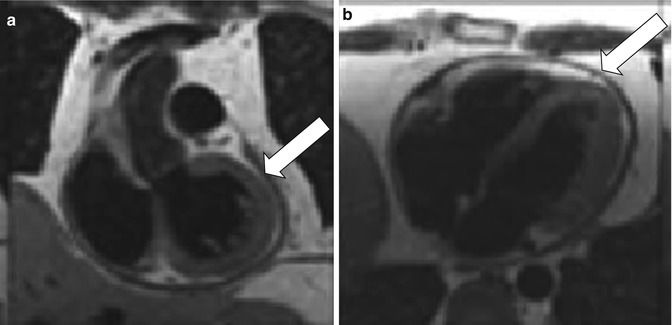
Fig. 7.7
Coronal (a) and axial (b) double inversion recovery spin echo MRI images of a patient with a history of pericarditis 4 months prior during a trip to Asia. The pericardial effusion was treated with anti-inflammatories and decreased in size, but the patient continued to have dyspnea on exertion and peripheral edema. The MRI shown revealed a remaining small pericardial effusion and diffusely thickened pericardium (arrows)
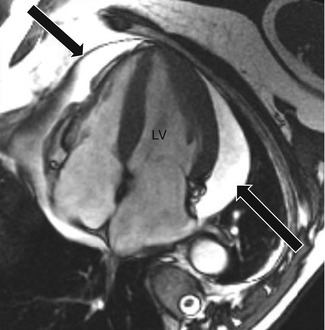
Fig. 7.8
Gradient echo MRI image of the heart in the horizontal long axis of the left ventricle (LV) noting a large predominately posteriorly-located pericardial effusion (arrows)
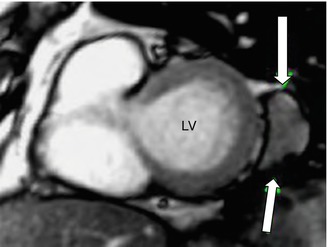
Fig. 7.9
Gradient echo MRI image of the heart in the short axis view of the left ventricle (LV) noting a loculated pericardial effusion adjacent to the lateral portion of the LV (arrows)
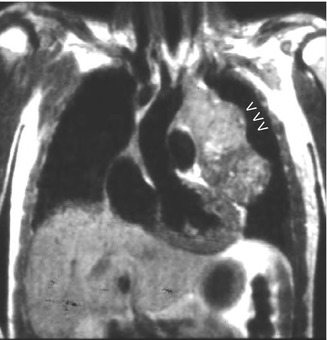
Fig. 7.10
Coronal MRI spin-echo sequence revealing a mass (arrowheads) contained within the pericardial space with a disordered and multi-signal appearance which was diagnosed as a pericardial fibrosarcoma
Target | MR sequences |
|---|---|
Pericardial width/localization/extent | T1 and T2 weighted imaging, cine imaging |
Pericardial delineation | T1 and T2 weighted imaging, cine imaging, gadolinium enhanced imaging |
Pericardial layer and fluid characterization | T1 and T2 weighted imaging, cine imaging, contrast agent enhanced T1-weighted or late gadolinium enhanced imaging |
Pericardial function | Cine imaging, myocardial tagging (to assess fusion of pericardial layers and adherence to myocardium) |
Pericardial masses | T1 and T2 weighted imaging, double inversion recovery with fat saturation, triple inversion recovery, cine imaging, late gadolinium enhanced imaging |
Cardiac morphology | T1 weighted imaging, cine imaging |
Ventricular size and shape | |
Myocardial morphpology | |
Cardiac systolic function | Cine imaging |
Regional and global systolic ventricular function | |
Cardiac filling (diastolic function) | Phase contrast |
Ventricular coupling | Real-time cine, phase contrast |
Ventricular septal shape | |
Septal motion patterns | |
Respiratory-related septal shift | |
Other findings | T1 and T2 weighted imaging, cine imaging, late gadolinium enhanced imaging |
Myocardial processes (myocarditis, myocardial infarction, myocardial infiltrative or storage disease) | |
Vena caval size | |
Mediastinal and pulmonary processes | |
Ascites and pleural fluid |
Normal pericardium is seen as a smooth, curvilinear structure that is surrounded by high-signal epicardial and mediastinal fat. The normal pericardium, composed primarily of fibrous tissues, has intermediate-to-low signal on T1- and T2-weighted black blood fast spin-echo (FSE) and steady-state free precession (SSFP) sequences [12] (Fig. 7.6). The two pericardial layers are not separately discerned. The presence of fat and fluid makes visualization of pericardium easier. Although the pericardium is prominently seen adjacent to the right ventricular free wall, right atrioventricular groove, inferior aspect of the left ventricle, and left ventricular apex, it is visualized less clearly adjacent to the lateral left ventricular wall because of the paucity of fat and low signal from adjacent lungs. On CMR, the normal pericardium measures 1.2 mm in diastole and 1.7 mm in systole [2]. The higher thickness of normal pericardium on MRI results from a combination of cardiac motion, low spatial resolution with partial volume averaging, and chemical-shift artifact. The normal pericardium does not have early or delayed contrast enhancement [2, 13].
Pericardial Pathology and Its Appearance on Cardiac Imaging
Pericardial Effusion
Asymptomatic pericardial effusions may be initially detected by chest radiography performed for other reasons. To augment the cardiac silhouette on chest x-ray, a minimum of about 250 ml of fluid collection is required, and consequently smaller effusions may be occult [14]. On CXR, a water-bottle configuration with generalized symmetric cardiac enlargement with increased cardiothoracic ratio may be seen [15]. However, on CXR, it may be difficult to distinguish this from cardiomyopathy. Occasionally, in patients with pericardial effusion, the “fat pad” sign, a soft tissue stripe >2 mm between the epicardial fat and the anterior mediastinal fat can be seen anterior to the heart on the lateral view [16]. Occasionally, serial studies can be done to aid in the diagnosis, especially if rapid changes in the size of the heart shadow are observed. Transthoracic echocardiography is the first line imaging modality to evaluate pericardial effusion (Fig. 7.1), based on some of the reasons mentioned earlier. However, CCT and CMR imaging are useful adjuncts to transthoracic echocardiography especially since they provide a wider field of view and facilitate a more comprehensive evaluation of pericardial effusions. These modalities are useful in detection of small loculated effusions, especially those in anterior locations. When echocardiography findings are inconclusive, CCT (Fig. 7.4) and CMR (Fig. 7.8) can better localize the effusions, and also help quantify the amount of accumulated fluid [2, 17, 18]. Although varying degrees of fluid collections can have certain characteristic patterns of fluid accumulation, since fluid does not spread homogeneously, there is no direct correlation between the thickness of the pericardial cavity and the actual volume of the accumulated fluid [19]. The volume of pericardial fluid can be quantified similar to quantification of ventricular volumes. In addition, epicardial fat is readily identified on CCT and CMR, which is especially useful when fibrin is adherent to the cardiac surface.
A limited characterization of pericardial fluid can be achieved on CCT by measuring attenuation values and on CMR by measuring signal intensity on MR images. CCT and CMR can also readily identify hemopericardium when it complicates aortic dissection, and thereby prevent inappropriate and potentially catastrophic pericardiocentesis [13, 20]. On CCT, pericardial fluid with attenuation close to that of water (<10 Hounsfield units) is likely to be a simple effusion, while attenuation value greater than that of water is more likely to be due to purulent exudate, malignancy, or related to hypothyroidism (20–60 Hounsfield units). Hemorrhagic collections have higher attenuation values (>60 Hounsfield units). Effusions with attenuation less than water have been reported with cases of chylopericardium (−60 to −80 Hounsfield units) [8, 9, 11]. On CMR, simple transudative effusions manifest with low signal intensity on T1-weighted images and high signal intensity on T2-weighted images. Complex effusions, such as exudative effusions with high protein and cell content, and hemorrhagic fluid, have high signal intensity on T1-weighted and intermediate signal on T2-weighted images [2, 8, 13]. However, sometimes because of motion artifacts, the characterization of the pericardial fluid is not always possible. Often, the use of bright-blood dynamic cine MR imaging facilitates the better visualization of intrapericardial contents, including coagulated blood and fibrinous strands, which are often found in loculated pericardial effusions.
Both CCT and CMR (Table 7.2) provide additional assessment of the pericardial layers, including thickness, composition and inflammation. In conditions like pericardial effusion secondary to malignancy, an irregularly thickened pericardium or pericardial nodularity may be seen on CMR images, further allowing the differentiation between simple pericardial effusions from inflammatory effusive pericarditis or malignant pericardial diseases [8, 10]. Sometimes, on CCT and CMR, differentiating a small pericardial effusion from a thickened pericardium can be difficult. However, certain features can help differentiate the two pathologies (Table 7.2). Additionally, since almost the entire chest is visualized during CCT or CMR, associated mediastinal and pulmonary abnormalities can also be detected during the examination.
Features | Effusion | Thickening |
|---|---|---|
Location | Follows distribution typical of effusion | Does not follow typical distribution, usually anteriorly located |
Decubitus position | Change in configuration with change in posture | No change in configuration with change in posture |
Margins | Smooth | Irregular or nodular with increased attenuation |
Contrast enhancement | Absent | May be present if associated with inflammation |
Tagging | Loss of tags with cardiac cycle | Myocardial tags persist throughout cardiac cycle |
CMR | ||
Dynamic changes | Mobility of fluid and changes in the regional dimension of the pericardial sac throughout the cardiac cycle | No mobile component and no changes in the regional dimension of the pericardial sac |
T1- and T2-weighted imaging | Signal void | Gray/dark (except in calcification) |
Steady state free precision imaging and gradient-echo sequences | High | Low |
Cardiac Tamponade
The diagnosis of acute life threatening cardiac tamponade is a clinical diagnosis, which is usually confirmed by emergent transthoracic echocardiography. Chest x-rays have a very limited role in the assessment of cardiac tamponade. Performing hemodynamic evaluation on imaging modalities such as CMR, which require relatively prolonged imaging times and patient cooperation, may not be appropriate for clinically unstable patients with suspected cardiac tamponade. However, when a loculated or complex effusion causes a subacute cardiac tamponade, CCT can provide valuable information to assess the feasibility of percutaneous versus surgical drainage. CMR can provide information regarding associated pericardial pathology, but is not the initial modality of choice in a clinically unstable patient. On CCT and CMR, the typical findings of cardiac tamponade include superior vena cava, inferior vena cava, and hepatic vein dilation, “diastolic inversion”, i.e. collapse of the right ventricle free wall in early diastole and collapse of the right atrium free wall during late diastole and early systole, “flattened heart” sign i.e. diminished anteroposterior diameter, and bowing or inversion of the interventricular septum, which correlates with the inspiratory septal bulge or bounce seen on echocardiography [2, 3, 8, 13]. Careful attention should be paid to differentiate cardiac tamponade from effusive-constrictive pericarditis. In effusive-constrictive pericarditis with associated effusion at presentation, the complaints are caused by a pathologic noncompliant pericardium rather than by the effusion itself. Thus, it is important to look for features of constriction, which can occur transiently in the resolution phase, after pericardiocentesis or with organized effusions.
Pericarditis
While the most common manifestation of pericarditis is its acute presentation, it may also present in subacute, recurrent, and chronic forms. The clinical symptoms depend on the severity of inflammation. In acute pericarditis, other than highlighting significant pericardial effusion, the chest x-ray may be fairly unremarkable. In chronic pericarditis, the x-ray may show any underlying pericardial calcification if present. While echocardiography is considered as the initial modality of choice to guide further diagnostic and therapeutic procedures, CCT and CMR can provide invaluable additional information, especially with regards to better pericardial tissue visualization and characterization. Delayed enhancement imaging using gadolinium can also assess for myocardial damage if associated myocarditis is suspected.
On CCT, noncalcified pericardial thickening associated with pericardial effusion is suggestive of acute pericarditis. With chronic forms of pericarditis, pericardial layers tend to be irregularly thickened and effusions may be loculated owing to the presence of adhesions. On contrast-enhanced CCT, diffuse enhancement of the thickened pericardium indicates inflammation [8, 11]. As discussed above, the CCT can also help characterize the associated pericardial effusion if present.
Similar to CCT, T1-weighted and bright-blood sequences can be used to identify underlying pericardial morphological features, associated pericardial effusion and adhesions. In addition, in equivocal cases, T2-weighted images and delayed gadolinium enhancement can be used to identify edema and inflammation of the inflamed pericardial layers [2, 8, 13]. This underlying edema and inflammation may extend to the adjacent myocardium or epicardial fat, and may be focal or diffuse. This pericardial enhancement on histological examination reflects inflammation, including edema, neovascularization, and granulation tissue formation [21]. It also correlates with elevated markers of inflammation [22, 23]. On T2-weighted images, the pericardial thickening has a grayish signal, while the effusion has a low signal. However, it is important to interpret the delayed gadolinium pericardial enhancement in the appropriate clinical context as this enhancement is nonspecific [2, 13, 24]. Sometimes, the pericardial and associated myocardial (myopericarditis) or epicardial fat enhancement may occur in the absence of associated pericardial thickening. In chronic pericarditis, the pericardium may be irregularly thickened and on delayed gadolinium enhancement variable contrast enhancement may be seen [2, 13, 22].
Stay updated, free articles. Join our Telegram channel

Full access? Get Clinical Tree


