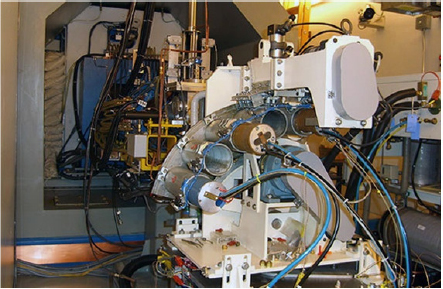
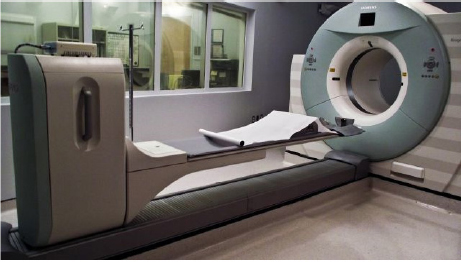
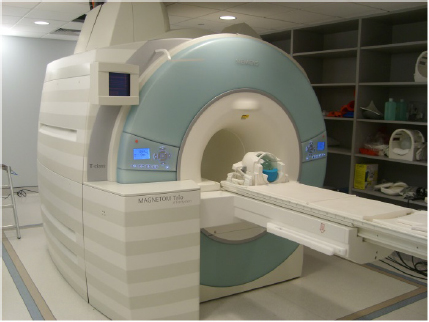
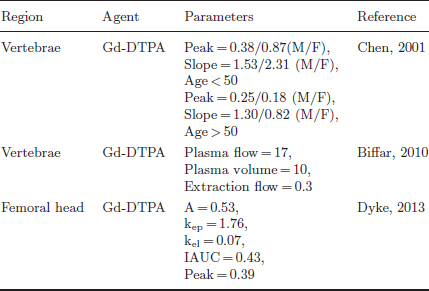
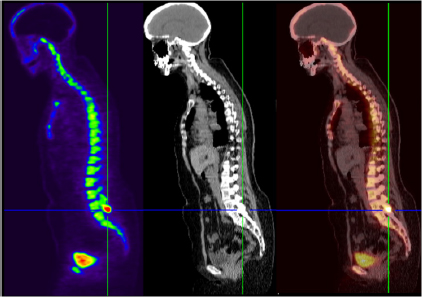
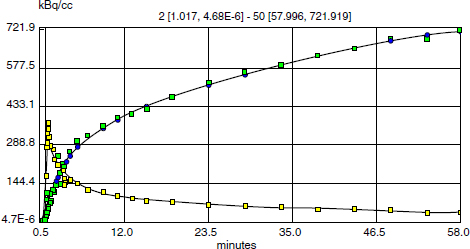
CHAPTER 6 Adequate perfusion in bone is critical to maintain proper oxygenation, delivery of nutrients, and elimination of waste. The ability of radiologic imaging to detect changes in bone vasculature and intraosseous perfusion through the use of exogenous contrast agents has been examined for over 40 years. Two-dimensional (2D) planar techniques of x-ray and fluoroscopic imaging, along with gamma camera-based techniques, have been used to assess changes in skeletal circulation in vivo. Several examples of this technology applied to osteoarthritis (OA) are given as a foundation to these 2D radiologic techniques. A study was performed on normal and OA hips using x-ray techniques.3 Measurement of intraosseous and intramedullary pressure, along with observation of contrast enhancement in the normal and OA femoral neck and head, was made. An increase in pressure and venous engorgement, seen as delayed drainage, was observed in OA bone using intraosseous phlebography and injection of iodinated contrast directly into the marrow cavity. Likewise, early gamma camera nuclear medicine studies were performed on OA and control hips to examine elimination of the radioisotope (131NaI) in the femoral head and neck.21 It was shown that the elimination rate in the femoral head of the OA-affected hip was reduced by 80% compared to that seen in control subjects. This showed the ability of radioisotopes to assess changes in skeletal circulation in vivo. Lastly, single photon emission computed tomography (SPECT) studies were performed on subjects with nodal OA using 99mTc-MDP.11 This study showed a high degree of sensitivity in detecting abnormal tracer uptake in OA. However, there was decreased specificity associated with 99mTc-MDP uptake that requires additional study of the mechanism behind the uptake of the tracer in vivo. These studies and others pioneered the use of 2D radiologic imaging in assessing skeletal circulation. Several emerging imaging modalities began to gain ground in the 1970s. X-ray computed tomography (CT) was introduced, providing rapid three-dimensional (3D) density-based assessment of osseous structures. While CT attained excellent resolution of extraosseous vasculature using iodinated contrast agents, it has not achieved the same sensitivity in assessing intraosseous perfusion. During that same period, the nuclear medicine-based technology of positron emission tomography (PET) was developed. PET is a 3D functional and metabolic imaging technique that detects uptake of various radiolabeled pharmaceuticals or tracers in vivo. The basic technique for PET scanning begins with a positron-emitting isotope that is typically created from a medical cyclotron but may also be eluted from an isotope generator. The cyclotron shown in Figure 6.1 accelerates protons that strike a target containing 18O-enriched water, to produce a neutron and 18F. Fig. 6.1. A 19.2 MeV proton-producing cyclotron showing the automated target-changing mechanism. Typically, the radioisotope is taken from the cyclotron area to a radiochemistry lab to bind the tracer with an amino acid or ligand specific to the disease or tissue to be studied. However, the 18F ion produced directly from the product of the 18O(p,n)18F reaction requires no further processing to create 18F-fluoride (sodium fluoride) which is the primary PET radioisotope used in imaging of skeletal circulation.18 This tracer is injected intravenously and taken up by tissues at a rate defined by the metabolism in the target of interest. In the case of 18F-fluoride, the tracer remains in the blood pool for approximately two minutes after which time it begins to bind with the hydroxyapatite in the bone matrix.18 Pharmacokinetic modeling of dynamic uptake data then produces estimates of bone blood flow, blood volume, and net fluoride influx rate. The tracer decays, emitting a positron (a positively charged electron) which decelerates in the tissue of interest and interacts with an electron. The annihilation of the e+e− pair produces two photons emitted almost back to back to each other. A ring of solid state scintillation detectors converts the photons into a burst of light on opposite sides of the ring. This results in a voltage in the photomultiplier tubes which is recorded as a coincidence event. In the clinic today, reconstruction algorithms employ a density-based attenuation correction provided by a simultaneously acquired CT scan. In practice, standalone PET scanners have been replaced by hybrid PET/CT scanners (Fig. 6.2). The PET scanner itself produces a metabolic image of the tracer uptake concentration that is fused to the CT scan. Fig. 6.2. A modern 64 slice PET/CT hybrid scanner allowing for rapid 3D imaging and dynamic acquisitions. Following close behind, magnetic resonance imaging (MRI) became clinically available in the mid-1980’s (Fig. 6.3). Using completely non-ionizing radiation in the spectrum of radio frequency (RF) waves, this modality produces the greatest soft tissue contrast available. However, as in PET, it also requires the use of exogenous contrast agents to assess perfusion in bone. MRI is the imaging extension of nuclear magnetic resonance (NMR) that was developed in the 1940’s for use in one-dimensional (1D) chemical spectroscopy. The main magnetic field in an MRI scanner contains a liquid helium-cooled super conducting magnet with a field strength of 3.0 tesla or 30,000 Gauss compared to the earth’s magnetic field of 0.5 gauss. The hydrogen atoms in tissue act as individual bar magnets or nuclear magnetic moments that precess with a known frequency in the magnetic field. A number of the hydrogen atoms preferentially align with the main magnetic field and are flipped into the perpendicular plane by an RF pulse at the Larmor frequency. Molecules then relax at different rates with the main magnetic field and with neighboring spins based on the structure and shielding of the compound. MRI relies on these differences in the relaxation times of molecules of the tissue of interest to produce image contrast. These differences in relaxation rates may be optimized by varying the timing of the MRI sequence parameters resulting in image weighting of specific contrast. Fig. 6.3. A 3.0 Tesla MRI scanner for use in focal or whole body imaging. Image co-registration algorithms are now available that allow for accurate fusion between modalities (MRI, PET/CT). This is of great value given that complementary information is obtained from both modalities providing a better and more complete understanding of the underlying mechanisms in skeletal circulation. For example, current PET/CT platforms allow for simultaneous acquisition and fusion of PET and CT image sets during a single imaging session (Fig. 6.4). Co-registration of MRI with PET/CT images also provides useful information on uptake of various MRI contrast agents that may be correlated with metabolic PET maps of bone perfusion. Historically, 2D radiologic techniques acquired planar images to assess tracer uptake in various phases of accumulation in bone. Recent advances in imaging hardware, computer processing, and memory capabilities now allow for rapid acquisition and reconstruction techniques that were not previously possible. This permits 3D dynamic uptake studies in both MRI and PET on a per voxel basis with high temporal resolution. Each voxel contains a unique time intensity (activity) curve that displays uptake of the contrast agent or tracer as a function of time. These curves may be fitted with pharmacokinetic models to produce estimates of various perfusion parameters characterizing skeletal circulation that may be correlated with various clinical and histologic markers (Fig. 6.5). The resulting fit parameters may be used to create parametric perfusion maps describing the blood pool phase or binding of the specific agent to the bone matrix. Fig. 6.4. A: 18F-fluoride PET scan shows uptake in bone and tumor. B: corresponding CT scan. C: fused PET/CT scan showing metabolic uptake in relation to anatomy. Dynamic acquisition allows more accurate characterization of bone perfusion than obtained at predefined static time points. Uptake characteristics of various tissues vary with their macroscopic vascular and microscopic angiogenic environments and may be monitored with 3D dynamic imaging techniques. The first clinically approved intravenous MRI contrast agent was Gd-DTPA (gadopentetatedimeglumine, Magnevist:Bayer-Schering Pharma) and was introduced in 1987. This agent is known as a small molecular contrast medium (SMCM) having a molecular weight of 538 daltons with distribution and elimination half-lives of 12 and 100 minutes in plasma respectively. Approximately 20–30% of clinically indicated MRI scans utilize an injection of a paramagnetic gadolinium-based contrast agent. It is used in both T1 and Fig. 6.5. Time activity curves showing 18F-fluoride PET uptake in the medial tibial plateau (green) and femoral artery (yellow) of a preclinical pig model of OA. The three-compartment pharmacokinetic model fit is shown in blue. A note should be included as to the current safety guidelines for use of gadolinium-based contrast agents in MRI. In 2006, it became known that gadolinium-based contrast agents (GBCAs) may be linked to the onset of a disease known as nephrogenic systemic fibrosis (NSF). Patients with compromised renal function or severe chronic kidney disease (CKD) may be at risk if proper clearance of the GBCA is not achieved. The risk occurs if the free gadolinium becomes unbound from the chelating agent. The American College of Radiology (ACR) and Food and Drug Administration (FDA) guidelines were immediately put into place to measure serum creatinine levels and to limit administration in patients with a glomerular filtration rate (GFR) <30 mL/min/1.73m2. A study was done at our combined university hospitals to assess the incidence of NSF over a ten-year period.31 There were no cases of NSF from a pool of 74,124 patients that received a standard dose of GBCA. In total, 15 patients receiving high doses of GBCA exhibited NSF, with all patients exhibiting an estimated GFR of less than 30 ml/min. Contrast uptake in bone as measured by dynamic contrast enhanced MRI (DCE-MRI) is dependent on many factors, including the degree of vascularity (angiogenesis), percentage of fatty and hematopoietic marrow, bone mineral density (BMD), and mechanical forces (pressure, stress, strain).19 Fatty (yellow) marrow contains sparse vasculature in contrast to hematopoietic (red) marrow which has a richer, arborized vascular component.5 Vascularity of both cortical and cancellous bone is also of great importance in designing and monitoring bone grafts.16 Maximum revascularization and angiogenic activity are required to promote remodeling and incorporation of the graft into its environment. T1-weighted DCE-MRI may be prescribed to quantitatively assess skeletal circulation in bone. Serum creatinine and GFR (>30 mL/min/1.73m2) should be calculated for each subject prior to imaging. Online GFR calculators are available from the National Kidney Disease Education Program as part of the NIH NIDDK Institute.2 Anatomic imaging and variable flip angle sequences should be run prior to injection for localization and T1 measurement. A 2D or 3D fast spoiled gradient echo sequence should be prescribed that repeatedly covers the area of interest in a temporal resolution of less than 10 seconds.1 The injection of a standard contrast dose (0.1 mmol/kg) into the right antecubital vein at a rate of 2–4 ml/sec should be performed after approximately 3–5 baseline images have been acquired. Fat suppression should be enabled in order to eliminate the signal from fatty marrow in normal bone that may conflict with the signal intensity of the contrast injection. Qualitative estimates of perfusion may be readily performed by measuring the initial uptake slope (%/min), % enhancement ratio, or peak enhancement and initial area under the curve (IAUC) (%·min). Various pharmacokinetic models are available to provide semi-quantitative estimates of skeletal circulation. The Brix 2 compartment model gives estimates of amplitude (A), transfer rate (kep, min−1), and elimination rate (kel, min−1) by fitting the time intensity curve (TIC) with a bi-exponential function.8, 35 Knowledge of the T1 relaxation rate prior to injection and choice of an arterial input function allows estimation of the permeability surface area product (Ktrans, min−1), kep, and the extravascular extracellular space (ve) via the Tofts-Kermode compartment model.35, 36 Although MRI acquisition techniques and contrast agents vary across institutions, there are estimates of normal and regional bone perfusion in the literature. Chen et al. measured DCE-MRI perfusion parameters in normal vertebrae and demonstrated perfusion differences with age and gender.9 The rate of peak enhancement with age was shown to decline faster in women than men. A study examined DCE-MRI uptake in the proximal femur in normal, osteopenic and osteoporotic subjects in conjunction with standard DEXA measurements of bone mineral density.27 A significant correlation was seen in reduced patterns of perfusion in subjects that exhibited a reduction in bone mineral density over time. Our group also measured DCE uptake in the normal and injured femoral head using a quadrant-based analysis.14
MRI AND PET
6.1 History of 2D Radiologic Imaging in Bone
6.2 3D Positron Emission Tomography (PET)/Computed Tomography (CT)
6.3 3D Magnetic Resonance Imaging (MRI)
6.4 Multi-Modality Image Registration
6.4.1 Static vs. dynamic imaging techniques
6.5 MRI Techniques
6.5.1 Choice of MRI contrast agent
 weighted scans to increase visibility of tumors (primary and metastatic), vascularity (cardiac, large vessels), infection, inflammation, blood brain barrier disruption, and stroke. Gd-DTPA is taken up by normal and pathologic bone and may be used to assess the degree of perfusion in vivo.
6.5.2 Physiologic factors affecting contrast uptake in MRI
6.5.3 MRI acquisition techniques
6.5.4 DCE-MRI analysis techniques
6.5.5 Normative DCE-MRI values in skeletal circulation
Stay updated, free articles. Join our Telegram channel

Full access? Get Clinical Tree


