MRI and CT of Thoracic Aorta


MRI and CT of Thoracic Aorta


Rossella Fattori

Vincenzo Russo


INTRODUCTION

In the past few years, considerable interest in aortic diseases has been shown in the medical literature. The prevalence of aortic disease appears to be increasing in the Western population, likely corresponding to aging of the population in addition to heightened clinical awareness. The continuous advances in our understanding of aortic pathology have been based on molecular and cellular studies elucidating the mechanisms of many pathologic conditions of the aorta and the complex interaction of this vessel with the cardiovascular system. However, increased clinical observation of aortic diseases, demonstrated in epidemiologic studies, and a more appropriate definition of its pathologic substrate, reported in recent literature, may also reflect concurrent outstanding progress in imaging techniques. Among the imaging modalities, MRI and CT offer the greatest versatility.

With its ability to delineate the intrinsic contrast between blood flow and vessel wall, and acquire images in multiple planes with a wide field of view, MRI provides a high degree of reliability in the diagnosis of aortic diseases, acute and chronic. MRI is totally noninvasive and can be repeated, so that the progression of the disease over the time can be evaluated. Functional information can be obtained by gradient-echo sequences and phase mapping, which quantify blood flow volume and velocity, so that our knowledge of aortic function can be expanded. The new MRA techniques have enhanced the noninvasive evaluation of vascular pathology, providing a high degree of spatial and contrast resolution and in many instances making invasive x-ray angiography an obsolete procedure for the detection of aortic diseases. In addition, the ability to differentiate tissue structures at a power of resolution in the order of micrometers provides an incomparable accuracy for the analysis of atherosclerotic plaque. At present, MRI microscopy, intravascular MRI, and spectroscopy are emerging techniques that will be used to understand atherosclerotic disease and its contributing pathogenic mechanisms more clearly.

Noninvasive vascular system imaging using computed tomography angiography (CTA) has become an important technique in the evaluation of vessels and has already been proven to yield high accuracy in the assessment of the thoracic-abdominal aortae and its major branches. Helical single detector CT (SDCT), introduced to clinical routine imaging in the early 1990s, revolutionized body imaging through the use of slip-ring technology, demonstrating its superiority over conventional angiography in different applications (1,2 and 3). It created volume acquisition of image data using continuous patient translation during gantry rotation. The advantage of three-dimensional (3D) dataset allows for visual vessel assessment from any angle and rapidly became a standard diagnostic tool for large vessel investigation. However, the visualization of small aortic branches and extended vascular territories has been limited due to the restricted volume coverage (20 to 30 cm in one breath-hold with moderate slice collimation). Another limitation of this technique was breathing and pulsation artifacts, due to the long scan time (often more than 30 seconds) and to the slow gantry rotation time (1 second), without any cardiac gating.


The development of multidetector-row CT (MDCT) in the late 1990s represented the most significant recent advancement in helical CT. Thinner collimations, faster gantry rotation times, large detector arrays, powered x-ray tubes, and increased table speed dramatically improved image quality and expanded the applications and indications of CT noninvasive vascular imaging. Multidetector CT angiography (MDCTA) provides a low-risk, efficient and cost-effective evaluation of the arterial vascular system, allowing greater vessel length and smaller diameter to be visualized. In a single study, information of the vessel lumen and wall may be obtained together with extravascular information (4).

Latest development of MDCT scanners, in the early 2000s, with the use of 8, 16, 32, or even 64 detectorrows or more, now give a submillimeter, isotropic 3D data acquisition of extended anatomical ranges, enabling highquality vascular imaging with 2D-3D artifact-free reconstructions from virtually any angle and in any desirable plane (5,6,7,8,9 and 10).


IMAGING TECHNIQUES


MRI TECHNIQUES


Spin-echo MRI

Conventional spin-echo T1-weighted imaging provides the best anatomic detail of the tissue of the aortic wall and is still the basis of any aortic study (11,12). With the spin-echo technique, a presaturation pulse is used to null the signal of the blood pool. The “signal void” produced by flowing blood throughout most of the cardiac cycles provides a natural contrast between the lumen and the layers of the vessel wall. Electrocardiographic (ECG) triggering is essential to minimize motion and pulsatility artifacts. An echo time (TE) of 20 to 30 milliseconds is standard, and the repetition time (TR) is determined from the R-R interval of the ECG. Slice thickness of 3 to 8 mm and high-resolution parameters (matrix size and signal average) ensure a detailed definition of the morphology of the aorta and surrounding structures. T1-weighted ECG-gated spin-echo images reveal the anatomic details of the aortic wall and pathologic conditions, such as atheromatous plaques, intimal flaps, or intramural hemorrhage (Fig. 32.1). In spin-echo imaging, each section corresponds to a different cardiac phase. Diastolic slow flow and entry or exit slice phenomena may produce high signal intensity in the aortic lumen that can mask underlying luminal pathology or erroneously simulate mural plaques or thrombosis. A shorter acquisition time can be achieved with fast spin-echo pulse sequences. In a fast spin-echo sequence, a long train of echoes is acquired by using a series of 180-degree radiofrequency (RF) pulses; as a result, washout effects are even more substantial than those obtained with conventional spin-echo techniques. A superior black blood effect is achieved by using preparatory pulses (13). Preparatory pulses such as presaturation, dephasing gradients, and preinversion pulses involve the application of one or more additional RF pulses outside the plane to suppress the signal intensity of in-flowing blood and nullify the blood signal. The replacement of conventional spin-echo sequences with fast spin-echo sequences has resulted in substantial saving of time and improvements of image quality. Conventional T2-weighted spin-echo sequences are of little utility in the study of the thoracic aorta. Because of the low signal-to-noise ratio and long acquisition time, image quality is affected, mainly by motion artifacts. On the contrary, with fast spin-echo techniques it is possible to obtain high-resolution T2-weighted images that provide a further option for evaluating the aortic wall. With a short acquisition time, respiratory motion can be suppressed using a breath-hold technique.


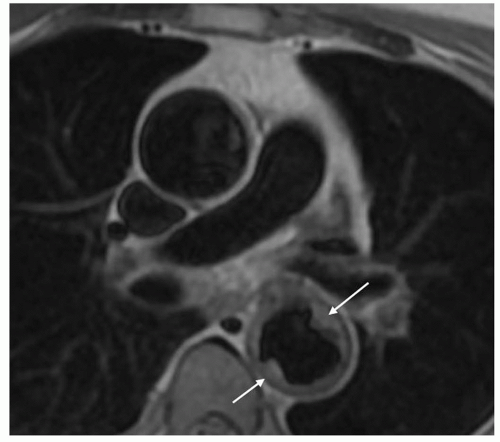
Figure 32.1. Fast spin-echo axial image of a large atheromatous plaque protruding in the aortic lumen of the descending aorta (arrows).

Usually, a conventional study of the thoracic aorta is first acquired in the axial plane (Table 32.1) for a display of the orientation of the great arteries and optimal visualization of mural lesions perpendicular to their long axes. Images in additional planes, depending on the anatomy and diagnostic problems, are then acquired; for example, the oblique sagittal view shows the entire extent of the thoracic aorta and supra-aortic vessels in a single image. Fast spin-echo sequences allow the acquisition of high-quality T2 images useful in tissue characterization of the aortic wall and blood components.


Gradient-echo MRI

Gradient-echo techniques provide dynamic and functional information, although with fewer details of the vessel wall. In gradient-echo imaging, data are acquired with monitoring of the ECG such that multiple images at the same slice are reconstructed to represent multiple phases of the cardiac cycle. The bright signal of the blood pool on gradient-echo images results from flow-related enhancement obtained by applying RF pulses to saturate a volume of tissue. With a short TR (20 to 40 milliseconds) and low flip angle (30 to 40 degrees), maximal signal is emitted by blood flowing in the voxel. An ECG signal is acquired with the imaging data
so that the images are reconstructed in the different phases of the cardiac cycle. Gradient-echo images are acquired with a high degree of temporal resolution throughout the cardiac cycle (8 to 16 frames per second) and can be displayed in cine format. Flow-related enhancement is produced by inflow of unsaturated blood exposed to only one RF pulse. As a result, the laminar-moving blood displays bright signal in contrast to stationary tissues. Signal can be reduced if the flow is low, as in aortic aneurysms. Mural thrombi can be identified by persistently low signal intensity in different phases of the cardiac cycle. Turbulent flow produces rapid spin dephasing and results in a signal void. This phenomenon makes it possible to detect anomalous turbulence, such as aortic or mitral insufficiency or jetlike communication between the true and the false lumen in aortic dissection. Despite the use of flow compensation, turbulent flow can be also observed in the normal aorta especially on the inner wall of the aortic arch. Recently, high performance gradient systems with even faster acquisition (TE, 2 to 3 milliseconds; TR, 4 to 8 milliseconds; flip angle, 20 degrees), have provided highquality images of the entire aorta at 15 to 25 different levels in less than 10 minutes. Gradient-echo images can provide additional information in many pathologic conditions such as coarctation, aortic valve insufficiency, and aortic aneurysm and dissection (14). Particularly, in aortic dissection the detection of entry and re-entry sites is a special capability of functional MRI that can be helpful in planning both surgical and endovascular therapy.


TABLE 32.1 General Strategy of MR Study of Thoracic Aorta


CONGENITAL ANOMALIES (COARCTATION, AORTIC ARCH ANOMALIES)


Spin-echo MRI


Axial (slice thickness 5-7 mm)


Sagittal (coarctation)


Coronal (aortic arch anomalies)


GRE/flow mapping (coarctation)


MRA


MARFAN SYNDROME


Spin-echo


Axial (slice thickness 5-7 mm)


Sagittal (slice thickness 3-5 mm)


GRE/flow mapping


Axial, ascending aorta (aortic distensibility)


CHRONIC AORTIC DISEASE (ANEURYSM, POSTOPERATIVE)


Spin-echo MRI


Sagittal (thoracic; slice thickness 3-7 mm)


Axial (region of interest, slice thickness 5-7 mm, black blood high-resolution parameters)


MRA (thoracic and abdominal)


ACUTE AORTIC DISEASE


Trauma spin-echo MRI


Sagittal (slice thickness 3-5 mm)


MR angiography (thoracic)


Dissection spin-echo MRI


Axial (slice thickness 7-10 mm)


Sagittal (slice thickness 3-5 mm)


GRE/flow mapping


Coronal (aortic valve, entry site)


MR angiography (thoracic and abdominal)


Flow Mapping

Gradient-echo imaging permits the semiquantitative measurement of flow turbulence by sizing the signal void in the heart chambers and great vessels. However, various imaging parameters can influence this measure and produce erroneous results. Accurate quantitative information on blood flow is obtained from modified gradient-echo sequences with parameter reconstruction from the phase rather than the amplitude of the MR signal, known as flow mapping or velocity-encoded cine MRI (15,16 and 17). Most of the MR methods of measuring flow velocity are based on the flow dependence of MR signal. In each pixel of velocity images, the phase of the signal is related to the velocity component in the direction of a bipolar velocity phase-encoding gradient. In the phase image, the velocity of blood flow can be determined for any site of the vascular system. Flow velocity is calculated using a formula in which velocity is proportional to change in phase angle of protons in motion. MR maps of flow velocity are obtained two dimensionally which is particularly important in profiles of nonuniform flow, such as that in the great vessels. On phase images, the gray value of a pixel depends on velocity and direction with respect to the imaging plane. Signals below a defined range are considered noise and are eliminated by a subtraction process. Quantitative data on flow velocity and flow volume are obtained from the velocity maps through a region of interest (ROI). The mean blood flow is estimated by multiplying the spatial mean velocity and the cross-sectional area of the vessel.

MR velocity mapping has been validated both in vivo and in vitro as an accurate technique for detection of flow pattern. The accurate analysis of aortic elastic properties provides specific information on alterations in aortic wall structure. Vector mapping has been used to describe flow patterns in physiologic conditions (e.g., patterns in the normal aorta as a function of age), and aortic diseases (e.g., Marfan syndrome, coarctation, hypertension, aneurysms, dissection) (18,19 and 20).


MRA

The “gold standard” for many manifestations of vascular disease, especially arterial occlusive disease, has long been considered catheter angiography, which is invasive, costly, and potentially hazardous procedure. MRA may represent an alternative, noninvasive approach. A variety of MRA techniques including various pulse sequences, methods of data acquisition, and postprocessing have been developed (21).

Bright blood techniques, which constitute the basis of MRA, can be subcategorized into time-of-flight (TOF) and phase-contrast (PC) techniques. All bright blood MRA techniques rely on the visualization of flowing blood for luminal imaging of the vessel. The essence of MRA is the ability to portray blood vessels in a projective format similar to conventional angiography, with the use of postprocessing methods, such as the maximum intensity projection (MIP) algorithm. In a MIP algorithm, the brightest pixels along a user-defined direction are extracted to create a projection image. In the TOF method, flow signal is enhanced by inflow effects, whereas the background (stationary tissue)
is saturated by the rapid repeated application of RF pulses. To provide a flow signal before phase dispersion, the TE is kept very short (<10 milliseconds) and the 180-degree refocusing pulse is eliminated. Fresh blood flowing into the plane of imaging produces a bright signal in a dark background. Venous signal, which can confuse the arterial image, can be eliminated with presaturation pulses. The use of a segmented gradient-echo sequence with cardiac triggering is helpful to eliminate arterial pulsation artifacts. TOF images can be acquired in two-dimensional (2D) or 3D fashion. Two-dimensional TOF imaging is very fast but poor in resolution, whereas high-resolution 3D images require 10 to 20 minutes of acquisition time. The advantages of both 2D and 3D techniques are gained with a series of thin-slab 3D acquisitions. The sequential 3D (multiple overlapping thinslab acquisition [MOTSA]) technique provides better flow enhancement than single-slab 3D techniques and causes less dephasing than 2D techniques. However, with sequential 2D or 3D acquisitions, even slight movement by the patient can generate discontinuities in the vessel contour.

The basis for PC-MRA is that the flow of blood along a magnetic field gradient causes a shift in the phase of the MR signal. In this technique, information about flow direction and velocity are encoded in the image data set. With PC, pairs of images are acquired that have different sensitivities to flow. These are then subtracted to cancel background signal, so that only signal from flowing blood is left. PC-MRA requires a determination of the range of velocities in the vessel of interest and this information strongly affects the image quality. In patients with aneurysm or dissection with nonlaminar turbulent flow, this technique is often not effective.

The recent implementation of faster gradient systems has made possible the development of 3D contrast-enhanced MRA (22,23,24,25,26,27 and 28) in which bright blood images are not strictly dependent on blood flow. Gadolinium diethylenetriamine pentaacetic acid (Gd-DTPA) is infused during data acquisition. The technique relies on the contrast-induced T1-shortening effects of the contrast medium, and saturation problems with slow flow or turbulence-induced signal voids are avoided. During the short intravascular phase, the paramagnetic contrast agent provides signal in the arterial or venous system, enhancing the vessel-to-background contrast-to-noise ratio irrespective of flow patterns and velocity. Flow-induced artifacts are mostly eliminated. Pulsatility artifacts are minimized, even in ascending aorta and ECG gating is not required. Contrast-enhanced MR aortography is performed following acquisition of axial localizer images to determine the maximum anterior and posterior extension of the thoracic and abdominal aortae as well as the left and right border. If the main area of interest is limited to the thoracic aorta, a sagittal acquisition is advisable. The paramagnetic contrast agent (0.2 mmol/kg of bodyweight) is generally administered via an intravenous catheter placed into the antecubital vein. It is necessary to time the gadolinium bolus so that the peak enhancement occurs during the middle of MR acquisition. The flow rate should be adjusted to ensure that the contrast volume is injected in a period not exceeding the acquisition time. Imperfectly timed acquisition can result in variable degrees of venous enhancement in the MR aortogram. Improved gradient systems allow a considerable reduction of the minimum TRs and TEs and the acquisition of complex 3D data sets within a breath-hold interval under 30 seconds. With the support of MIP images and of the 3D multiplanar reformation (MPR), this technique delineates all the morphologic details of the aorta and its side branches in any plane in a 3D format (Figs. 32.2 and 32.3).
Ultrafast 3D acquisition in conjunction with fast table feeds also makes it possible to chase the contrast bolus through several vascular districts. Since aortic aneurysm and dissection are mainly related to atherosclerotic vascular disease, a noninvasive concomitant assessment of the entire vascular system is advisable before surgical planning.


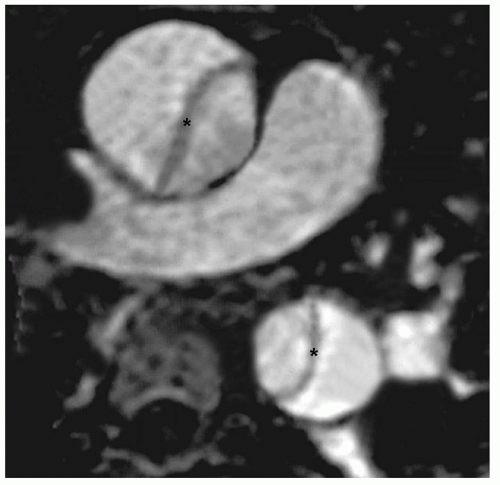
Figure 32.2. Gadolinium-enhanced MRA in a patient with type A dissection (maximum intensity projection algorithm). The intimal flap is visible in both, the ascending and descending aorta (asterisk).


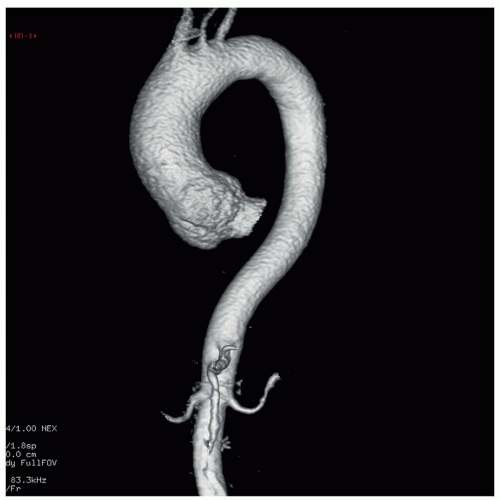
Figure 32.3. Gadolinium-enhanced 3D MRA of the thoracic aorta (surface-shaded display algorithm).


TABLE 32.2 Example of SDCT and MDCT Scan Protocols in Aortic Evaluation


Features


SDCT


4-DCT


8-DCT


8-DCT


16-DCT


16-DCT


64-DCT


Number of detectors


1


4


8


8


16


16


64


Collimation


1 × 10 mm


4 × 2.5 mm


8 × 1.25 mm


8 × 2.5 mm


16 × 0.75 mm


16 × 1.5 mm


64 × 0.6 mm


Gantry rotation


1,000 ms


500 ms


500 ms


500 ms


375 ms


375 ms


330 ms


Tube voltage


120 kV


100-120 kV


100-120 kV


100-120 kV


120 kV


120 kV


120 KV


Table feed


10 mm/s


20 mm/s


20 mm/s


40 mm/s


32 mm/s


64 mm/s


116 mm/s


Slice thickness


10 mm


3 mm


1.25 mm


2.5 mm


1 mm


2 mm


0.75 mm


Increment


5 mm


1.5 mm


0.6 mm


1.25 mm


0.5 mm


1 mm


0.4 mm


Acquisition time


30-70 s


15-35 s


15-35 s


8-18 s


10-22 s


5-11 s


2.5-6 s


Calculated for a scan range of 300 to 700 mm, with pitch factor 1. SDCT, single-detector CT; MDCT, multidetector CT (number of detector CT).


Noncontrast MRA

Noncontrast MRA techniques are increasingly applied, stimulated by concerns over the safety of gadolinium-based contrast in patients at risk for renal insufficiency or nephrogenic systemic fibrosis. One of the most employed is the balanced steady-state free precession (SSFP) MRA, also known as FIESTA (fast imaging employing steady-state acquisition), balanced FFE (fast field-echo), TrueFISP (fast imaging with steady-state precession), and TrueSSFP, which is a gradient-echo- based sequence that maintains steady-state longitudinal and transverse magnetization by applying a series of equidistant RF pulses (29,30). With this technique, image contrast is determined by T2/T1 ratios, which leads to inherently bright blood images with little dependence upon blood inflow (29,30 and 31). Three-dimensional acquisition is used to produce angiographic images with a high signal-to-noise ratio.

The major advantages of SSFP angiography are the short acquisition times and the high signal-to-noise ratio (30). In addition, SSFP angiography with 3D acquisition is relatively independent of flow, including flow direction, because it is fully flow compensated in all three directions (29,30 and 31). However, background signals, which interfere with exclusive detection of vessels, are abundant, and arteries and veins give high signal intensity (31). Therefore, additional preparatory pulses, including T2 preparation pulses to suppress myocardial and venous signals or arterial spin labeling (31), are needed to selectively enhance arteries. Otherwise, postprocessing is needed to remove additional background signals.


CT TECHNIQUES


Technique

Unlike its single-detector predecessor, MDCT permits increased longitudinal volume coverage and spatial resolution (5,32,33,34 and 35). The basic advantage of MDCT is the simultaneous acquisition of multiple parallel slices with each gantry rotation, instead of a single slice per rotation as generated by SDCT (32,36,37). The increased number of slices per rotation, combined with a faster gantry rotation time allows shorter scan time, wider volume coverage, and thinner collimation. Compared with 1-second rotation SDCT scanner, MDCT technique allows for up to 40 times faster data acquisition. Today, a very high-quality submillimeter scanning of the whole thoracic-abdominal vasculature has become possible within comfortable breath-hold duration. An example of the differences between SDCT and MDCT scan protocols is showed in Table 32.2.

Another very important feature of MDCT is the capability to have an ECG gating of the scan sequence (35,38,39). This mark permits to synchronize cardiac and thoracic vascular data acquisitions to the phase of least cardiac and arterial systolic motion achieving a reasonable temporal resolution which minimizes any motion artifact, especially in the ascending aorta.

Unlike MRI techniques, CTA scan sequences are mostly just two: Precontrast sequence and contrast-enhanced sequence; sometimes in CTA it is mandatory to perform a delayed acquisition after the arterial phase, useful for slow blood flow like in dissection, inflammation, or after surgical-endovascular aortic repair (leakage).

However, constant high image quality in CTA requires an adaptation of scan parameters as well as the contrast injection regimen, to simultaneously ensure high spatial resolution and high signal within the vessel of interest.

Radiation dose can be adjusted to the body contour and to the phase of the cardiac cycle and is up to four times lower than conventional digital subtraction angiography (DSA) (40).


Contrast Injection

While in nonvascular MDCT imaging, contrast application has not changed dramatically, in MDCTA with faster data acquisition, contrast agent delivery becomes more critical. The principal factors influencing contrast bolus geometry (Table 32.3) are contrast bolus timing, iodine concentration of contrast agent (mgI/mL), injection rate (mL/s), and saline chaser (41). The timing of the contrast delivery is the major issue in CTA. Although diagnostically adequate
enhancement has been reported using a standard (empirical) start delay (42), individual tailoring of the bolus injection is required in order to maximize arterial enhancement in differences of circulation time (43,44). This can be performed either by test bolus acquisitions or by bolus tracking algorithm sequences. The first technique requires an additional injection of a small contrast volume (10 to 20 mL) before the acquisition of CTA data, followed by the use of the same injection parameters. Bolus tracking modality permits the initial injection of the whole contrast agent volume, while the start of data acquisition is triggered by an automated detection of the contrast bolus arrival, using preconfigured trigger thresholds. An ROI is placed into the target vessel and the attenuation level (expressed in Hounsfield unit) is monitored within the ROI in real time during a single-level dynamic scan.


TABLE 32.3 SDCT and MDCT Contrast Injection Parameters in Study of the Aorta


Features


SDCT


4-DCT


8-DCT


16-DCT


64-DCT


Collimation


1 × 10 mm


4 × 2.5 mm


8 × 1.25 mm


16 × 0.75 mm


64 × 0.6 mm


Table feed


10 mm/s


20 mm/s


20 mm/s


32 mm/s


116 mm/s


Contrast volume


120-180 mL


100-140 mL


100-140 mL


80-100 mL


60-80 mL


Injection rate


2 mL/s


3 mL/s


3 mL/s


4 mL/s


5 mL/s


Injection time


60-90 s


30-45 s


30-45 s


20-25 s


12-16 s


Iodine concentration


200-250 mgI/mL


250-300 mgI/mL


250-300 mgI/mL


300-350 mgI/mL


350-400 mgI/mL


Bolus chaser


40 mL; 3 mL/s


40 mL; 3 mL/s


50 mL; 4 mL/s


50 mL; 5 mL/s


Total injection time


60-90 s


45-60 s


45-60 s


32-38 s


22-26 s


Acquisition time


30-70 s


15-35 s


15-35 s


10-22 s


2.5-6 s


Acquisition delay


30 s


25-30 s


25-30 s


Bolus triggered


Bolus triggered


Calculated for a scan range of 300 to 700 mm, with pitch factor 1.


Because of the fast scan time of MDCT, the delay between injection and scan start generally needs to be extended, so that the scan does not outrun the contrast material bolus (45). Shorter acquisition time also allows a reduction of the contrast agent volume and higher flow rates, even if a more concentrated solution often must be used, together with a saline chaser to compact the bolus and to push it toward the right atrium by the use of dual syringe CT injectors (6,40,46,47).


Postprocessing

Acquisitions are exclusively in axial plane; other planes are reconstructed from the scanned volume by multiplanar reconstruction (MPR) and with MDCT are as clear as a multiplanar acquisition due to the isotropic 3D data scan.

In the evaluation of aortic diseases other frequently used postprocessing techniques are curved MPR (CMPR), MIP, shaded surface display (SSD), and volume rendering (VR) (7,48,49). MPR re-format image datasets to alternate 2D planes, in general, sagittal, coronal, or oblique. However, with thinner slice the aorta is not completely visualized in a single image, due to the aortic curvature that cannot be reduced to any single plane. Moreover, with modern software it is possible to thicken any selected plane (MPR thick) and look at the entire vessel. Curved MPR is an extension of this feature that displays a curved plane traced along aortic contour, thus is possible to have the entire vessel midline on a single 2D image. MIP is a technique closer to DSA; it shows aortic opacification and caliber, but may provide only endoluminal information. Like a threshold technique, density values below that of contrast such as plaques or thrombus and above that of contrast such calcifications are difficult to discriminate; MIP images will not allow depth perception or understanding of interstructural relationships. SSD provides a good overall view of aortic anatomy but does not provide internal detail, can overestimate vessel stenoses and is also a threshold technique. VR is the latest and most powerful method for 3D reconstruction. With high fidelity to the original dataset all tissues are represented based on their Hounsfield values so that, unlike a threshold technique, simultaneous depiction of different kind of tissues is possible in 3D projection. With this feature, combined with adequate filters, metallic stents or surgical clips do not present a problem and both calcifications and thrombus can be discriminated from the vessel lumen.


ACQUIRED DISEASES OF THE THORACIC AORTA


AORTIC DISSECTION

Aortic dissection is characterized by a laceration of the aortic intima and inner layer of the aortic media that allows blood to course through a false lumen in the outer third of the media. Dissection can occur throughout the length of the aorta and the two most common classifications are based on the anatomic location and extension of intimal flap. According to the De Bakey classification, in type I dissection the intimal tear originates in the ascending aorta and the intimal flap extends below the origin of the left subclavian artery; type II dissection is confined to the ascending aorta; and in type III dissection the entry tear develops after the origin of the subclavian artery and extends distally. The Stanford classification simply classifies an aortic dissection irrespective of the site of the entry tear as type A, if the ascending aorta is involved, and as type B if the ascending aorta is spared. The Stanford classification is fundamentally based on prognostic factors: Type A dissection requires
urgent surgical repair whereas most of type B dissections can be successfully managed with medical therapy.


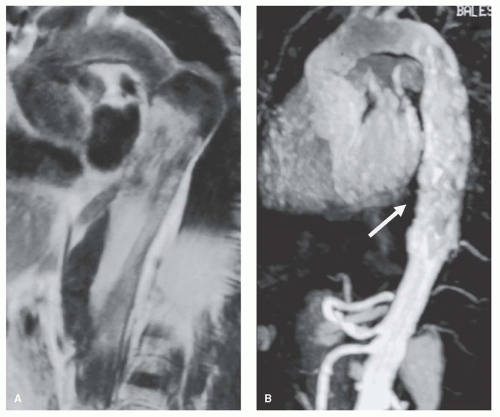
Figure 32.4. A: Spin-echo sagittal image of type B dissection: The double aortic lumen is 4 cm below the left subclavian artery. The false lumen (high signal intensity) is severely dilated. B: MRA of the same patient after stent graft treatment (arrow): Aortic remodeling with complete thrombosis of the false lumen. The metallic structure of the stent graft produces minimal artifacts in the upper portion of the descending aorta.

Acute aortic dissection is a life-threatening condition requiring prompt diagnosis and treatment (50). The 14-day period after onset has been designated as an acute phase because the rates of morbidity and mortality are highest during this period. The estimated mortality rate of untreated aortic dissection is 1% to 2% per hour in the first 24 hours after onset and 80% within 2 weeks. Early and accurate detection of the dissection and a delineation of its anatomic details are critical for successful management. However, because physical findings may be absent or misleading and symptoms may mimic those of other disorders, such as myocardial ischemia and stroke, the diagnosis of aortic dissection is often missed at initial evaluation (51,52). The anatomic characteristics of the dissection indicate the type of surgical technique, and affect both the surgical success rate and long-term results. Thus, in dissection, the diagnostic goal, regardless the imaging modality, used a clear delineation not only of the intimal flap and its extension but also detection of the entry and re-entry sites, presence and degree of aortic insufficiency, and flow in the aortic branches (53). Transcatheter endovascular reconstruction of type B aortic dissection is a new option for the treatment of both acute and chronic dissections (54,55). In endovascular techniques, the success of the procedure is strictly related to a detailed anatomic definition of the features of the dissected aorta. The identification of the entry and re-entry sites, the relationship between true and false lumina and the visceral vessels, and any involvement of the iliac arteries are crucial in patient selection and stent-graft design (Fig. 32.4).


MRI Technique and Findings

In a suspected case of aortic dissection, the standard examination should begin with spin-echo sequences acquired with high-resolution parameters and preparatory pulses to nullify the blood signal and obtain a better definition of the aortic wall structures (Table 32.4). In the axial plane the intimal flap is detected as a straight linear image inside the aortic lumen. The true lumen can be differentiated from the false by the anatomic features and flow pattern. The true lumen shows a signal void, whereas the false lumen has a higher signal intensity. In addition, the visualization of remnants of the dissected media as cobwebs adjacent to the outer wall of the lumen may help to identify the false lumen. The leakage of blood from the descending aorta into the periaortic space, which can appear with high signal intensity and result in a left-sided pleural effusion, is usually better visualized on axial images. A high signal intensity of a pericardial effusion indicates a bloody component and is considered a sign of impending rupture of the ascending aorta into the pericardial space. A detailed anatomic map of aortic dissection must indicate the type and extension of dissection but also distinguish the origin and perfusion of branch vessels (arch branches, celiac, superior mesenteric, renal arteries and coronary arteries) from the true or false channels. Therefore, a further spin-echo sequence on the sagittal plane should be performed to define the extension of the dissection in the thoracic and abdominal aortae and in the aortic arch branches (Fig. 32.5).

Adjunctive gradient-echo sequences or phase-contrast images can be instrumental in identifying aortic insufficiency and entry or re-entry sites (Fig. 32.6), as well as in differentiating

slow flow from thrombus in the false lumen (56,57). However, because the diagnosis of aortic dissection is not dependent on functional gradient-echo images, these sequences should be reserved to clinically stable patients.


TABLE 32.4 MR Study Modality in Acute Aortic Syndromes


Sequence/Plane


Diagnostic Findings


Anatomic Details


AORTIC DISSECTION


Spin-echo axial/sagittal


Intimal flap/true-false lumen


Periaortic hematoma Pericardial effusion


Gradient-echo axial/sagittal


Intimal flap/true-false lumen Aortic insufficiency


Thrombosis false lumen/entry and re-entry sites


MR angiography


Intimal flap/true-false lumen


Origin/perfusion of supra-aortic, coronary, abdominal vessels


INTRAMURAL HEMATOMA


Spin-echo axial/sagittal, T1-weighted


Abnormal wall thickness, crescent shape. High signal intensity (T1)


Periaortic hematoma Pericardial effusion


Spin-echo axial, T2-weighted


High signal intensity (recent) Low signal intensity (old)


Pericardial, pleural, mediastinal effusion: Increased signal intensity


MR angiography


No utility


PENETRATING AORTIC ULCER


Spin-echo axial/sagittal


Craterlike outpouching/circumscribed dissection/intramural hemorrhage


Periaortic hematoma/pleural effusion Diffuse aortic wall atherosclerosis


Gradient-echo sagittal


No utility


MR angiography


Craterlike outpouching/saccular pseudoaneurysm


Relationship with aortic arch or abdominal vessels


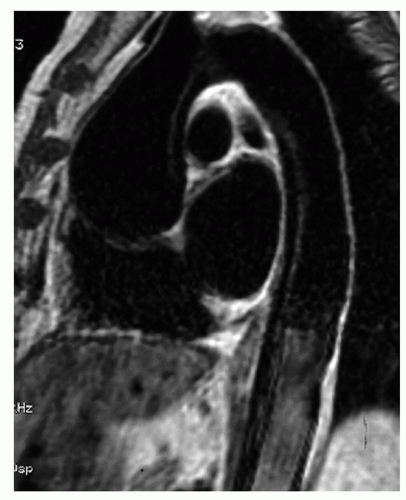
Figure 32.5. Spin-echo sagittal image of type A dissection: The intimal flap is visible as subtle linear image in the ascending and descending aorta.


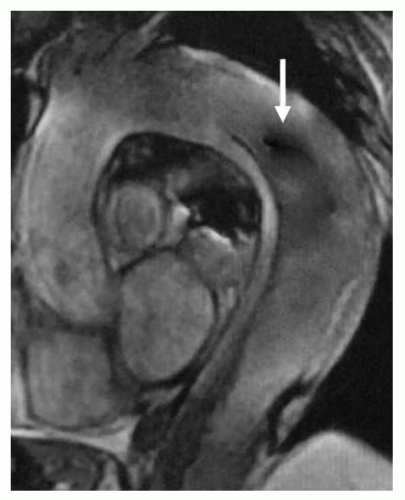
Figure 32.6. Gradient-echo sagittal image of type B dissection: Flow turbulence (signal void, arrow) in the descending aorta indicates the entry site.


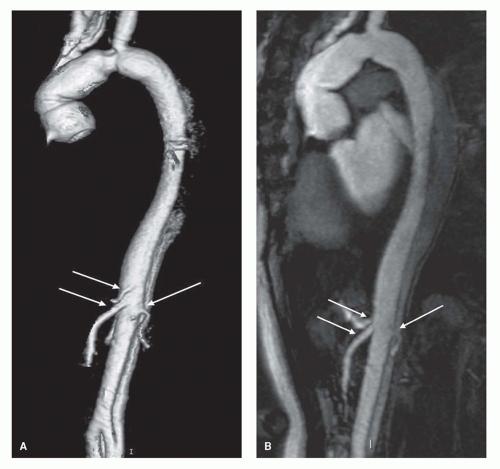
Figure 32.7. MRA 3D (A) and MIP (B) images of aortic dissection (abdominal aorta): Celiac, mesenteric, and left renal arteries originate from the anterior true lumen (arrows).

The third step in the diagnosis of aortic dissection and the definition of its anatomic detail relies on the use of gadoliniumenhanced 3D MRA. Since 3D MRA is rapidly acquired without any need of ECG triggering, this technique may be used for even severely ill patients. Since it is not nephrotoxic and causes no other adverse effects, gadolinium can be used in patients with renal failure or low cardiac output. With spin-echo sequences, artifacts caused by imperfect ECG gating, respiratory motion, or slow blood pool can result in intraluminal signal, simulating, or obscuring an intimal flap. In gadolinium-enhanced 3D MRA, the intimal flap is easily detected and the relationship with aortic vessels clearly depicted (Figs. 32.7 and 32.8). Entry and re-entry sites appear as a segmental interruption of the linear intimal flap on axial or sagittal images (Fig. 32.9). The analysis of MRA images should not be limited to viewing MIP images or SSD; it should also include a complete evaluation of reformatted images in all three planes, to confirm or improve spin-echo information and exclude artifacts. In MRA postprocessing displays, the appearance of the dissected aorta is similar to that on conventional catheter angiograms, but diagnostic information such as the intimal flap can be masked. Combining the spin-echo with MRA images completes the diagnosis and anatomical definition (58). However, two cases of intramural hematoma (IMH) missed by MRA (28) raise concern about using MRA as the sole modality for suspected aortic dissection.

At present, MRI is one of the most accurate tools in the detection of aortic dissection. A high degree of spatial resolution and contrast and the capability for multiplanar acquisition provide excellent sensitivity and specificity that approximate 100% in the published series (58,59,60 and 61). With modern scanner, a comprehensive study of the entire aorta is completed in less than 10 minutes, and patient’s ECG, blood pressure, and oxygen saturation can be monitored, even during assisted ventilation. The implementation of open systems may soon allow a wider use of MRI even in acute pathology.

Aortography has long been considered the method of choice in suspected aortic dissection, despite the risk of catheter manipulation and injection of high flow contrast in a dissected aorta. With the advent of noninvasive imaging modalities, its low accuracy has been demonstrated; the reported sensitivity is 77% to 90% and the specificity is 90% to 100%. The superiority of transesophageal echocardiography (TEE), CT, and MRI in comparison to angiography has been widely reported in the literature (51,52 and 53,59).

In general, TEE is a reliable method with excellent sensitivity, and a great advantage is that it can be performed at the bedside in patients too unstable for transportation. However, artifacts and “blind areas,” such as the distal portion of the
ascending aorta, can influence specificity in an operatordependent manner. Since TEE information is limited to the thoracic aorta, sometimes with suboptimal display also of the aortic arch, a second imaging modality encompassing the entire aorta is advisable in stable patients.


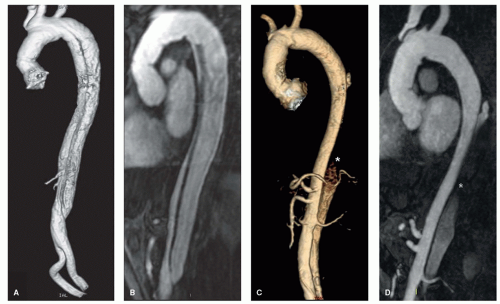
Figure 32.8. MRA 3D (A,C) and MIP (B,D) images of aortic dissections; the false lumen is patent in (A,B) and partially thrombosed in (C,D) (asterisk).


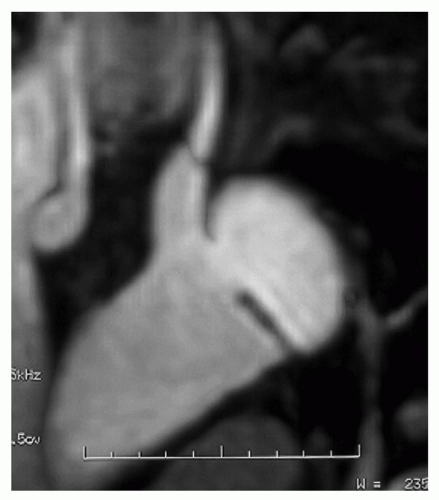
Figure 32.9. MRA of aortic dissection (thoracic aorta): The entry site is visible as segmental interruption of the linear intimal flap.


CT Technique and Findings

CT has a difficult and crucial role in the diagnostic workup for aortic dissection. According to the results of the International Registry of Acute Aortic Dissection (62), CT resulted to be the initial modality to confirm the clinical suspicion of aortic dissection in the majority of cases (63%), followed by TEE (32%), aortography (4%), and MRI (1%). Sensitivity rates of these four imaging modalities, in the set of suspected acute aortic dissection, are 100% for MRI, 93% for CT, 88% for angiography, and 87% for TEE.

The critical clinical issue required of any imaging test applied to a patient suspected of having an aortic dissection is the identification of an intimal flap and its localization to the ascending (type A) or descending (type B) aorta. This fundamental diagnostic feature that determines the need for emergent repair can be addressed by at least four imaging modalities: Angiography, CT, MRI, and TEE. The relative accuracy of these modalities has been debated in the medical literature and is confounded by the fact that technical improvements in CT, MRI, and TEE have outpaced our ability to compare them appropriately. Recent opinion has shifted
toward MRI or TEE as the most sensitive tests for aortic dissection. Unfortunately, much of this opinion is based upon comparative studies where MRI or TEE is compared with relatively obsolete conventional CT or SDCT techniques (53,59,60,63,64 and 65) (Table 32.5). To date there have been no comparisons of multidetector CT to either MRI or TEE and is useless to consider these prior studies while CT, more than MRI or TEE, got substantial advances and features.


TABLE 32.5 Comparison between CT—Standard (S) or Helical (H)— and TEE, MR, and Angiography in Aortic Dissection


Author


Year


Technique


Sensitivity (%)


Specificity (%)


PPV (%)


Erbel


1989


S CT


77


TEE


98


Aortography


89


Barbant


1992


S CT


40-95


TEE


40-95


Aortography


40-65


MR


90-00


Nienaber


1993


H CT


94


87


TEE


98


MR


98


98


Sommer


1996


H CT


100


94


TEE


100


94


MR


100


100


Helical CT allows diagnosis of acute aortic dissection with sensitivity and specificity rates respectively of 83% to 94% and 87% to 100% (66,67 and 68). Imaging of dissection requires a volume of coverage from supra-aortic branches superiorly to the femoral arteries inferiorly, and MDCT in few seconds can acquire this extent. Imaging sensitivity is enhanced by greater temporal resolution and ECG-gating sequences which minimize pulsation artifacts at the aortic root (Fig. 32.10). On unenhanced CT, it is possible to see internal displacement of intimal calcifications and this finding could be confused with an aneurysm with calcified mural thrombus. High attenuation of the false lumen at unenhanced CT may help differentiate between the two conditions (69). The main and characteristic finding of aortic dissection on contrastenhanced CT scan is an intimal flap that separates true from the false lumen. This usually appears as a thin linear luminal filling defect and its appearance is determined by the circumference and length of dissection, the relative lumen flow, and aortic pulsation. Accurate differentiation between true and false lumen became fundamental with the advent of endovascular procedure for treatment planning (70). The slender linear areas of low attenuation that occasionally appear in the false lumen on CT images, known as the cobweb sign, are specific to the false lumen and may aid in its recognition. These findings correspond to residual ribbons of the media, incompletely sheared away during the dissection process (71). Two other useful indicators of the false lumen are a larger cross-sectional area and the beak sign. This one is the manifestation of the wedge of hematoma that cleaves a space for the propagation of the false lumen (72). However, on most contrast-enhanced CT scans the true lumen may be identified by its continuity with an undissected portion of the aorta (Fig. 32.11). Communicating and noncommunicating dissections are diagnosed based on identifiable flow in the false lumen. When slower flow is present, false lumen filling defects that represent strand of thrombus are observed, and complete thrombosis can be reliably diagnosed on follow-up examinations (Fig. 32.12) (71,72). One unusual type of aortic dissection is the intimo-intimal intussusception produced by circumferential dissection of the intimal layer, which subsequently invaginates like a wind sock; CT scan may show one lumen wrapped around the other lumen in aortic arch, with the inner lumen invariably being the true one (73,74). Sometimes an aortic aneurysm with intraluminal thrombus may be difficult to distinguish from a dissection with a thrombosed false lumen; may help us the fact that dissection generally has a spiroidal shape, whereas a thrombus tends to maintain a constant circumferential relationship with the aortic wall and, furthermore, a mural thrombus usually has a smooth internal border. Calcification in aneurysm is typically located at the periphery of the aorta (75). Visceral and supra-aortic vessel’s involvement can account for high mortality and MDCT has the spatial and contrast resolution to reliably diagnose branch vessel involvement and document true or false lumen supply (Figs. 32.11 and 32.12). General strategy of CT study of the thoracic- abdominal aortae and main CT findings of aortic diseases are showed in Table 32.6.

Apart from axial images and MPR, which provides an overall view of the aortic dissection and demonstrate the anatomic relationships between the flap and adjacent great vessels, VR is preferred to MIP and SSD for dissection 3D postprocessing as it preserve the variable enhancement patterns of the lumina and is more sensitive for visualization of the flap. The accurate localization of entry and re-entry sites remains a difficulty for all imaging techniques, but the high resolution of submillimeter MDCT acquisitions and cardiac gating may be enough reliable to depict them (Figs. 32.11 and 32.12). The last generation of scanners may also depict coronary artery involvement but, to date, determinate or quantify aortic insufficiency with CT is still impossible.

In CT study for suspected aortic dissection, especially with SDCT scanners, there are a variety of pitfalls mimicking aortic
dissection. These pitfalls are attributable to technical factors (improper timing or rate of contrast administration), streak artifacts (high-attenuation materials, high-contrast interfaces, and cardiac motion), periaortic structures (aortic arch branches, mediastinal veins, pericardial recess, thymus, atelectasis, and pleural thickening or effusion), aortic wall motion, aortic anomalies, and the aforementioned aortic aneurysm with thrombus (68,76). At present with an optimal scan protocol which requires a precontrast study, an ECG-gated arterial phase sequence and a delayed scan for slower blood flows, most of these artifacts/pitfalls are minimized.


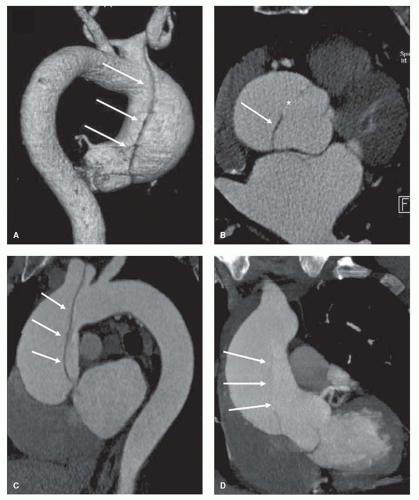
Figure 32.10. ECG-gated MDCT 3D (A), axial (B), and MIP (C,D) images of a type A aortic dissection showing the entry tear (asterisk) and the intimal flap (arrows).


INTRAMURAL HEMATOMA

IMH was first described in 1920 as “dissection without intimal tear” (77), but it was rarely recognized in the clinical setting before the advent of high-resolution imaging modalities. Spontaneous rupture of aortic vasa vasorum of the media layer is considered the initiating process, which is confined in the aortic wall without intimal tear. This results in a circumferentially oriented blood containing space seen on tomographic imaging studies. IMH may occur spontaneously or as a consequence of penetrating aortic ulcer (PAU) in intrinsically diseased media; it has also been described

following blunt chest trauma (78). As in aortic dissection arterial hypertension is the most frequent predisposing factor. Clinical signs and symptoms and the prognosis do not differ to classic aortic dissection, and IMH should be regarded as a variant of dissection with similar or more serious prognostic and therapeutic implications (79). Typical complications of dissection such as fluid extravasation with pericardial, pleural, and periaortic hematoma may occur in IMH as well. In a retrospective analysis of the Yale experience on 214 patients with acute aortic syndromes, Coady et al. (80) found 47.1% rate of aortic rupture for IMH, higher than that for classic type A (7.5%) or type B dissection (4.1%). However, after the acute phase, the evolution of IMH may be also favorable; in the series described by Yamada et al. (81), nine of ten survivors to initial presentation showed complete resolution of the aortic hematoma within 1 year.


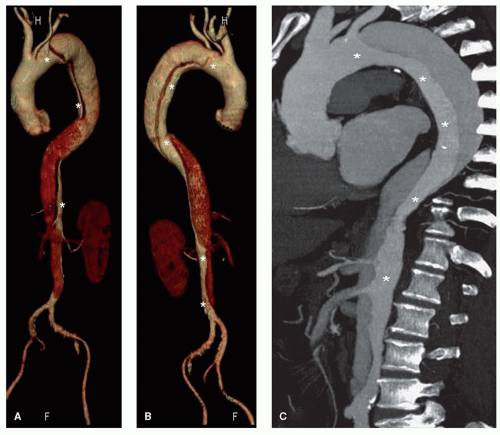
Figure 32.11. MDCT 3D (A,B) and MIP (C) images of a type B aortic dissection: True lumen is clearly visible (asterisk) and recognizable by its continuity with undissected aorta at the level of the aortic arch and the iliac bifurcation.
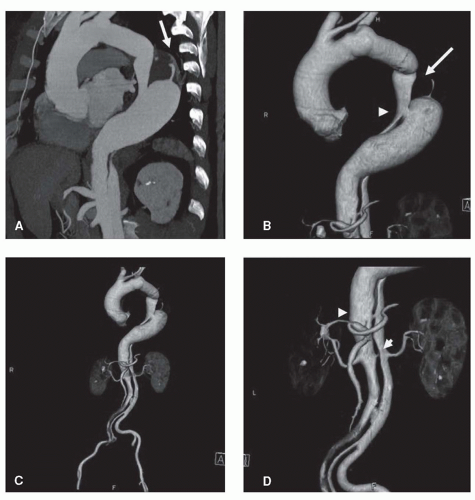


Figure 32.12. MPR thick (A) and VR (BD) MDCT images of type B aortic dissection showing a partially thrombosed false lumen in descending thoracic aorta (arrow). Entry and re-entry tears are also illustrated (arrowhead).

Only gold members can continue reading. Log In or Register to continue

Stay updated, free articles. Join our Telegram channel

May 24, 2016 | Posted by in CARDIOLOGY | Comments Off on MRI and CT of Thoracic Aorta

Full access? Get Clinical Tree

Get Clinical Tree app for offline access