Heart failure (HF) disproportionately affects black compared to white Americans, and overall mortality from HF is greater among blacks. Paradoxically, mortality rates after a hospitalization for HF are lower in black than in white patients. These racial differences might reflect hospital, physician, and patient factors and could have implications for comparative hospital profiles. We identified published studies reporting the posthospitalization mortality for black and white patients with a discharge diagnosis of HF and conducted random-effects meta-analyses with the outcome of all-cause mortality. We included 29 cohorts of hospitalized black and white patients with HF. The unadjusted mean mortality rate after HF hospitalization for black and white patients, respectively, was 6% and 9% for in-hospital, 6% and 10% for 30-day, 10% and 15% for 60- to 180-day, 28% and 34% for 1-year, and 41% and 47% for >1-year follow-up, respectively. The unadjusted combined odds ratios for mortality in black versus white patients ranged from 0.48 for in-hospital (95% confidence interval [CI] 0.45 to 0.51) to 0.77 after >1 year follow-up (95% CI 0.75 to 0.79). In meta-analyses using adjusted data, the combined odds ratio was 0.68 for short-term mortality (95% CI 0.63 to 0.74), and the combined hazard ratio was 0.84 for long-term mortality (95% CI 0.77 to 0.91). In conclusion, mortality after hospitalization for HF was 32% lower during short-term follow-up and 16% lower during long-term follow-up for black than for white patients. The mortality differences imply unmeasured differences by race in clinical severity of illness at hospital admission and might lead to biased hospital mortality profiles.
After a hospitalization for heart failure (HF), numerous reports have indicated that mortality is lower in black than in white patients, and a few studies have reported that mortality is similar. This lower or similar reported mortality in hospitalized black patients with HF has not been accompanied by reports of substantially better quality of care for black compared to white patients. Moreover, national and ambulatory cohorts of patients with HF have demonstrated greater or similar mortality in black than in white patients. The comparison of HF mortality by race among either population-based or ambulatory-based cohorts versus hospital-based cohorts has highlighted a paradox in HF mortality by race. This observation that lower reported mortality among black patients occurs only in hospital-based cohorts suggests systematic differences in the clinical composition of hospital-based cohorts by race. Although studies have documented both lower and similar mortality in black patients compared to white patients after a HF hospitalization, these findings have not, to our knowledge, been reviewed and examined together. The objective of the present study was to examine studies reporting mortality by race after a hospitalization for HF and to combine the results using meta-analyses.
Methods
We searched MEDLINE, CINAHL, Web of Science, PsycInfo, and SportDiscus from 1985 to March 2009. Our keywords were mortality, heart failure , and the combination of black or African American . We limited the results to reports in English, and we excluded letters, abstracts, conference proceedings, reviews, and editorials. In addition, we examined the citation sections of the eligible studies for other relevant reports.
We included studies that reported mortality by race in a cohort of black and white adult patients hospitalized with HF. The studies were limited to those examining patients hospitalized in the United States or Canada because the definitions of race could differ elsewhere. Studies were excluded if the investigators did not report the odds ratio (OR) or hazard ratio (HR), or provide enough information to calculate an OR for mortality in black compared to white patients. Studies examining outcomes in peripartum cardiomyopathy were excluded. Two board-certified physician reviewers (HG, internal medicine, and AD, cardiology) and 2 statistical reviewers (PN and DM) independently screened the titles and abstracts of the studies to identify those fulfilling the inclusion criteria. The full report was reviewed by ≥3 reviewers to verify inclusion (when all reviewers agreed) and to resolve disagreements (when ≥1 reviewer voted to include a report). The studies selected for inclusion were evaluated again by the statistical reviewers to determine the suitability for meta-analysis.
An abstraction form was used to collect descriptive information from each report. The abstracted data included study characteristics, study cohort description, study cohort demographics (eg, mean age, gender, insurance), year(s) data were collected, data collection locations, data source (eg, Medicare, Veterans Affairs hospitals), purpose of data collection (eg, hospital profiling, research study), number of black and white patients included, number of patients alive and dead at each follow-up period, unadjusted and adjusted ORs (or HR) and 95% confidence intervals (CIs) for death in black compared to white patients, methods used for adjustment, and variables controlled for in the adjusted analysis. The data were classified as “clinical” when the data were obtained from the patients’ medical records and as “administrative” otherwise. Because racial differences in hospital readmission rates could bias the mortality rates, we examined whether the studies used data that could track separate patient hospitalizations (ie, readmissions). The data were abstracted by 2 statistical reviewers for 13 studies, and the agreement was 97% across data elements. The remaining 14 studies were abstracted by one of the statistical reviewers.
The primary outcome of the meta-analysis was all-cause mortality after hospitalization and was examined separately for the unadjusted and adjusted data. The mortality data were stratified by several posthospitalization follow-up intervals: in-hospital, 30 days, 60 to 180 days, 1 year, and after 1 year for the unadjusted data and short-term (0 to 30 days) and long-term (>30 days) for the adjusted data. Because of the general incompatibility of the OR and HR, separate analyses were conducted for the adjusted ORs and HRs. Standard errors were calculated using the reported confidence interval for each result. When a study reported multiple results across different follow-up intervals, we included the result for the longest duration of follow-up in the meta-analysis. A random effects model was used to analyze the data. To assess between-trial heterogeneity, an I 2 was calculated. This statistic can range from 0% to 100% and describes the percentage of variability in point estimates caused by between-trial heterogeneity rather than chance and is not dependent on the number of trials included. A reference standard does not appear to exist for what is considered an acceptable I 2 ; however, we used an I 2 of <30% as an indicator of low (or mild) heterogeneity.
We conducted several analyses to examine the robustness of our findings. After constructing the final models, we examined a series of stratified meta-analyses by type of publication, data quality, data source for the study population (ie, national, state, regional, hospital), demographic patient characteristics (ie, age, gender), year(s) data were collected, and follow-up length. To further examine the stability of the findings, sensitivity analyses were conducted after removing studies with the largest or smallest sample sizes. Because of limitations in using a single method, we examined whether publication bias existed within the data set by assessing funnel graph symmetry visually and statistically and by calculating a fail-safe N. Analyses were conducted using Statistical Analysis Systems, version 9.2 (SAS Institute, Cary, North Carolina) and Review Manager (RevMan version 5.0, The Cochrane Collaboration, Copenhagen, Denmark). The Veterans Affairs Health Services Research and Development Service supported the review in part but had no role in the selection of articles or the interpretation of the results.
Results
We identified 330 reports from our search strategy. From these, we identified 95 potentially eligible articles and examined the full text of each. Of the 95 reports, 27 met the eligibility criteria, and 2 of these articles reported multiple cohorts of hospitalized patients. This selection resulted in a total of 29 eligible cohorts. Of these 29 cohorts, 24 included both men and women, and 9 excluded patients <65 years old. Approximately 1/2 of the cohorts used a nationwide sample of patients, 10% were conducted at a single hospital, 17% used data from a single state, 44% were regional, multistate, or multihospital, 17% were beneficiaries of the US Department of Veterans Affairs, and 28% were Medicare/Medicaid beneficiaries. Table 1 includes a brief description of each cohort, the proportions of patients by race and gender, mean age within the cohort, and whether the cohorts included readmissions. Mortality was adjusted for at least one covariate in all cohorts, and 21 of the 29 studies adjusted for ≥3 covariates. Cohorts adjusted black–white mortality outcomes using age (28 cohorts), gender (19 cohorts), socioeconomic status (9 cohorts), health insurance (5 cohorts), co-morbidity (21 cohorts), clinical severity of illness (10 cohorts), and hospital-level factors (11 cohorts).
| Study No. | Investigator | No. of Hospitalizations/Description of Data Source or Hospital | Black (%) | Women (%) | Mean Age (years) | Admissions |
|---|---|---|---|---|---|---|
| 1 | Agoston et al | 448 from 1 tertiary care Veterans Affairs hospital | 44 | 1 | 68 | Single |
| 2 | Ahmed et al | 944 from 11 Alabama hospitals (Medicare) | 18 | 61 | 79 | Multiple |
| 3 | Alexander et al | 76,466 from California hospitals | 12 | 53 | 74 | Single |
| 4 | Auble et al | 8,668 from Pennsylvania hospitals | 16 | 57 | 76 | Multiple |
| 5 | Brown et al | 6,491,495 from Medicare | 11 | — | — | ND |
| 6 | Croft et al | 631,306 from Medicare | 8 | 58 | — | Single |
| 7 | Croft et al | 803,506 from Medicare | 8 | 58 | — | Single |
| 8 | Croft et al | 170,239 from Medicare | 9 | 58 | 79 | Single |
| 9 | Deswal et al | 21,994 from 153 Veterans Affairs hospitals | 22 | 2 | 70 | Single |
| 10 | Echols et al | 923 from a research trial in 80 United States hospitals | 34 | 34 | 66 | Single |
| 11 | Feinglass et al | 2,323 from 1 Midwestern University hospital | 17 | 54 | — | Single |
| 12 | Gordon et al | 24,833 from 30 northeast Ohio hospitals | 23 | 56 | 73 | ND |
| 13 | Ibrahim et al | 12,911 from 30 northeast Ohio hospitals | 16 | 58 | 79 | Single |
| 14 | Ibrahim et al | 1,058 from 30 northeast Ohio hospitals | 13 | 70 | 79 | ND |
| 15 | Jha et al | 6,601 from 147 Veterans Affairs hospitals | 22 | 0 | 64 | Single |
| 16 | Joshi et al | 14,603 from 1,000 hospitals in 22 states | 14 | 54 | 73 | ND |
| 17 | Kamath et al | 135,734 from 274 hospitals | 22 | 52 | 73 | Multiple |
| 18 | McClellan et al | 665 from 1 southeastern state (Medicare) | 28 | 60 | 76 | Single |
| 19 | Meyers et al | 2,101 from 54 United States military hospitals | 18 | 0 | 66 | Single |
| 20 | Philbin et al | 45,894 from 236 New York state hospitals | 18 | 56 | 74 | Single |
| 21 | Pippins et al | 128,584 from 376 hospitals in 26 states | 24 | — | — | ND |
| 22 | Polsky et al ⁎ | 104,493 from 138 Veterans Affairs hospitals | 25 | 0 | 68 | ND |
| 23 | Polsky et al ⁎ | 371,622 from hospitals in 2 states | 14 | 0 | 69 | ND |
| 24 | Polsky et al | 1,855,844 from Medicare | 11 | 59 | 80 | Single |
| 25 | Rathore et al | 29,732 from National HF Project | 12 | 60 | 80 | Single |
| 26 | Shen et al | 373,158 from 20% of United States hospital discharges | 13 | 51 | 70 | ND |
| 27 | Vaccarino et al | 398 from Yale New Haven Hospital | 21 | 52 | 73 | Single |
| 28 | Volpp et al | 111,556 from 138 Veterans Affairs hospitals | 25 | 0 | 69 | Multiple |
| 29 | Yancy et al | 47,189 from OPTIMIZE-HF national registry | 18 | 52 | 73 | Single |
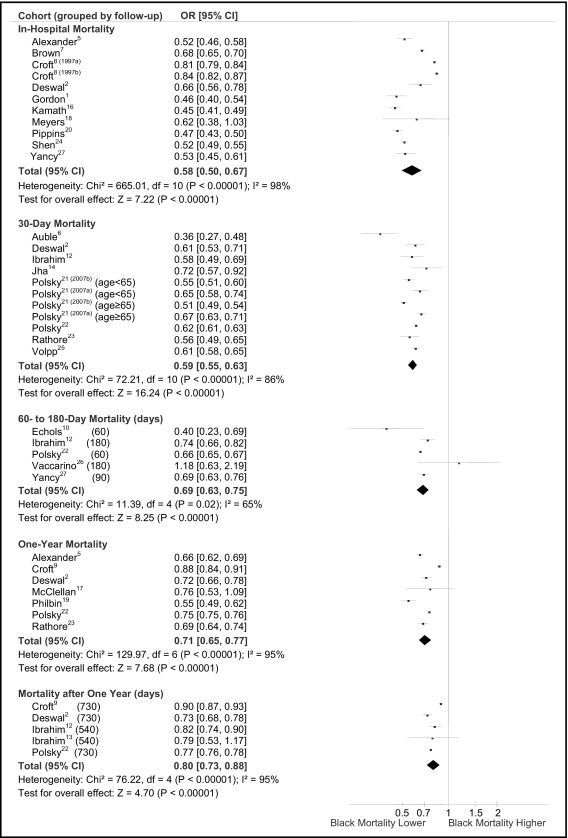
The unadjusted mean mortality rate after HF hospitalization for black and white patients, respectively, was 6% and 9% for in-hospital, 6% and 10% for 30-day, 10% and 15% for 60- to 180-day, 28% and 34% for 1-year, and 41% and 47% for >1-year follow-up. In the individual cohorts, the unadjusted ORs were generally <1.0, and in the meta-analysis of the unadjusted data, the summary ORs were 0.58 for in-hospital, 0.59 for 30-day, 0.69 for 60- for 180-day, 0.71 for 1-year, and 0.80 for >1 year follow-up, indicating lower mortality after hospitalization for black patients than for white patients ( Figure 1 ). A high level of heterogeneity was observed within each follow-up interval (I 2 range 61% to 99%), indicating substantial variability between cohorts. In a separate analysis, cohorts contributing the greatest amount of heterogeneity (as indicated by a change in the group chi-square statistic) were eliminated systematically until the I 2 was ≤30%. After these changes were made, the unadjusted combined OR for mortality for black compared to white patients was 0.48 (95% CI 0.45 to 0.51) for 6 cohorts reporting in-hospital mortality, 0.62 (95% CI 0.60 to 0.65) for 8 cohorts reporting 30-day mortality, 0.71 (95% CI 0.66 to 0.76) for 2 cohorts reporting 60- to 180-day mortality, 0.68 (95% CI 0.65 to 0.72) for 4 cohorts reporting 1-year mortality, and 0.77 (95% CI 0.75 to 0.79) for 4 cohorts reporting mortality beyond 1 year.
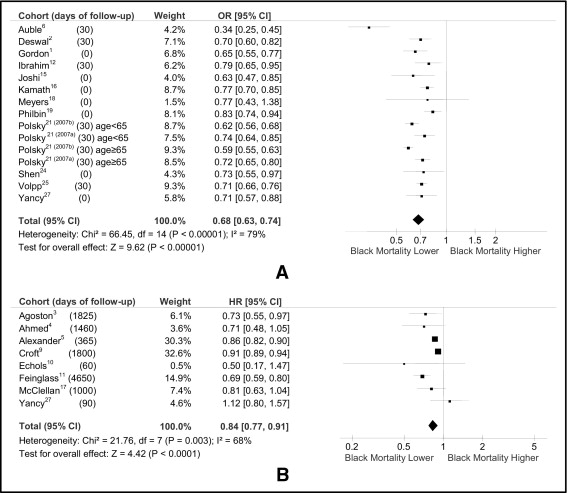
We also conducted meta-analyses that combined the adjusted results with the potential risk factors for mortality. The adjusted meta-analyses were conducted separately for studies with short-term and long-term follow-up. The meta-analysis conducted using adjusted ORs for in-hospital or 30-day mortality resulted in a combined adjusted OR of 0.68 (95% CI 0.63 to 0.74; Figure 2 ). The meta-analysis using the HR for the follow-up intervals >30 days resulted in a combined adjusted HR of 0.84 (95% CI 0.77 to 0.91; Figure 2 ). These results indicated lower mortality in blacks than in whites after a hospitalization for HF for both short- and long-term follow-up periods. However, the heterogeneity was significant in both instances (I 2 = 79% and I 2 = 68%, respectively). To reduce potential bias, we re-examined these meta-analyses after excluding 9 cohorts that (1) used data from the same source with overlapping intervals (4 cohorts); (2) increased the I 2 >30% (2 cohorts); (3) explicitly included multiple admissions (2 cohorts), and (4) did not adjust for age (1 cohort). In these meta-analyses, mortality was significantly lower in the black than in the white patients, with a short-term OR of 0.74 (95% CI 0.70 to 0.79) and long-term HR of 0.84 (95% CI 0.78 to 0.91). Heterogeneity was low and was not statistically significant for the short-term analysis (p = 0.39; I 2 = 5%) but remained high in the long-term (>30-day to >1-year mortality) analysis (p = 0.002 and I 2 = 71%).