The aims of this study were to assess the right ventricle in different causes of pulmonary hypertension (PH) and to assess the changes of the tricuspid apparatus during this remodeling. The functional and morphologic changes of the right ventricle and the tricuspid apparatus in relation to different causes of PH remain elusive. A total of 141 consecutive patients were prospectively recruited, of whom 55 had pulmonary arterial hypertension (PAH), 32 had chronic thromboembolic disease (CTED), and 34 had PH secondary to mitral regurgitation (MR). Twenty age- and gender-matched healthy volunteers were also studied to serve as controls. Real-time 3-dimensional echocardiography was used to assess right ventricular (RV) volumes and tricuspid valve mobility. Overall, RV diastolic volumes were greater and RV ejection fractions lower in patients with PAH compared to those with CTED and MR (186.4 ± 48.8 vs 113.5 vs 109.4 ml, p <0.001, and 33.2% vs 36.8% vs 66.8%, p <0.001, respectively). Among the 3 PH groups, tricuspid valve mobility was most restricted in the CTED group and least restricted in the MR group. Tricuspid tenting volume was greater in the CTED and PAH groups than in the MR group (p <0.01). Most patients with PAH (54.6%) had at least moderate tricuspid regurgitation, while in the CTED group, most (59.4%) had mild and only 37.5% had moderate tricuspid regurgitation (p <0.01). Conversely, patients with MR (85%) had only mild tricuspid regurgitation. There was no correlation between RV systolic pressures and the RV ejection fraction or tenting volume. In conclusion, this study demonstrates that different causes of PH may lead to diverse RV remodeling, with the most adverse remodeling being in patients with PAH. In addition, changes of the tricuspid apparatus also differed, with the most adverse effects seen in patients with CTED.
In this study, we hypothesized that different causes of pulmonary hypertension (PH) may lead to diverse patterns of right ventricular (RV) remodeling and that as a consequence, the tricuspid apparatus would change in shape and leaflet mobility. The purpose of this study was to characterize the RV remodeling, including the tricuspid apparatus, in different causes of PH using 3-dimensional echocardiography.
Methods
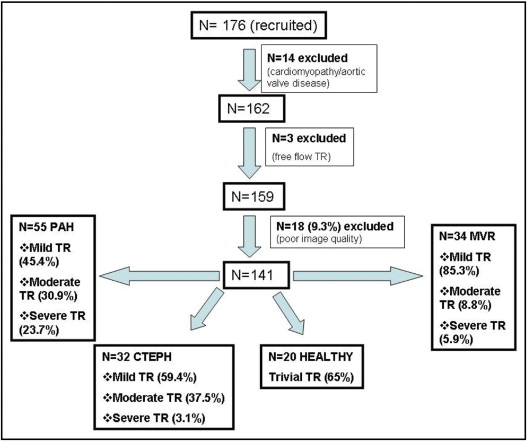
Consecutive patients with PH were prospectively enrolled from patients referred for clinical evaluation at our institution. The following inclusion criteria were used: (1) chronic PH that had been diagnosed for >6 months before the study with cardiac catheterization, (2) tricuspid regurgitant velocity >2.7 m/s, and (3) sinus rhythm. Patients with cardiomyopathy, aortic valve disease, free-flow tricuspid regurgitation, and poor RV or tricuspid valve image quality were excluded. Patients were distributed into 3 groups according to the cause of PH ( Figure 1 ) : 55 patients had pulmonary arterial hypertension (PAH; precapillary PH), 32 had chronic thromboembolic disease (CTED; precapillary PH), and 34 had secondary PH due to mitral regurgitation (MR; postcapillary PH).
All patients underwent comprehensive right- and left-sided cardiac catheterization and contrast-enhanced pulmonary angiography, which was performed using a multidetector helical computed tomographic scanner (LightSpeed Ultra; GE Medical Systems, Milwaukee, Wisconsin), with collimation of 1.25 mm, and a ventilation perfusion lung scan. Standard criteria for the diagnosis of PH were used. Twenty healthy volunteers were used as the control group. The protocol was approved by the local ethics committee.
A comprehensive baseline study was first performed, including the assessment of right-sided heart pressures and measurement of tricuspid regurgitant velocity. RV systolic pressure was estimated using the modified Bernoulli equation, added to the right atrial pressure from the diameter of inferior vena cava and its inspiratory collapse. Systolic flow reversal in the inferior vena cava and hepatic veins was recorded in all patients. The tricuspid regurgitant jet was graded according to the guidelines for quantification of valvular regurgitation. Patients with free-flow regurgitation were excluded because the Bernoulli equation is not valid and the estimated RV systolic pressure is underestimated.
RV volumes and ejection fraction (EF)
Three-dimensional echocardiography was performed to obtain an all-inclusive RV apical view using a Philips iE33 ultrasound system (Philips Medical Systems, Andover, Massachusetts) with an S3 transducer at 1.6 to 3.2 MHz, equipped with a central X4 transducer (frequency 3 to 4 MHz). After the initial capture, images were digitally stored on the equipment’s hard disk and transferred to a computer for off-line analysis. Using dedicated software (Tomtec 4D-RV-Function; TomTec Imaging Systems, Munich, Germany), sequential short-axis planes of the right ventricle with reference to the apical 4-chamber and RV inflow views were obtained, and volumetric data sets were regenerated with an off-line analysis system permitting endocardial contour delineation. The end-diastolic phase was defined as the peak of the R wave of the QRS complex and the end-systolic phase as the first frame before opening of the tricuspid valve. Left ventricular (LV) and RV volumes were calculated by manual tracing along the endocardial contours of the ventricular apex at 7-mm intervals, as previously described. Papillary muscles and trabeculations were excluded from endocardial mapping. End-diastolic and end-systolic LV and RV volumes and EFs were calculated off-line using the method of summation of disks and semiautomated border detection. Valve opening and closure were identified for the volume determination. The RV and LV EFs were calculated as end-diastolic volume minus end-systolic volume divided by end-diastolic volume.
Tricuspid valve 3-dimensional geometric pattern
A real-time zoom 3-dimensional image of the tricuspid valve from the apical view was obtained. Using TomTec 4-dimensional analysis software, 3 longitudinal planes, from the short-axis projection of the tricuspid valve were obtained for the calculation of leaflet excursion. Tricuspid leaflet excursion was analyzed by establishing a reference “x-y” plane corresponding to the tricuspid annulus and a reference point “z” corresponding to the apposition of the tricuspid leaflets. All points were represented in a 3-dimensional Cartesian coordinate system in which points were adjusted automatically during the cardiac cycle for all 3 leaflets. The angles between each tricuspid leaflet and the annulus were automatically generated as the mean angle in end-diastole and end-systole as follows: septal leaflet in end-diastole (Θ SD ) and end-systole (Θ SS ), anterior leaflet in end-diastole (Θ AD ), and end-systole (Θ AS ), and posterior leaflet in end-diastole (Θ PD ) and end-systole (Θ PS ).
End-diastolic tricuspid annular diameter was measured from the apical 4-chamber view from 2-dimensional echocardiographic images. Tricuspid tenting volume was measured at midsystole by tracing the tenting region from the long axis between the posterior and septal leaflets and the annulus. Tricuspid tenting height was defined as the distance from the apposition point of the leaflets to the annulus, from the apical 4-chamber view perpendicular to the annulus.
Data are expressed as mean ± SD for normally distributed values and medians with interquartile ranges for variables not normally distributed. Normal distribution of each variable was assessed using the Kolmogorov-Smirnov test, and for comparison among the 3 groups, analysis of variance with Bonferroni’s correction for normally distributed variables was used. For variables not normally distributed, comparison of groups was performed using Kruskal-Wallis tests, and the cut-off value for significance was adjusted for multiple comparisons to a value of 0.01. The sensitivity and specificity of cut-off points of the values measured were assessed to predict a severely impaired right ventricle, defined as an EF <40% in the PAH, CTED, and MR groups, using receiver-operating characteristic curves. The optimal cut-off value for each parameter was defined as the value giving the largest area under the curve. To select which echocardiographic parameters to include in a multivariate regression analysis model to identify the most significant independent echocardiographic predictors, we used a cut-off area under the curve of >0.8 to discriminate good or excellent accuracy. Test-retest reproducibility for the 3-dimensional echocardiographic excursion angles was tested in the CTED group using Bland-Altman analysis. All tests were double sided, and the cut-off value of statistical significance was 0.05. Statistical analyses were performed using SPSS version 17.0 (SPSS, Inc., Chicago, Illinois) and MedCalc version 11.1 (MedCalc Software, Mariakerke, Belgium).
Results
Between January and August 2008, a total of 176 consecutive patients with PH were prospectively enrolled. Fourteen patients with cardiomyopathy and aortic valve disease were excluded from the study. Three patients with free-flow tricuspid regurgitation were also excluded because of possible overestimation of RV systolic pressure. A further 18 patients (9.3%) were excluded because of poor image quality of the right ventricle or the tricuspid valve ( Figure 1 ). A total of 141 consecutive patients constituted our study group. Patients were distributed into 3 groups depending on the cause of PH according to recent guidelines. Eighty-one of the 141 patients (57%) were women.
The mean follow-up period from the time of diagnosis was 14 ± 4.2 months for patients with PAH, 15 ± 3.7 months for those with CTED, and 9 ± 2.4 months for those with MR. Cardiac catheterization data are listed in Table 1 . Patients with MR had the greatest pulmonary capillary wedge pressures (21.7 ± 4.1 mm Hg), those with PAH had the greatest pulmonary arterial pressures (86.7 ± 16.2 mm Hg), and those with CTED had the highest pulmonary vascular resistance indexes (10.2 ± 2.7 Wood units) compared to all other groups (p <0.01 for each). Clinical and 2-dimensional echocardiographic data are listed in Table 2 . Patients had matched New York Heart Association functional classes: 21 with PAH (38%), 15 with CTED (47%), and 19 with MR (56%) were in class III. Two patients with PAH (4%) and 8 with MR (25%) were in class IV, and the rest of the patients were in class II. Patients with CTED were younger (36 ± 6.7 years) compared to those with PAH and MR (p <0.01). Patients with MR had greater mean body surface areas compared to those in the other groups. RV systolic pressures were most elevated in patients with PAH compared to those with CTED (p <0.01) and MR (p <0.01).
| Group | Mean Right Atrial Pressure (mm Hg) | Pulmonary Capillary Wedge Pressure (mm Hg) | Pulmonary Vascular Resistance Index (Wood units/m 2 ) | Pulmonary Arterial Pressure (mm Hg) | Cardiac Output Index (L/min/m 2 ) |
|---|---|---|---|---|---|
| MR (n = 34) | 10.5 ± 4.8 ⁎ | 21.7 ± 4.1 ⁎ | 1.5 ± 0.1 ⁎ | 48 ± 7.2 ⁎ | 3.4 ± 0.3 ⁎ |
| CTED (n = 32) | 16.5 ± 4 ⁎ | 7.5 ± 2.5 † | 10.2 ± 2.7 ⁎ | 57.2 ± 9.3 ⁎ | 2.5 ± 0.4 † |
| PAH (n = 55) | 13.5 ± 4.2 ⁎ | 7.2 ± 2.7 † | 6.3 ± 3.1 ⁎ | 86.7 ± 16.2 ⁎ | 2.2 ± 0.3 † |
⁎ Significant difference between groups overall (analysis of variance and Bonferroni test, p <0.01).
† Nonsignificant difference between CTED and PAH groups (p >0.05).
| Group | Women | Age (years) | Body Surface Area (m 2 ) | Tricuspid Annular Diameter (mm) | Tenting Volume (cm 3 ) | Tenting Height (cm) | RV Systolic Pressure (mm Hg) |
|---|---|---|---|---|---|---|---|
| Normal subjects (n = 20) | 12 | 42.8 ± 16.4 † | 1.6 ± 0.1 † | 2.3 ± 0.2 ⁎ | 0.3 ± 0 † | 0.1 ± 0.2 ⁎ | 22.5 ± 3.3 ⁎ |
| MR (n = 34) | 18 | 55.6 ± 15.2 † | 1.9 ± 0.3 ⁎ | 2.8 ± 0.1 ⁎ | 0.4 ± 0.2 † | 0.4 ± 0.2 ⁎ | 45.7 ± 11.5 ⁎ |
| CTED (n = 32) | 25 | 36 ± 6.7 † | 1.8 ± 0.1 † | 3.8 ± 0.3 ⁎ | 2.1 ± 0.3 ⁎ † | 1 ± 0.2 ⁎ | 53.9 ± 11.3 ⁎ |
| PAH (n = 55) | 38 | 42.3 ± 15.6 ⁎ | 1.7 ± 0.1 † | 3.5 ± 0.3 ⁎ | 1.8 ± 0.4 † | 0.9 ± 0.2 ⁎ | 83.9 ± 26.3 ⁎ |
⁎ Significant difference between groups (analysis of variance and Bonferroni test, p <0.01).
Tricuspid apparatus
Patients with CTED had greater tricuspid annular diameters compared to those with PAH (p <0.01) and MR (p <0.01), while tenting volumes and heights were similar between patients with PAH and those with CTED (p = 0.10 and p = 0.40, respectively). The MR group had the smallest tricuspid annular diameter, tenting volume, and height (p <0.01).
Tricuspid regurgitation
Most patients with PAH (54.6%) ( Figure 1 ) had moderate (30.9%) or severe (23.7%) tricuspid regurgitation, while in the CTED group, most patients had mild tricuspid regurgitation (59.4%), and only 37.5% had moderate tricuspid regurgitation. Only 1 patient with CTED had severe tricuspid regurgitation. Finally, patients with MR had only mild tricuspid regurgitation (85.3%), and just 5 patients had severe tricuspid regurgitation requiring tricuspid valve repair (14.7%) at the same time as mitral valve surgery.
There was no correlation between RV systolic pressure and the RV EF in any of the PH groups (PAH: r = −0.02, p = 0.90; CTED r = −0.10, p = 0.60; MR: r = 0.06, p = 0.70; healthy volunteers: r = 0.06, p = 0.80). There were good correlations between tricuspid regurgitation severity and the RV EF in all groups (PAH: r = −0.70, p <0.01; CTED: r = −0.40, p = 0.01; MR: r = −0.80, p <0.01). Tricuspid regurgitation was also correlated moderately with tenting volume (r = 0.40, p <0.01) and height (r = 0.50, p <0.01), while there was a poor correlation between tricuspid annular diameter and tricuspid regurgitation (r = 0.20, p = 0.02).
Patients with PAH had greater RV end-diastolic volumes (186.4 ± 48.8 ml), RV end-systolic volumes (125.8 ± 29.4 ml), and RV stroke volumes (60.6 ± 15.5 ml) and lower overall RV EFs (33.2 ± 7.7%) compared to those with CTED (p <0.01) and MR (p <0.01) ( Table 3 ). The EFs of patients with MR were different from those of healthy volunteers (p <0.01). Of 55 patients with PAH, 39 (71%) had significant systolic RV impairment, defined as an EF <40% ( Figure 2 ) , 21 of 32 (66%) with CTED (p = NS) and only 9 of 34 patients (26%) with PH related to MR (p <0.01).
| Group | RV End-Diastolic Volume (ml) | RV End-Systolic Volume (ml) | RV Stroke Volume (ml) | RV EF (%) |
|---|---|---|---|---|
| Normal subjects (n = 20) | 74.5 ± 13.8 ⁎ | 30.2 ± 8.4 † | 44.3 ± 6.9 ⁎ | 59.9 ± 5.2 ⁎ |
| MR (n = 34) | 109.4 ± 17.3 ⁎ | 36.5 ± 11.8 † | 72.9 ± 14.6 ⁎ | 66.8 ± 8.7 ⁎ |
| CTED (n = 32) | 113.5 ± 18.2 ⁎ | 72.1 ± 16 ⁎ | 41.3 ± 7.9 ⁎ | 36.8 ± 6.8 ⁎ |
| PAH (n = 55) | 186.4 ± 48.8 ⁎ | 125.8 ± 29.4 ⁎ | 60.6 ± 15.5 ⁎ | 33.2 ± 7.7 ⁎ |
| Total (n = 141) | 135.2 ± 48.8 | 78.2 ± 45.6 | 57 ± 17.6 | 46 ± 16.5 |
⁎ Significant difference between groups (analysis of variance and Bonferroni test, p <0.01).
Patients PAH had reduced LV end-diastolic volumes (85.3 ± 23.7 ml), LV end-systolic volumes (42.6 ± 19.4 ml), and LV stroke volumes (42.1 ± 16.2 ml) but preserved EFs (69.1 ± 12.5%). Similarly, patients with CTED had decreased volumes (LV end-diastolic volume 83.8 ± 21.6 ml, LV end-systolic volume 40.3 ± 14.8 ml, and LV stroke volume 41.8 ± 15.8 ml) and preserved EFs (68.5 ± 13.2%). When the 2 groups were compared, there was no statistical difference between values (p = 0.60). The LV volumes in the MR group were greater compared to those in the PAH and CTED groups (LV end-diastolic volume 95.7 ± 23.6 ml, LV end-systolic volume 49.5 ± 16.1 ml, LV stroke volume 36.7 ± 18.9 ml, and LV EF 62.6 ± 10.8%, p <0.05 for each).
The mobility of the tricuspid valve was assessed after measuring the excursion angles of all leaflets during systole and diastole. The detailed excursion angles are listed in Table 4 . The overall tricuspid mobility in patients with CTED was reduced compared to the PAH group for all leaflets. The tricuspid valve mobility of patients with MR was also reduced compared to the normal subjects for all leaflets (p <0.01), but it was greater compared to patients with CTED and those with PAH.
| Group | Θ SD (°) | Θ SS (°) | Θ PD (°) | Θ PS (°) | Θ AD (°) | Θ AS (°) |
|---|---|---|---|---|---|---|
| Normal subjects (n = 20) | 84.8 ± 2.4 ⁎ | 11.7 ± 1.5 ⁎ | 86.1 ± 2 ⁎ | 11.9 ± 1.6 ⁎ | 85 ± 2.5 ⁎ | 11.8 ± 1.4 ⁎ |
| MR (n = 34) | 74.7 ± 2.6 ⁎ | 18.4 ± 1.3 ⁎ | 75.1 ± 3.4 ⁎ | 17.6 ± 1.9 ⁎ | 76.5 ± 3.3 ⁎ | 18.5 ± 2.3 ⁎ |
| CTED (n = 32) | 54.5 ± 3 ⁎ | 36.6 ± 2.1 ⁎ | 56.8 ± 2.1 ⁎ | 35.7 ± 2 ⁎ | 55.6 ± 1.9 ⁎ | 34.6 ± 2.2 ⁎ |
| PAH (n = 55) | 61.7 ± 3.2 ⁎ | 29.2 ± 2.8 ⁎ | 57.9 ± 3.4 ⁎ | 32.9 ± 2.3 ⁎ | 58.2 ± 3.6 ⁎ | 31.4 ± 1.6 ⁎ |
Stay updated, free articles. Join our Telegram channel

Full access? Get Clinical Tree


