Chapter 8 Monitoring
Monitoring, particularly of the cardiovascular and respiratory systems, is an integral part of the care of critically ill patients. Advances in technology have resulted in the widespread use of integrated monitoring systems capable of displaying multiple parameters simultaneously on bedside screens. Although most observers would agree that patient care is improved by sophisticated monitoring, it has proven difficult to confirm this objectively. For instance, the value of pulse oximetry is almost universally accepted, but a large randomized trial involving more than 20,000 patients was unable to demonstrate a survival benefit from using this monitoring tool.1,2 Thus, it is not surprising that for complex, user-dependent monitors such as echocardiography and the pulmonary artery catheter (PAC), an outcome benefit has not been clearly demonstrated and, at least in the case of the PAC, considerable controversy has resulted regarding its ongoing use.3–5
In this chapter, a number of monitors that are used in the intensive care unit (ICU) are discussed. Additional topics are discussed elsewhere: blood gas monitoring in Chapter 31; respiratory monitoring in Chapter 27; echocardiography in Chapter 7; neuromuscular monitoring in Chapter 4; and routine postoperative monitoring in Chapter 17. The techniques of insertion and the complications of intravascular catheters are outlined in Chapter 40.
PULSE OXIMETRY
Despite the absence of a demonstrable survival advantage, pulse oximetry has been identified as the single most useful monitor for the prevention of adverse patient events,6 and it is used routinely on virtually all patients in the ICU. Pulse oximetry utilizes the fact that the absorption spectra of blood vary depending on its oxygen saturation: oxygenated blood appears red, and deoxygenated blood appears blue. A standard oximeter probe contains two light-emitting diodes: one that emits red light (wavelength 660 nm) and one that emits near-infrared light (wavelength 940 nm). The ratio of light absorption at the two wavelengths is detected and used to calculate oxygen saturation. Light that passes through tissues is absorbed by arterial blood, capillary blood, venous blood, and nonblood components (bone, muscle, etc.). By eliminating the nonpulsatile component of light absorption, the oxygen saturation of arterial blood can be estimated. Arterial oxygen saturation obtained from a pulse oximeter is designated SPO2 to distinguish it from arterial oxygen saturation obtained from a blood gas analyzer, which is designated Sao2. In addition to SPo2, pulse oximeters measure heart rate and generate a pulse waveform, which provides a crude measure of peripheral perfusion. These secondary functions are useful when the pulse oximeter is used as the sole monitor.
Despite the obvious advantages of being able to rapidly and noninvasively assess arterial oxygen saturation, it must be remembered that pulse oximetry does not guarantee the adequacy of either oxygen delivery (see Equation 1-14) or ventilation (see Equation 1-17). In the presence of profound anemia, marked tissue hypoxemia can arise despite a normal SPo2. In patients to whom supplemental oxygen is being administered, profound hypoventilation and respiratory acidosis can be present in spite of a normal SPo2.
ELECTROCARDIOGRAPHY
The electrocardiograph (ECG) is essential for the diagnosis of cardiac arrhythmias and is extremely useful for the identification of myocardial ischemia and infarction. Also, specific ECG abnormalities provide supporting evidence for a wide range of cardiac disorders. The physiologic basis of the ECG and its relationship to the action potential is discussed in Chapter 1. Specific ECG abnormalities are covered in the relevant chapters, particularly 8 and 21.
Leads and Electrodes
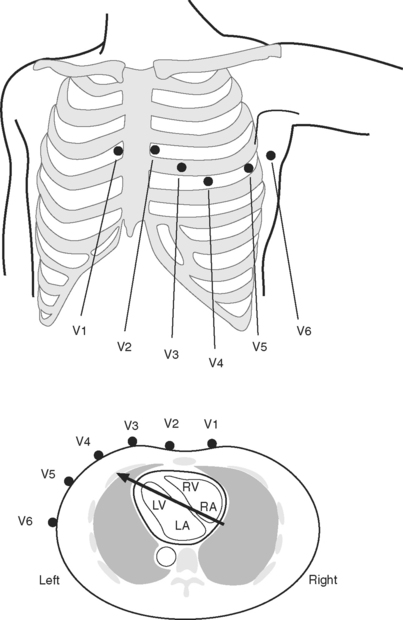
The standard 12-lead ECG involves the placement of 10 electrodes on the patient in specific positions: one on each limb and six across the chest (Fig. 8-1). To ensure good contact between skin and electrode, the skin should be first cleaned with alcohol, gently abraded with fine sandpaper and, if necessary, shaved. From these 10 electrodes, 12 leads are recorded. A lead is obtained by recording the difference in electrical potential between two electrodes. Leads may be either bipolar or unipolar. With a bipolar lead, the signal is obtained from two active electrodes: one connected to the positive pole and one connected to the negative terminal of the ECG machine. With a unipolar lead, the signal is obtained using one active electrode (connected to the positive pole of the ECG machine) and an indifferent electrode, recorded at zero potential by connecting two or three limb electrodes through a resistor to the negative terminal of the electrocardiograph.
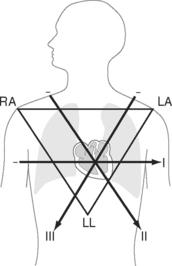
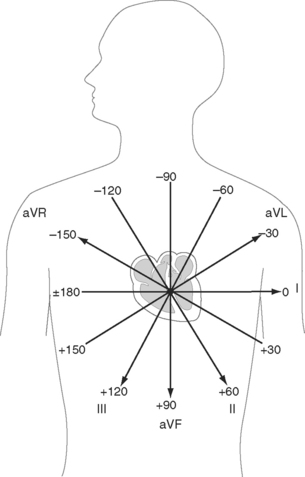
Six leads view the heart in the frontal plane (I, II, III, aVR, aVL, aVF) and six leads (V1 through V6) view the heart in the horizontal plane. The three standard leads (I, II, III) are bipolar leads; each lead records the potential difference between two limbs (Fig. 8-2). The augmented limb leads (aVR, aVL, aVF) are unipolar leads that record the potential difference between one limb and an indifferent composite electrode: aVR is obtained from the right arm; aVL from the left arm, and aVF from the left leg. The standard and augmented limb leads record the magnitude of the electrical signal in specific directions within the frontal plane, as shown in Fig. 8-3. The chest leads are unipolar leads that record the potential difference between the surface of the chest and an indifferent composite electrode. The orientation of the chest leads to the heart in the horizontal plane is shown in Figure 8-1.
Types of Electrocardiograms: 12-Lead, 5-Lead, and 3-Lead Systems
For accurate diagnosis of myocardial ischemia or cardiac arrhythmias, a standard 12-lead ECG should always be obtained. In patients who have undergone recent cardiac surgery, the sternal dressing may preclude obtaining leads V1, V2, and V3. For continuous ECG monitoring in the intensive care unit (ICU) or coronary care unit it is usual to use a 5-electrode system involving electrodes attached to each of the four limbs and a chest electrode attached at the V5 position. For convenience and to reduce motion artifact, the limb leads are normally placed on the shoulders and hips. From these five electrodes, seven leads can potentially be obtained (I, II, III, aVR, aVL, aVF, V5); it is usual to display simultaneously leads II and V5 on the patient monitor. (Somewhat confusingly, this arrangement is commonly referred to as a 5-lead ECG.) P waves are usually most clearly identified in lead II, therefore this lead is usually the best for diagnosing cardiac arrhythmias. V5 is the most sensitive lead for diagnosing myocardial ischemia.
Interpretation of the 12-Lead ECG
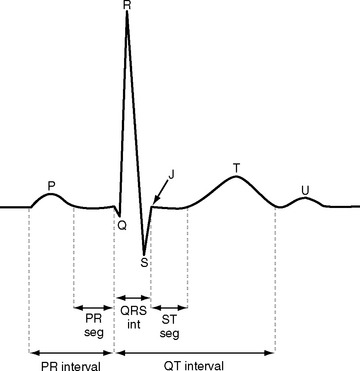
ECGs are recorded onto a grid pattern composed of large and small squares. Large squares have dimensions of 5 mm by 5 mm and represent 0.5 mV on the vertical axis and 0.2 sec on the horizontal axis, assuming standard sweep and gain settings. Small squares have dimensions of 1 mm by 1 mm and represent 0.04 sec in the horizontal axis and 0.1 mV in the vertical axis. The various components of an individual ECG complex are shown in Figure 8-4. A normal 12-lead ECG is shown in Figure 8-5.
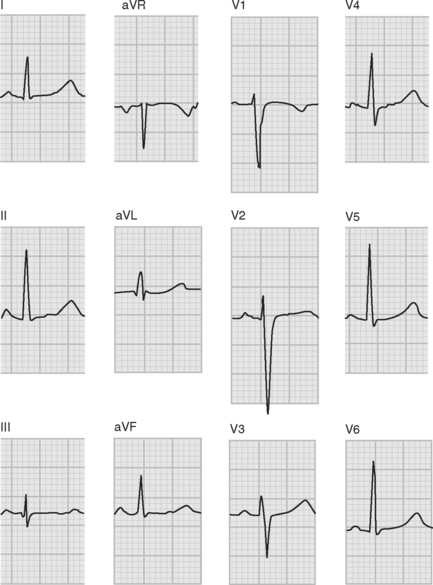
Figure 8.5 A normal 12-lead ECG. The frontal plane axis is 30 degrees; see text for details.
(Image modified from Wagner GS: Marriot’s Practical Electrocardiography, ed. 9. Fig. 2.10, p. 30. Philadelphia, Lippincott Williams and Wilkins, 1994.)
PR Interval
The normal PR interval is 0.10 to 0.22 seconds and is determined by the speed of conduction through the atrioventricular node. The PR interval varies inversely with heart rate and gradually lengthens with increasing age. A short PR interval is seen in some preexcitation syndromes, and a long PR interval is seen in first-degree and Wenckebach-type second-degree heart block (see Chapter 21).
QRS
The Q wave is a small negative deflection that precedes the R wave. Small Q waves (<0.03 seconds in duration) are a normal finding in all leads except V1 through V3, where they are always pathologic. Q waves of any size may be normal in leads III and aVR. Pathologic Q waves are indicative of transmural myocardial infarction (see Chapter 18). They develop within a few hours of infarction and are permanent.
QRS Axis
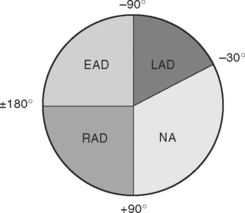
The net direction of current flow in the heart at any moment can be represented as a vector. If the vector is directed toward a particular lead during ventricular depolarization, the QRS complex is predominantly positive (R wave > S wave). If the vector is directed away from that lead, the QRS is predominantly negative (S wave > R wave). If the vector is perpendicular to the lead, the R wave and S wave are equal. The direction of depolarization through the ventricles in the frontal plane is called the QRS axis and is determined by examination of the six limb leads (I, II, III, aVL, aVR, aVF). The following steps can be used to determine the frontal-plane QRS axis (see Fig. 8-3):
Figure 8-6 shows the normal range for the frontal-plane QRS axis along with the criteria for the diagnosis of left, right, and extreme axis deviation. Common causes of axis deviation are listed in Table 8-1.
Table 8-1 Causes of Deviation in the Frontal Plane QRS Axis
| Left Axis Deviation |
| Left anterior hemiblock (Table 21-1) |
| Inferior myocardial infarction |
| COPD |
| Left ventricular hypertrophy |
| Wolff-Parkinson-White syndrome |
| Right Axis Deviation |
| Left posterior hemiblock (Table 21-1) |
| Right ventricular hypertrophy (including COPD) |
| Lateral or apical myocardial infarction |
| Wolff-Parkinson-White syndrome |
| Extreme Axis Deviation (rare) |
| Practical |
| Ventricular tachycardia |
| Right ventricular hypertrophy |
| Apical myocardial infarction |
| Hyperkalemia |
COPD, chronic obstructive pulmonary disease.
Ventricular Hypertrophy and Strain
Given that the net direction of current flow during ventricular systole is from the base to the apex of the heart and is dominated by the left ventricle, then based on Figure 8-1 it can be appreciated that the QRS complexes in leads V1 and V2 are normally negative, and the QRS complexes in leads V5 and V6 are normally positive. With right ventricular hypertrophy, the electrical axis in the horizontal plane shifts rightward, resulting in a progressive increase in R wave amplitude in leads V1 and V2 such that with severe right ventricular hypertrophy, the QRS becomes positive in these leads. In contrast, with left ventricular hypertrophy there is accentuation of the normally dominant R wave in V5 and V6 and the development of deep S waves in V1 and V2. Ventricular hypertrophy may also result in ST segment depression and T wave inversion (strain pattern), which may be difficult to distinguish from ischemia. The ECG findings in right and left ventricular hypertrophy are summarized in Table 8-2.
Table 8-2 ECG Findings in Ventricular Hypertrophy
| Abnormality | Left Ventricular Hypertrophy | Right Ventricular Hypertrophy |
|---|---|---|
| QRS conduction | Partial or complete left bundle branch block | Partial or complete right bundle branch block |
| Strain pattern (ST segment depression and T wave inversion) | Leads V3-V6 | Leads V1-V3 |
| Vertical plane | Leftward shift in QRS axis | Rightward shift in QRS axis |
| Horizontal plane | Large S waves in V2 and V3 | Large R waves in V1 and V2 with severe hypertrophy, the QRS complex may become positive |
| Large R waves in V5 and V6 | ||
| Atrial hypertrophy | P-mitrale: bifid P waves in II, II, aVF | P-pulmonale: peaked P waves in II, II, aVF |
ST Segment
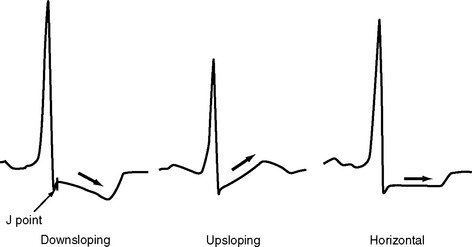
The ST segment is measured from the J point (the point where the ST segment meets the QRS complex) to the beginning of the T wave (see Fig. 8-4). Slight (<1 mm) upsloping, downsloping, or horizontal ST segment depression is a normal variant. Up to 4 mm of ST segment elevation in leads V1 through V3 may also be a normal finding, especially in young males.
Pathologic ST segment elevation may indicate myocardial infarction, left ventricular aneurysm, pericarditis, or bundle branch block. With myocardial infarction, ST segment elevation usually develops within a few minutes and resolves within 24 to 48 hours. The distribution of ST segment elevation can be used to help localize the zone of infarction (see Chapter 18). ST segment elevation across a wide range of leads is common following cardiac surgery and probably represents a pericardial reaction. A clue to this diagnosis is that the ST segment elevation is usually mild and is not limited to a specific coronary territory.
ST segment depression is commonly associated with myocardial ischemia but is also seen with ventricular strain, digoxin therapy, hypokalemia, and conduction abnormalities such as bundle branch block. Mild upsloping ST segment depression is seen with tachycardia. ST segment depression due to ischemia is typically horizontal or downsloping (Fig. 8-7). Upsloping ST depression is not usually indicative of ischemia. Unlike ST segment elevation, the distribution of ST segment depression does not reliably localize the region of ischemia.
