Fig. 3.1
Assessment of global LV volume
Importantly, reference values for 3D echocardiography-derived LV volumes and LVEF have been published from a large cohort of subjects free of cardiovascular disease, hypertension and diabetes mellitus [9].
3.1.2 Assessment of Left Ventricular Mass
Echocardiography is more sensitive than electrocardiography in diagnosing LVH, and this is more important in patients with moderate total CV risk, as it may refine the risk evaluation by detecting LVH undetected by ECG [10].
It is well known that accurate assessment of LV mass in patients without major distortions of LV geometry is performed with an anatomically validated formula using primary measurement of left ventricular internal dimension [11], posterior wall thickness and septal wall thickness at end diastole, respectively. In patients with distorted LV geometry, LV mass can be assessed by the area-length formula and the truncated ellipsoid formula, from short-axis and apical four-chamber 2D echocardiographic views [11].
Measurement of LV mass relies on both endocardial and epicardial visualizations, with the latter being more difficult because of problems in identifying the epicardial border. As with measurements of LV volumes, there are also other limitations such as difficult assessment due to foreshortening. Several studies have reported significant improvement in the accuracy, inter- and intra-observer variability and reproducibility of estimation of LV mass with the use of 3D echocardiography compared to their traditional M-mode and 2D techniques [12, 13] (Fig. 3.2). It can also be applied in patients with ischaemic cardiomyopathy (IC) in whom the assessment of LV mass is challenging because it is based on geometric assumptions. In IC patients 3D echocardiography is more accurate and reliable considering the measurement of LV mass than 2D echocardiography [14].
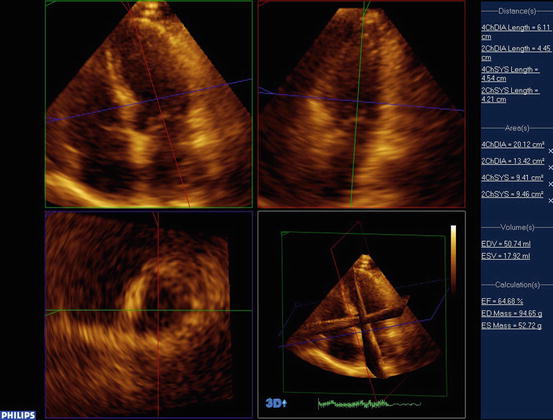
Fig. 3.2
Assessment of LV mass
Real-time 3DE has also been proved to be useful in detecting even a mild increase of the LV mass in new-onset arterial hypertension where the patients are too young to produce evidence of clear-cut LVH [15].
Accordingly, this has clinical implications for the serial assessments of the severity of LVH in patients with systemic hypertension.
3.1.3 Contrast-Enhanced Real-Time 3D Echocardiography
Recently, contrast-enhanced real-time 3D echocardiography (CE RT 3DE) has been shown to have improved the accuracy of left ventricular volumes and EF measurements in patients with poor acoustic windows without significantly affecting those in patients with optimal images. In addition, CE RT 3DE imaging improved the reproducibility of the measurements, as reflected by a decrease in intermeasurement variability [16]. This approach allows quantification of global as well as regional LV function, when used with selective dual triggering at end systole and end diastole to reduce the destructive effects of ultrasound on contrast-enhancing microbubble agents (Fig. 3.3). Thus, this methodology may become the new standard for LV size and function, which will be particularly important in patients with poor acoustic windows or contraindications to CMR.
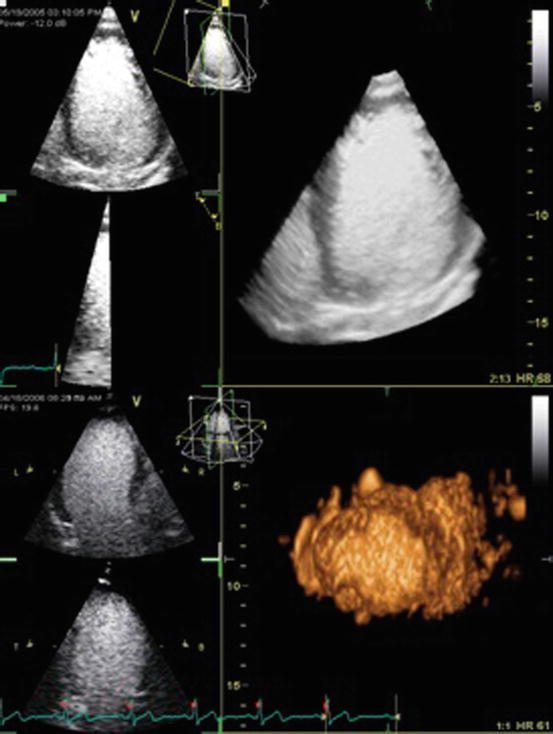
Fig. 3.3
Contrast-enhanced real-time 3D echocardiography
3.1.4 3D Speckle Tracking
Technological advancement of real-time 3D echocardiography has developed software that tracks the motion of speckles irrespective of their direction and allows to obtain a homogeneous spatial distribution of all three components of the myocardial displacement vector [17]. The main advantage of 3D speckle tracking echocardiography is the possibility of analysing the whole left ventricle from a single volume of data obtained from the apical transducer position. In addition, its use considerably reduces the time duration of analysis to one-third in comparison with 2D speckle tracking echocardiography [18].
Global area 3D strain has recently been shown to be a comprehensive parameter of myocardial systolic deformation and is very sensitive to both changes of afterload and LV mass. In a recent study that included native, untreated hypertensive patients, global area 3D strain was precautiously reduced, and longitudinal and radial strain impaired, while circumferential strain was still preserved, supporting a normal LV chamber systolic function. Reduction of global area strain was independently associated with both pressure overload and magnitude of the LV mass [15]. Interestingly, global area 3D strain has been proven to be the only parameter which was at the same time an independent predictor of LV mass, 2D LV ejection fraction and LV global function. The 3D speckle tracking technique revealed that the subjects with high-normal blood pressure suffered subclinical impairment of LV mechanics similar as the hypertensive patients [19]. 3D global longitudinal, circumferential, radial and area strains were also demonstrated to be significantly impaired in patients with uncontrolled and untreated hypertension in comparison with controls and well-controlled hypertensive patients, and functional capacity seems to be independently associated with 3D global longitudinal strain [20].
3.1.5 Diastolic Function
Hypertension predominantly affects diastolic LV function before altering systolic function. Echocardiography is the most widely used technique for the evaluation of LV filling, which mostly relies on Doppler evaluation of transmitral and pulmonic flow patterns as well as mitral annular velocities. Currently, no real-time 3D echocardiographic indices are recommended by the guidelines for the assessment of diastolic dysfunction.
Interestingly recently the following 3D indices have been used for the estimation of diastolic LV function [21]: volume at 25, 50 and 75 % of filling duration in per cent of end-diastolic volume (volume index) and rapid filling volume fraction. Temporal indices included filling duration in % of RR and rapid filling duration in % of filling duration. Additionally, longitudinal, radial and circumferential strains at 25, 50 and 75 % of filling duration were calculated. End-diastolic volume index and rapid filling volume fraction showed a biphasic pattern with the severity of diastolic dysfunction characterized by an initial decrease (grade 1), a pseudo-normalization (grade 2) and then an increase above normal (grade 3). Filling duration progressively decreased with the severity of diastolic dysfunction. Rapid filling duration was significantly increased in all 3 groups compared to normal. After normalization by peak systolic values, all three strain components showed a linear pattern with the severity of diastolic dysfunction, suggesting potential clinical usefulness.
3.1.6 Assessment of Left Atrial Structure and Function
Measurement of left atrial (LA) volume is an essential component of the comprehensive assessment of LV diastolic function [22]. Although LA volume by 2D echocardiography provides prognostic information, the misalignment of the 2D cutting plane of the left atrium could make the measurements inaccurate. LA volumes can be easily obtained by 3D echocardiography, and improved accuracy and reproducibility of the 3D approach have been demonstrated at the cost of more elaborate offline analysis in studies that compared 2D and 3D echocardiographic measurements of atrial volumes against an independent gold standard such as cardiovascular magnetic resonance imaging [23, 24] (Fig. 3.4). 3D echocardiography has been recently shown to classify LA dilatation more accurately than 2D echocardiography, resulting in fewer patients with undetected atrial enlargement and potentially undiagnosed diastolic dysfunction [25]. In another recent study minimum LA volume at end diastole measured by real-time 3D echocardiography has been shown to be more strongly correlated to LV diastolic function and LV filling pressure than maximum LA volume, and LV longitudinal systolic function has been demonstrated to be a strong determinant of the LA reservoir function [26].
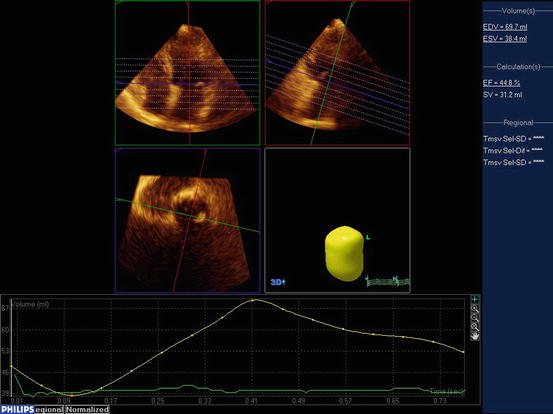
Fig. 3.4
Assessment of LA volume
Apart from estimation of LA structure, estimation of LA function remains a challenge. During the cardiac cycle, LA acts as a reservoir, receiving pulmonary venous return during LV systole; as a conduit, passively transferring blood to the LV during early diastole; and as a pump actively priming LV in late diastole. In normal subjects, the reservoir, passive conduit and pumping phases account for approximately 40, 35 and 25 % of the atrial contribution to stroke volume, respectively [27].
3D speckle tracking echocardiography has been used for quantitative evaluation of LA function in essential hypertension patients with different patterns of left ventricular geometric models. Left atrial booster pump function is demonstrated to decrease in patients with the eccentric hypertrophy pattern, while left atrial conduit function is reported to be unchanged in the normal pattern and the concentric remodelling pattern groups [28]. Additionally, 3D speckle tracking enables the measurement of both LA strain and synchrony with excellent reproducibility and appears to be more accurate compared with 2D LA strain for identifying hypertensive patients with paroxysmal atrial fibrillation [29].
Conclusively, 3D echocardiography is a novel technique that permits accurate and reproducible assessment of left ventricular mass and left ventricular volumes in comparison to the gold standard technique—CMR. Further studies are necessary for the implementation of 3D echocardiography in the evaluation of left atrial structure and function and left ventricular diastolic function.
3.2 Cardiac Computed Tomography in Hypertension
Cardiac computed tomography (CT) is not currently a first-line exam in the evaluation of hypertensive patients. Coronary CT angiography is considered to be its most popular and fascinating application since it permits the visualization of coronary anatomy in a non-invasive way.
According to the appropriateness criteria for cardiac computed tomography, CT angiography of the coronary arteries is generally acceptable for the evaluation of chest pain syndrome in patients with intermediate pretest probability of coronary artery disease who have either an inconclusive ECG or who cannot exercise [30]. Moreover, CT angiography is suggested for patients with acute chest pain with intermediate pretest probability of coronary artery disease with negative enzymes and without ECG changes [30]. The use of 64-slice multi-detector computed tomography (MDCT) has a sensitivity of 93 % and a specificity of 96 % in detecting coronary artery stenosis [31, 32]. In this regard, CT coronary angiography has an excellent negative predictive value, while positive predictive value is low, and therefore an exam with normal findings can practically rule out coronary artery disease [31].
Cardiac CT is additionally used for coronary plaque imaging. The straight relation between coronary arteries’ amount of calcium and atherosclerotic plaque burden has already been established [31, 33]. Coronary artery calcium (CAC) can be observed with electron beam computed tomography (EBCT) as well as with MDCT, and for its quantification, among the different methods suggested, ‘Agatston score’ is the most common [31]. According to the 2010 ACCF/AHA guidelines for assessment of cardiovascular risk in asymptomatic adults, CAC evaluation can be performed in asymptomatic adults at intermediate risk (class II a), while adults at low risk have no benefit from this method [34].
Another application of cardiac CT is in the assessment of cardiac morphology and function; nevertheless, it is improbable to become the method of choice for this purpose. This is mostly due to the radiation exposure and the contrast material used [31]. As a matter of fact, myocardial mass, left and right end-systolic and end-diastolic volumes, ejection fraction and stroke volume can be calculated in this way with great accuracy [30, 31]. As far as calculation of left ventricular function is concerned, different studies have indicated the good correlation between CT and MRI as well as between CT and echocardiography in this field [31, 35–37].
In patients with atrial fibrillation, MDCT has been used in the evaluation of the pulmonary vein’s anatomy preceding ablation procedures along with the assessment of pulmonary vein stenosis following the above procedure. Furthermore, the appropriateness criteria for cardiac CT suggest its use prior to ablation [30].
Moreover, the use of CT angiogram is appropriate for the estimation of a suspected thoracic aortic aneurysm or an aortic dissection, and CT can be also employed in the diagnosis of the secondary causes of hypertension [30].
3.3 Magnetic Resonance in Hypertension
The indications of cardiovascular magnetic resonance imaging (CMR) have been greatly broadened. However, CMR is not among the first diagnostic procedures followed in patients with systemic hypertension. In these patients, the assessment of target organ damage is without a doubt a very important objective. In this regard, the 2013 ESC/ESH guidelines for the management of arterial hypertension suggest that cardiac magnetic resonance imaging should be considered for the assessment of left ventricle size and mass when the image quality obtained by echocardiography is poor and when imaging of delayed enhancement would have therapeutic consequences [38]. In the same guideline’s edition, stress cardiac magnetic resonance is recommended in hypertensive patients when the exercise electrocardiogram (ECG) results are inconclusive in order to achieve a valid identification of myocardial ischaemia [38]. The detection of identifiable causes of hypertension is also a major objective in hypertensive patients. The same guidelines suggest as an additional or confirmatory test for pheochromocytoma an MRI of the abdomen and pelvis as well as an MR angiography for the detection of renal artery stenosis [38].
CMR appears to contribute to a global assessment of hypertensive cardiovascular disease by the following means:
It has been applied for the measurement of left and right ventricular dimensions, volumes, mass and systolic function. Furthermore, CMR has been proposed as the gold standard method for the assessment of ventricular volumes, mass and function due to its accuracy and reproducibility [39–41]. The standardized cardiovascular magnetic resonance protocols used for this purpose have been described in detail [42]. Additionally, reference ranges have been established [43]. Emphasis must be given to the fact that CMR can determine the pattern of LVH and provide an answer regarding its cause [39]. Moreover, focal myocardial fibrosis encountered in hypertensive heart disease can be visualized by late gadolinium enhancement (LGE) CMR, while other sequences are being tested in order to detect diffuse myocardial fibrosis [39].
CMRI has also been proposed as the gold standard for the measurement of LA volume although 3D echocardiography seems to gain ground [44, 45]. In addition, references regarding left atrial dimensions and volumes have been published [46]. Different CMR techniques have been employed in order to assess diastolic function; nevertheless, in this field echocardiography remains the technique of choice [39].
Stay updated, free articles. Join our Telegram channel

Full access? Get Clinical Tree


