Miscellaneous Lesions


Miscellaneous Lesions


Pericardial Disease

A small amount of pericardial fluid is normally present between the visceral and parietal pericardium (approximately 20 to 30 mL). Larger collections present as an echo-free space. While three-dimensional echocardiography, or computerized tomography (CT) or magnetic resonance imaging (MRI) permit precise quantification of the amount of pericardial fluid, such numbers are seldom, if ever, used. Hence, a semiquantitative approach is used. A pericardial effusion is regarded as small when the maximum width is <10 mm, moderate when the maximum width is between 10 mm and 15 or 20 mm and large beyond that. In addition to the size, the rate at which the effusion accumulates determines its physiologic significance. Slower accumulation allows a gradual increase in the compliance of the pericardium, sometimes allowing massive effusions to form without tamponade. Diastolic collapse of the right atrium and/or right ventricle suggests cardiac tamponade; the latter is more specific than the former.

When both a pleural and a pericardial effusion are present, the width of the pericardium can often be measured, a point in the differential diagnosis of constrictive pericarditis (constrictive pericarditis generally causes thickening of the pericardium to >5 mm).

Most often, pericardial effusions can be adequately worked up with transthoracic echocardiography but the same information is available through transesophageal echocardiography.

Pericardial cysts are benign collections of fluid that abut and distort the border of the heart. Color flow Doppler can be used to rule out fluid flow within the structure. MRI and CT can confirm the diagnosis and provide an insight regarding the anatomic topography of the cyst.


Other Miscellaneous Lesions

Examples of a variety of other lesions including pleural effusion, right heart catheters with associated thrombus, pacemaker wires, pacemaker vegetations, artifacts, contrast effects during cardiac surgery, left ventricular assist devices, and intraaortic balloon pumps are shown in this chapter.
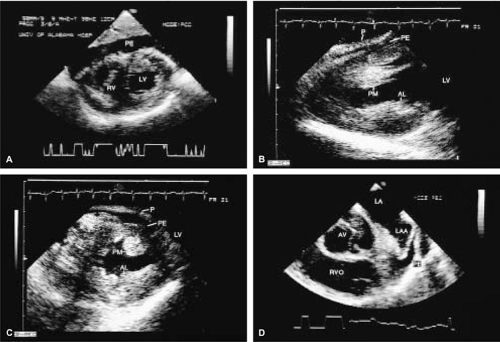
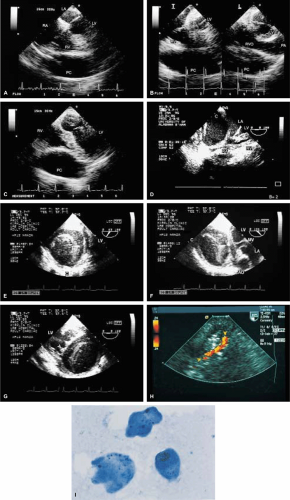
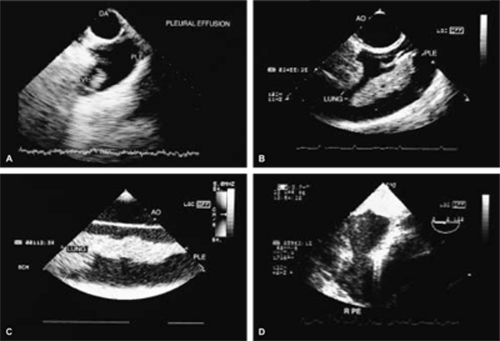
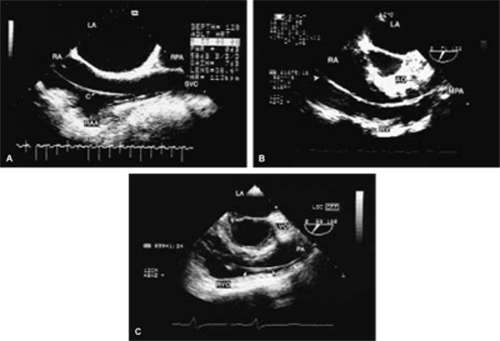
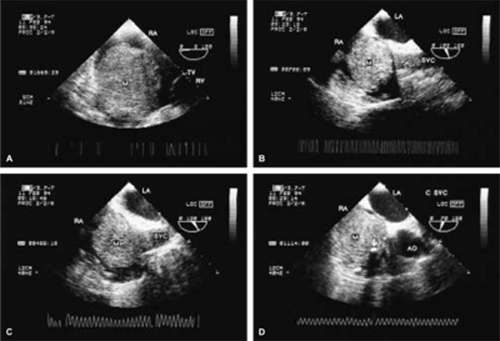
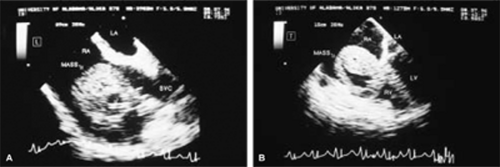
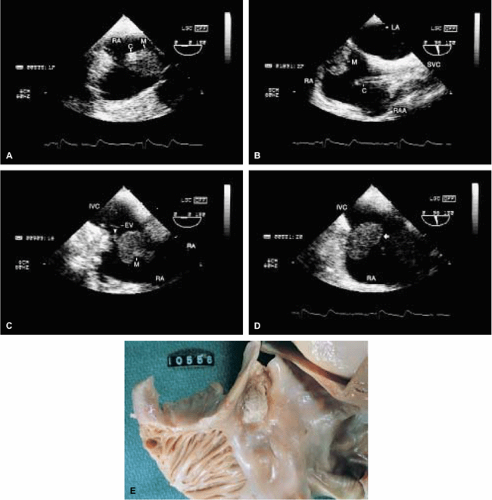
FIGURE 10.1. Pericardial effusion. A–C. Transgastric views demonstrate pericardial effusion (PE) behind the right ventricle (RV). The pericardium (P) is mildly thickened. AL, anterior papillary muscle; PM, posterior papillary muscle. D. PE around the left atrial appendage (LAA). AV, aortic valve; LA, left atrium; LV, left ventricle; RVO, right ventricular outflow tract.


FIGURE 10.2. Pericardial cyst. A–C. A large pericardial cyst (PC) located anteriorly with compression of the right ventricle (RV) (C). D. Intraoperative examination in another patient shows a large pericardial cyst (C) located lateral to the left atrium (LA) and right atrium (RA). This frame was taken after cardioplegic arrest of the heart, when the cardiac chambers were empty and collapsed. E–I. An 18-year-old man had a pericardial hydatid cyst (C) compressing the left ventricle (LV) lateral wall (arrowheads in G). The linear echoes in the cyst represent the laminated hydatid membrane. Prominent intramyocardial coronary arteries (arrowheads in H) with high velocity flow were imaged within the compressed LV lateral wall, consistent with coronary flow obstruction. This was confirmed by coronary angiogram, which showed systolic emptying of the first marginal branch of the circumflex coronary artery. The cyst was surgically resected. I. Microscopic examination of the hydatid cyst fluid shows typical scolices, one of which contains hooklets. AO, aorta; MV, mitral valve; PA, pulmonary artery; RVO, right ventricular outflow tract.


FIGURE 10.3. Pleural effusion. A. A large left pleural effusion (PLE) with a villus (VI) is present behind the descending thoracic aorta (DA). B,C. Large left pleural effusions (PLE) in two other patients are imaged behind the aorta (AO) in the short-axis (B) and long-axis (C) views. D. A right pleural effusion (RPE) in another patient.


FIGURE 10.4. Right heart catheter. C in A and arrowheads in B and C indicate a long segment of a Swan-Ganz catheter in the right heart. AO, aorta; LA, left atrium; LVO, left ventricular outflow tract; MPA, main pulmonary artery; PA, pulmonary artery; RA, right atrium; RAA, right atrial appendage; RPA, right pulmonary artery; RV, right ventricle; RVO, right ventricular outflow tract; SVC, superior vena cava.


FIGURE 10.5. Right heart catheter thrombus. A–C. A large mass (M) is noted in the right atrium (RA). D. Further examination demonstrated a catheter (arrow) embedded in the mass, leading to the diagnosis of catheter-induced thrombus. AO, aorta; LA, left atrium; RV, right ventricle; SVC, superior vena cava; TV, tricuspid valve.


FIGURE 10.6. Denver peritoneovenous shunt thrombus. A 41-year-old man with Laennec cirrhosis and a Denver peritoneovenous shunt presented with recurrent episodes of syncope whenever he sat up or stood. The Denver shunt and the massive thrombus were successfully removed surgically. A. Longitudinal plane examination demonstrates a large right atrial mass (maximum size, 5.5 × 4.5 cm) attached to the anterior wall of the superior vena cava (SVC) near its entrance into the right atrium (RA). The arrow points to a portion of the Denver shunt that is seen embedded in the mass. The inferior vena cava was not involved. B. Transverse plane examination also visualized the mass well and demonstrated a portion of it protruding into the right ventricle (RV) through the tricuspid orifice. The relationship of the mass to the superior vena cava could not be visualized in this plane, however. There were prominent echo-free spaces in the tumor mass. LA, left atrium; LV, left ventricle. (Reproduced with permission from
Holman WL, Coghlan CH, Dodson MR, et al. Removal of massive right atrial thrombus guided by transesophageal echocardiography. Ann Thorac Surg 1991;52:313–315.


)


FIGURE 10.7. Right heart catheter thrombus. The bright echoes in the right atrium (RA) in A and B are caused by the infusion catheter (C). This is the typical appearance of a catheter, which appears thicker in A than its real size because of the presence of reverberations. Catheter-induced thrombus in the RA is well seen (M in A–C and arrow in D). The arrowhead in C shows an attachment of the thrombus to the RA wall near the eustachian valve (EV). E. Gross specimen shows a catheter-induced thrombus in the RA. IVC, inferior vena cava; LA, left atrium; RAA, right atrial appendage; SVC, superior vena cava.


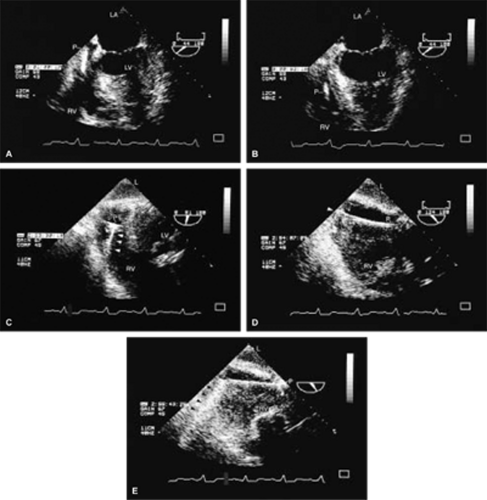
FIGURE 10.8. Pacer lead in the right ventricle. The pacer lead (P) is seen in the right atrium (RA) and right ventricle (RV) in the four-chamber view (A,B), but the location of its tip in the RV apex (arrowhead in D) is identified only using the transgastric approach (D,E). The metal in the electrode tip produces prominent reverberations (black arrowheads in E) that assist in locating it. Other portions of the pacer may also produce reverberations (white arrowheads in C). L, liver; LA, left atrium; LV, left ventricle.


Only gold members can continue reading. Log In or Register to continue

Stay updated, free articles. Join our Telegram channel

Jun 15, 2016 | Posted by in CARDIOLOGY | Comments Off on Miscellaneous Lesions

Full access? Get Clinical Tree

Get Clinical Tree app for offline access