Acute kidney injury (AKI) after coronary artery bypass grafting (CABG) is associated with adverse outcomes. This study investigated if already a minimal change of 0 to 0.3 mg/dl in postoperative serum creatinine values was associated with early death and long-term cardiovascular outcomes and death. From the SWEDEHEART registry, we included 25,686 patients who underwent elective, isolated, primary CABG in Sweden from 2000 to 2008. AKI was categorized according to increases in postoperative creatinine values: group 1, 0 to 0.3 mg/dl; group 2, 0.3 to 0.5 mg/dl; and group 3, >0.5 mg/dl. The primary outcome measure was death from any cause. During a mean follow-up of 6 years, there were 4,350 deaths (17%) and 7,095 hospitalizations (28%) for myocardial infarction, stroke, heart failure, or death (secondary outcome). The adjusted odds ratios (95% confidence interval [CI]) for early mortality in AKI groups 1 to 3 were 1.37 (0.84 to 2.21), 3.64 (2.07 to 6.38), and 15.4 (9.98 to 23.9), respectively. For long-term mortality, the corresponding hazard ratios (95% CI) were 1.07 (1.00 to 1.15), 1.33 (1.19 to 1.48), and 2.11 (1.92 to 2.32), respectively. There was a significant association between each AKI group and the composite outcome (HR 1.09, 95% CI 1.03 to 1.15; HR 1.39, 95% CI 1.27 to 1.52; and HR 1.99, 95% CI 1.84 to 2.16, respectively). In conclusion, already a minimal increase in the postoperative serum creatinine level after CABG was independently associated with long-term all-cause mortality and cardiovascular outcomes, regardless of preoperative renal function.
Acute kidney injury (AKI) affects 12% to 17% of patients who are undergoing coronary artery bypass grafting (CABG). Even a small increase in the postoperative serum creatinine level after cardiac surgery is associated with not only early but also long-term mortality. Patients who develop AKI have an increased risk of worsening renal function, new-onset heart failure, and future cardiovascular events. Current definitions of AKI are plentiful and differ in their criteria and requirements for diagnosis, which leads to ambiguities in diagnostic classification. It is possible to assess AKI using either absolute or relative changes in serum creatinine levels. It may be better to use absolute changes as advocated by the AKI Network (AKIN). Three studies have shown that minimal absolute changes in postoperative creatinine values can predict early mortality after CABG. However, these were single-center studies and did not report long-term outcomes. In a nation-wide study, we aimed to investigate if already minimal changes in serum creatinine values, below the current definitions of AKI, could predict long-term mortality and cardiovascular events after CABG.
Methods
The study population was collected from the Swedish Web-system for Enhancement and Development of Evidence-based care in Heart disease Evaluated According to Recommended Therapies (SWEDEHEART) registry and has been described in detail elsewhere. Data quality control showed a 96% agreement, on average, between registry data and medical records.
All patients who underwent a primary, isolated, CABG during January 1, 2000 to December 31, 2008 were eligible for inclusion. We excluded patients with previous cardiac surgery (n = 1,027), who underwent other than isolated CABG (n = 7,059), who had missing pre- or postoperative serum creatinine values (n = 10,582), who died on the day of surgery (n = 6), who had a myocardial infarction (MI) within 14 days before surgery (n = 4,913), who underwent an emergency procedure (n = 822), or who had a preoperative estimated glomerular filtration rate (eGFR) <15 ml/min/1.73 m 2 (n = 149). The study complies with the Declaration of Helsinki and was approved by the Regional Ethical Review Board in Stockholm.
The preoperative serum creatinine value was in general obtained the day before surgery. The highest postoperative serum creatinine value during the index hospitalization was selected for analysis. The preoperative creatinine value was subtracted from the postoperative value, and patients were categorized into different groups of AKI. The reference group was defined as a Δcrea of ≤0 mg/dl (0 μmol/L), group 1 as Δcrea of 0 to <0.3 mg/dl (0 to <26 μmol/L), group 2 as Δcrea of 0.3 to 0.5 mg/dl (26 to 44 μmol/L), and group 3 as Δcrea of >0.5 mg/dl (>44 μmol/L). Group 2 agrees with the definition of AKIN group 1, in which the absolute criterion of a postoperative increase in serum creatinine level of 0.3 mg/dl (26 μmol/L) is required. We used the simplified Modification of Diet in Renal Disease study equation for eGFRs: 186 × (serum creatinine) −1.154 × (age) −0.203 × (0.742 if female).
The primary study outcome was long-term all-cause mortality. We had 2 secondary outcomes: all-cause mortality within 30 days of surgery and a composite end point of MI, heart failure, stroke, or long-term all-cause mortality. Survival status was ascertained in February 2011 using the Swedish personal identity number and the Total Population Register (Statistics Sweden). Follow-up regarding rehospitalization for MI, heart failure, or stroke ended on December 31, 2008, and the data were obtained from the National Inpatient Registry (Swedish National Board of Health and Welfare).
The Kaplan-Meier estimated survival was graphed over 8 years for each AKI group. Unadjusted and multivariate-adjusted Cox regression models were used to study the association between AKI diagnosis and long-term death and the composite end point of MI, heart failure, stroke, or death. Logistic regressions were used to calculate odds ratios for 30-day mortality. All baseline characteristics were considered for inclusion in the model. Primary and secondary interactions among variables were also checked. Finally, age, chronic obstructive pulmonary disease, diabetes mellitus, eGFR, left ventricular ejection fraction (LVEF), previous MI, peripheral vascular disease, gender, and previous stroke were included in the multivariate model. LVEF was used as a 3-stage categorical variable indicating normal, moderate, or poor function: ejection fraction ≥50%, 30% to 50%, and <30%, respectively. Age and eGFR were analyzed as continuous variables. The remaining variables were used as dichotomous indicators. Multiple imputations by chained equations model was used to handle missing data. The frequency of missing data was 8.3% for LVEF, 29% for diabetes, and 8.0% for peripheral vascular disease. A complete-case analysis was also performed, where only patients with complete information on all confounders were included. Statistical analyses were performed using Stata, version 12.1 (StataCorp LP, College Station, Texas).
Results
In Table 1 , the study population is presented in relation to AKI group. In total, 25,665 patients with a mean age of 67 years were included. The mean follow-up was 6 years. Patients with AKI had a greater prevalence of heart failure and a reduced eGFR. They were also more likely to be older or having had previous MI, stroke, or reduced LVEF. More than 1/2 of the study population qualified for AKI groups 1 to 3, with 40% of patients in AKI group 1.
| Variable | All Patients, n = 25,665 (%) | No AKI, n = 12,066 (%) | AKI Groups | ||
|---|---|---|---|---|---|
| 1, n = 10,322 (%) | 2, n = 1,631 (%) | 3, n = 1,646 (%) | |||
| Age (yrs), mean ± SD | 67 ± 9.2 | 66 ± 9.2 | 67 ± 9.1 | 70 ± 8.9 | 71 ± 8.9 |
| Women | 21 | 23 | 20 | 20 | 21 |
| eGFR (ml/min/1.73 m 2 ), mean ± SD | 77 ± 21 | 75 ± 19 | 82 ± 21 | 72 ± 23 | 63 ± 26 |
| Preoperative serum creatinine level (μmol/L), mean ± SD | 92 ± 27 | 93 ± 23 | 87 ± 22 | 99 ± 33 | 117 ± 50 |
| Diabetes mellitus | 24 | 21 | 23 | 28 | 36 |
| Hypertension | 58 | 54 | 58 | 64 | 72 |
| Hyperlipidemia | 61 | 60 | 60 | 60 | 65 |
| Peripheral vascular disease | 9.4 | 8.4 | 8.9 | 13 | 16 |
| Current smokers | 18 | 19 | 17 | 14 | 17 |
| Chronic obstructive pulmonary disease | 6.2 | 6.4 | 5.6 | 6.9 | 8.4 |
| Previous MI | 36 | 35 | 36 | 40 | 48 |
| Previous stroke | 5.0 | 4.3 | 4.8 | 7.6 | 9.1 |
| Previous congestive heart failure | 4.1 | 3.4 | 3.6 | 6.3 | 10 |
| Left ventricular function | |||||
| ≥50% | 71 | 73 | 72 | 65 | 58 |
| 30%–50% | 25 | 24 | 24 | 29 | 35 |
| <30% | 3.8 | 3.3 | 3.5 | 5.3 | 7.6 |
| Internal thoracic artery use | 94 | 94 | 94 | 94 | 94 |
| CABG without cardiopulmonary bypass | 5.8 | 5.5 | 5.8 | 6.7 | 7.5 |
| Waiting time <7 days | 23 | 22 | 23 | 25 | 27 |
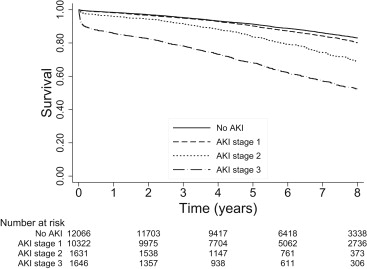
Kaplan-Meier survival data are presented in Figure 1 . The plot describes survival for the reference group and each AKI groups separately. Survival rate decreased with increasing severity of AKI. Already within a few months of surgery, the survival rate for patients in AKI groups 2 and 3 were considerably lower compared with patients with no AKI. The increased mortality in AKI groups 2 and 3 were consistent throughout the study period and even seemed to increase over time.
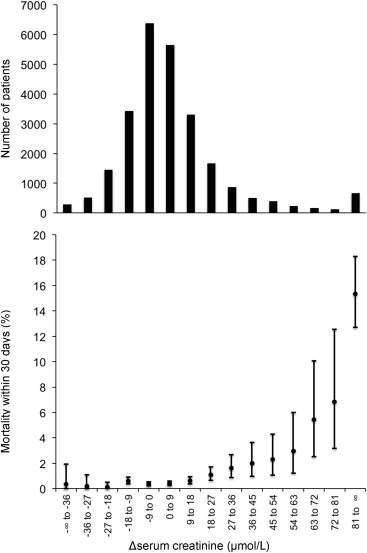
In total, 268 deaths (1.0%) occurred within 30 days. In AKI groups 1, 2 and 3, 54 (0.52%), 29 (1.8%), and 138 (8.4%) patients died, respectively. In contrast, only 47 patients (0.39%) died in the group with no AKI. In Figure 2 , early mortality is shown in relation to the change in the postoperative serum creatinine values. The lowest mortality was found in patients with no change or a decrease in postoperative serum creatinine level. With increasing serum creatinine values, there was a graded increase in mortality from 0.2 mg/dl (18 μmol/L), which became steep >0.6 mg/dl (53 μmol/L). During a mean follow-up of 6 years, there were in total 4,350 deaths (17%) and 7,095 hospitalizations (28%) for MI, stroke, heart failure, or death combined. In AKI groups 1, 2, and 3, there were 1,613 (16%), 400 (25%), and 660 (40%) deaths, respectively, during follow-up compared with 1,677 (14%) among patients without AKI.
The unadjusted analysis showed an increase in the relative risk of death with each AKI group for long-term mortality as well as 30-day mortality and the composite end point ( Table 2 ). The 30-day mortality in AKI group 2 was increased by almost fourfold and in AKI group 3, by 15-fold. For long-term mortality, there was already a significantly increased risk of death by 7% in AKI group 1. After adjustment for confounders, the hazard ratios of the composite end point were increased in each group of AKI ( Table 2 ).
| Outcome | Total | AKI Groups | ||
|---|---|---|---|---|
| 1 | 2 | 3 | ||
| Number of patients (%) | 25,665 | 10,322 (40) | 1,631 (6.4) | 1,646 (6.4) |
| 30-Day all-cause mortality, odds ratio (95% CI) | ||||
| Crude | 1.34 (0.91–1.99) | 4.63 (2.91–7.38) | 23.4 (16.7–32.7) | |
| Adjusted for age and gender | 1.26 (0.85–1.87) | 3.81 (2.38–6.10) | 18.6 (13.2–26.1) | |
| Multivariate adjustment † | 1.37 (0.84–2.21) | 3.64 (2.07–6.38) | 15.4 (9.98–23.9) | |
| Long-term all-cause mortality, hazard ratio (95% CI) | ||||
| Crude | 1.16 (1.08–1.24) | 1.93 (1.73–2.15) | 3.75 (3.43–4.10) | |
| Adjusted for age and gender | 1.04 (0.97–1.12) | 1.52 (1.36–1.69) | 2.78 (2.53–3.04) | |
| Multivariate adjustment † | 1.07 (1.00–1.15) | 1.33 (1.19–1.48) | 2.11 (1.92–2.32) | |
| Composite end point, ‡ hazard ratio (95% CI) | ||||
| Crude | 1.15 (1.10–1.22) | 1.86 (1.71–2.03) | 3.12 (2.90–3.37) | |
| Adjusted for age and gender | 1.07 (1.02–1.13) | 1.57 (1.44–1.71) | 2.52 (2.33–2.72) | |
| Multivariate adjustment † | 1.09 (1.03–1.15) | 1.39 (1.27–1.52) | 1.99 (1.84–2.16) | |
∗ AKI groups were defined in relation to the differences in pre- to postoperative serum creatinine values: group 1, 0 to 0.3 mg/dl (0 to 26 μmol/L); group 2, 0.3 to 0.5 mg/dl (26 to 44 μmol/L); group 3, >0.5 mg/dl (>44 μmol/L); and no kidney injury, <0 mg/dl (<0 μmol/L).
† Multivariate adjustments were made for age, chronic obstructive pulmonary disease, heart failure, diabetes mellitus, eGFR, left ventricular function, MI, peripheral vascular disease, gender, and stroke, all before surgery.
‡ The composite end point includes heart failure, stroke, MI, or death.
Stay updated, free articles. Join our Telegram channel

Full access? Get Clinical Tree


