We hypothesized that midregional pro–A-type natriuretic peptide (MR-proANP), the stable midregional epitope of proANP, might be useful in the early diagnosis and risk stratification of patients with suspected acute myocardial infarction (AMI). In this multicenter study we measured MR-proANP, cardiac troponin T (cTnT), and high-sensitive cTnT (hs-cTnT) at presentation in 675 consecutive patients presenting to the emergency department with suspected AMI. The final diagnosis was adjudicated by 2 independent cardiologists. Patients were followed 360 days for mortality and AMI. AMI was the final diagnosis in 119 patients (18%). Median MR-proANP levels at presentation were significantly higher in patients with AMI (189 pmol/L, interquartile range 97 to 341) versus patients with another final diagnosis (83 pmol/L, 49 to 144, p <0.001). However, neither the combination of MR-proANP with cTnT nor its combination with hs-cTnT significantly improved diagnostic accuracy as quantified by area under the receiver operating characteristic curve (0.91 vs 0.89 for cTnT alone, p = 0.086; 0.95 vs 0.96 for hs-cTnT, respectively, p = 0.02). Cumulative 360-day mortality/AMI rates were 2.4% in the first, 3.6% in the second, 9.5% in the third, and 18.8% in the fourth quartiles of MR-proANP (p <0.001). MR-proANP (area under the curve 0.76) predicted mortality/AMI independently of and more accurately than cTnT (area under the curve 0.62), hs-cTnT (area under the curve 0.71), and Thrombolysis In Myocardial Infarction risk score (area under the curve 0.72). Net reclassification improvements offered by the additional use of MR-proANP were 0.388 (p <0.001), 0.425 (p <0.001), and 0.217 (p = 0.007), respectively. In conclusion, MR-proANP improves risk prediction for 360-day mortality/AMI but does not seem to help in the early diagnosis of AMI.
Natriuretic peptides, mainly A-type (ANP) and B-type (BNP), are counter-regulatory hormones synthesized in the heart that are cleaved and released during hemodynamic stress or myocardial injury. Previous studies have shown that myocardial ischemia is a trigger of NP synthesis and liberation and occurs before myocardial necrosis in acute myocardial infarction (AMI). In addition, their prognostic significance has been established in patients with established AMI. The combination of cardiac troponins as markers of myocyte injury with NPs as markers of myocyte stress may be of particular interest. Because the concentration of ANP is approximately 10- to 50-fold higher than of that of BNP, we hypothesized that ANP might be of particular interest. Analytic difficulties with ANP assays have contributed substantially to the reluctance to further investigate and apply these assays in clinical practice. Recently, a sandwich immunoassay has become clinically available to measure midregional pro-ANP (MR-proANP), the stable midregion that is stoichiometrically related to the synthesis of proANP. We hypothesized that MR-proANP might be useful in the early diagnosis and risk stratification of patients with suspected AMI.
Methods
This study is a subgroup analysis of the Advantageous Predictors of Acute Coronary Syndromes Evaluation (APACE) study, an ongoing prospective international multicenter cohort designed and coordinated by the University Hospital, Basel; the initial results have been previously reported. Briefly, this study enrolled patients who presented to the emergency department with chest pain suggestive of AMI <12 hours. Complete cardiac examination was performed in these patients including measurement of cardiac troponin at presentation and after 6 to 9 hours or as long as clinically indicated. Treatment of patients was left to the discretion of the attending physician. The present study analyzed the subgroup of patients from the APACE study who had MR-proANP measured at presentation. This study was approved by the ethics committee at each institution and all patients granted their written informed consent to participate.
To determine the final diagnosis for each patient, 2 independent cardiologists reviewed all medical records available at 60 days after presentation including cardiac troponin values obtained at the participating hospitals (but none of the investigational assays). When there was disagreement about the diagnosis, cases were reviewed and adjudicated in conjunction with a third cardiologist. AMI was diagnosed when there was evidence of myocardial necrosis in association with clinical signs of myocardial ischemia. Necrosis was diagnosed based on an increasing or decreasing pattern of cardiac troponin concentration with ≥1 value above the ninety-ninth percentile at a level of imprecision <10%. Unstable angina was defined as (1) new-onset (de novo) severe angina, or recent destabilization of previously stable angina with at least severe (class III) angina characteristics (crescendo angina), or angina after MI; (2) coronary artery stenosis >70% on angiogram, or a positive cardiac exercise testing result, or in ambiguous cases when AMI or sudden death occurred within 60 days; and (3) absence of an alternative diagnosis. Further predefined diagnostic categories included cardiac but not coronary causes, noncardiac causes, and symptoms of unknown origin.
Blood samples for the determination of cardiac troponin T (cTnT), high-sensitive cTnT (hs-cTnT), and MR-proANP were collected at presentation and frozen at −80°C until assayed in a blinded fashion in a dedicated core laboratory. cTnT was measured using a commercially available electrochemiluminescence immunoassay (fourth-generation cTnT; Roche Diagnostics, Mannheim, Germany); the limit of detection is of 0.01 μg/L. hs-cTnT was measured using a commercially available electrochemiluminescence immunoassay (Roche Diagnostics); the ninety-ninth percentile cut-off point is 0.014 μg/L and a coefficient of variation <10% is achieved at 0.013 μg/L. MR-proANP was measured using a commercially available sandwich immunofluorescent assay (MR-proANP LIA, B.R.A.H.M.S. AG, Hennigsdorf, Germany); the functional assay sensitivity (interassay coefficient of variance <20%) is 20 pmol/L.
After hospital discharge patients were followed after 30, 90, and 360 days by telephone calls or in written form. Any reported clinical event—in particular cardiovascular events—since presentation to the emergency department were reviewed by asking the patient or a close relative and traced by establishing contact with the respective family physician or treating institution. If attempts to contact the patients failed, primary care physicians were contacted and the hospital medical records and death certificates were consulted.
The primary diagnostic end point was the accurate detection of patients with AMI. The primary prognostic end point was the composite of death or AMI within 360 days (not including the index event).
Values are expressed as mean ± SD, median with interquartile range, or count and percentage as appropriate. Correlations between continuous variables were assessed using the Spearman rank-correlation method. The capacity of MR-proANP alone and in combination and other parameters to diagnose AMI or identify patients with death/AMI within 360 days were investigated first in univariate analysis. Multivariate logistic regression analysis was then performed and included the following variables for AMI diagnosis (age, hypertension, smoking status, known renal failure, glomerular filtration rate, cTnT, hs-cTnT, and MR-proANP) and death/AMI within 360 days (age, hypertension, hypercholesterolemia, diabetes, body mass index, known renal failure, previous AMI, previous cardiovascular disease, glomerular filtration rate, blood pressure, ST-segment deviation on electrocardiogram, cTnT, hs-cTnT, and MR-proANP). Receiver operating characteristic curves were constructed to assess sensitivities and specificities of different biomarkers and their combination for diagnostic and prognostic utility.
For diagnostic utility, MR-proANP was compared to cTnT and hs-cTnT and their combination as recommended by DeLong et al.
For prognostic utility, MR-proANP was compared to cTnT, hs-cTnT, and Thrombolysis In Myocardial Infarction (TIMI) risk scores, 3 known powerful risk stratifiers. Reclassification tables for net reclassification improvement were used to assess the incremental yield of the additional use of MR-proANP at presentation compared to cTn, hs-cTnT, and TIMI risk score alone as recently recommended. Clinically meaningful risk categories were chosen (I, <6%; II, 6% to 20%; III, >20% risk of death/AMI). For further verification we used integrated discrimination improvement; integrated discrimination improvement can be calculated as the difference between the improvement in average sensitivity and changes in average of “1 minus specificity.”
Time to event at 360 days is presented as Kaplan–Meier curves for the combined end point of death/AMI stratified by MR-proANP quartiles; comparisons between groups were performed with log-rank test. STATA 10.1 (STATA Corp. LP, College Station, Texas) was used for all analyses; a p value <0.05 indicated statistical significance.
Results
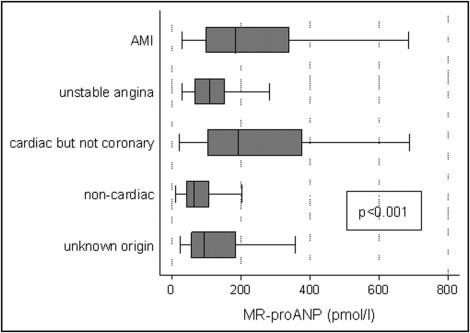
Of the first 700 consecutive patients enrolled in the ongoing APACE cohort, MR-proANP was measured at presentation in 675 patients. The final adjudicated diagnosis was AMI in 119 patients (18%), unstable angina in 103 (15%), cardiac but noncoronary cause of chest pain in 86 (13%), noncardiac in 310 (46%), and unknown in 57 (8%). Time from chest pain onset to blood collection was 4.3 ± 3.3 hours; it was 4.8 ± 3.4 hours in the subgroup of patients with AMI as the final adjudicated diagnosis. MR-proANP concentration ranged from 10 to 1,630 pmol/L. MR-proANP correlated mildly but significantly with cTnT concentration (r = 0.39, p <0.001) and TIMI score (r = 0.55, p <0.001).
Patients’ characteristics in the AMI and non-AMI groups are presented in Table 1 . Median MR-proANP concentrations were 184 pmol/L (interquartile range 97 to 341) in patients with AMI and 83 pmol/L (49 to 145) in patients without AMI (p <0.001). Patients with MR-proANP concentration in the fourth quartile had more frequent AMIs than patients with MR-proANP in the first quartile (relative risk 8.56, 95% confidence interval 4.20 to 17.46, p <0.001). Figure 1 displays MR-proANP concentration according to final adjudicated diagnosis. In multivariate analysis ST-segment deviation and cTnT and hs-cTnT concentrations remained the only factors significantly associated with the diagnosis of AMI (p <0.001 each). Table 2 presents the accuracy of cTnT, hs-cTnT, MR-proANP, and their combination to diagnose AMI.
| Variable | Total | AMI | Other Diagnosis | p Value |
|---|---|---|---|---|
| (n = 675) | (n = 119) | (n = 556) | ||
| Age (years) | 64 (51–76) | 72 (61–82) | 62 (49–75) | <0.001 |
| Men | 439 (65%) | 85 (71%) | 354 (63.7%) | 0.107 |
| Hypertension ⁎ | 416 (62%) | 88 (74%) | 328 (59.0%) | 0.002 |
| Hypercholesterolemia † | 297 (44%) | 60 (50%) | 237 (42.6%) | 0.120 |
| Diabetes mellitus | 115 (17%) | 26 (22%) | 89 (16.0%) | 0.124 |
| Body mass index (kg/m 2 ) | 26.7 ± 4.4 | 26.9 ± 4.4 | 26.7 ± 4.7 | 0.682 |
| Family history of coronary heart disease (first-degree relative) | 64 (34%) | 13 (42%) | 51 (31.9%) | 0.277 |
| Smoker | 166 (25%) | 40 (34%) | 126 (22.7%) | 0.012 |
| Previous myocardial infarction | 175 (26%) | 34 (29%) | 141 (25.4%) | 0.468 |
| Previous cardiovascular disease | 240 (36%) | 45 (38%) | 195 (35.1%) | 0.570 |
| Known renal failure | 66 (10%) | 22 (19%) | 44 (7.9%) | <0.001 |
| Drug regimen | ||||
| Aspirin | 264 (39%) | 48 (40%) | 216 (38.9%) | 0.763 |
| Clopidogrel | 73 (11%) | 8 (7%) | 65 (11.7%) | 0.113 |
| β-Adrenergic blocker | 271 (40%) | 48 (40%) | 223 (40.1%) | 0.963 |
| Angiotensin-converting enzyme inhibitor/angiotensin receptor blocker | 282 (42%) | 56 (47%) | 226 (41.7%) | 0.198 |
| Statin | 245 (36%) | 41 (35%) | 204 (36.7%) | 0.645 |
| Heart rate (beat/min) | 79 ± 21 | 82 ± 21 | 78 ± 21 | 0.090 |
| Systolic blood pressure (mm Hg) | 144 ± 25 | 140 ± 29 | 145 ± 24 | 0.092 |
| Diastolic blood pressure (mm Hg) | 86 ± 15 | 86 ± 18 | 86 ± 21 | 0.733 |
| ST-segment deviation | 146 (22%) | 78 (59%) | 76 (13.7%) | <0.001 |
| Creatinine (μmol/L) | 81 ± 40 | 95 ± 57 | 78 ± 34 | <0.001 |
| Glomerular filtration rate (ml/min/1.73 m 2 ) | 91 ± 28 | 81 ± 29 | 94 ± 27 | <0.001 |
| Hemoglobin (g/L) | 143 ± 16 | 141 ± 20 | 143 ± 15 | 0.218 |
| Troponin T (μmol/L) | 0.01 (0.01–0.01) | 0.08 (0.02–0.28) | 0.01 (0.01–0.01) | <0.001 |
| High-sensitive troponin T (μmol/L) | 0.008 (0.003–0.023) | 0.114 (0.049–0.300) | 0.006 (0.003–0.012) | <0.001 |
| Midregional pro–A-type natriuretic peptide (pmol/L) | 95 (53–183) | 184 (97–341) | 83 (49–145) | <0.001 |
| Thrombolysis In Myocardial Infarction risk score | 3 (2–4) | 5 (4–5) | 3 (1–4) | <0.001 |
| Coronary angiography | 178 (26%) | 94 (79%) | 84 (15.1%) | <0.001 |
| Primary coronary intervention | 133 (20%) | 88 (74%) | 45 (8.1%) | <0.001 |
| Therapy at discharge | ||||
| Aspirin | 359 (53%) | 102 (86%) | 257 (46.2%) | <0.001 |
| Clopidogrel | 189 (28%) | 86 (72%) | 103 (18.5%) | <0.001 |
| β-Adrenergic blocker | 364 (54%) | 95 (80%) | 269 (48.4%) | <0.001 |
| Angiotensin-converting enzyme inhibitor/angiotensin receptor blocker | 340 (50%) | 88 (74%) | 252 (45.3%) | <0.001 |
| Statin | 343 (51%) | 103 (87%) | 240 (43.2%) | <0.001 |
⁎ Patients treated with antihypertensive medication and untreated patients with known systolic blood pressure ≥140 mm Hg or diastolic blood pressure ≥90 mm Hg.
† Patients known with low-density lipoprotein cholesterol ≥4.13 mmol/L (1.6 g/L), or current use of lipid-lowering drugs.
| Variable | AUC | 95% CI | p Value ⁎ |
|---|---|---|---|
| Troponin T | 0.89 | 0.85–0.93 | reference |
| Midregional pro–A-type natriuretic peptide | 0.74 | 0.69–0.78 | <0.001 |
| Troponin T plus midregional pro–A-type natriuretic peptide | 0.91 | 0.88–0.94 | 0.086 |
| High-sensitive troponin T | 0.96 | 0.94–0.97 | reference |
| Midregional pro–A-type natriuretic peptide | 0.74 | 0.69–0.79 | <0.001 |
| High-sensitive troponin T plus midregional pro–A-type natriuretic peptide | 0.95 | 0.93–0.97 | 0.020 |
⁎ Incremental/decremental value versus troponin T and high-sensitive troponin T alone.
Follow-up was complete in 672 of 675 patients (99.6%). Fifty-eight patients (8.6%) reached the combined end point of death/AMI, including 28 deaths (4.2%) and 36 AMIs (5.4%). MR-proANP concentrations at presentation were 220 pmol/L (124 to 465) in patients with death/AMI versus 89 pmol/L (51 to 166) in patients free of death/AMI at 360 days (p <0.001). By multivariate analysis MR-proANP concentration was independently associated with death/AMI occurrence ( Table 3 ). Compared to patients in the first quartile of MR-proANP, patients in the third and fourth quartiles had an increased risk of death/AMI at 360 days (p = 0.011 and p <0.001, respectively; Table 4 , Figure 2 ). It is noteworthy that the difference was already significant at 30 and 90 days ( Table 4 ).
| Variable | p Value |
|---|---|
| Age | <0.001 |
| ST-segment deviation | 0.002 |
| Midregional pro–A-type natriuretic peptide | 0.004 |
| Previous cardiovascular disease | 0.007 |
| Thrombolysis In Myocardial Infarction risk score | 0.010 |
| Diabetes mellitus | 0.035 |
| High-sensitive troponin T concentration | 0.067 |
| Hypercholesterolemia | 0.085 |


