Epicardial adipose tissue (EAT) is an emerging cardiometabolic risk factor, and its thickness can be measured using echocardiography. The relation of EAT to the metabolic syndrome (MS) is still unclear. A meta-analysis of published reports was performed to provide comprehensive insight on the association of EAT thickness as assessed by echocardiography and the MS. A systematic search was conducted for reports on echocardiographic EAT thickness in patients with and without the MS. Nine studies were identified. The pooled population consisted of 2,027 subjects, of whom 1,030 had the MS. EAT thickness was significantly higher in patients with the MS than in those without (standardized difference in means 1.15 mm, 95% confidence interval 0.78 to 1.53, p = 0.0001). Subgroup meta-analysis showed no difference between patients with and those without the MS by MS criteria used and echocardiographic cardiac cycle of measurement but did show a significant difference by ethnicity, with a greater difference in Caucasian subjects (standardized difference in means 1.75 mm, 95% confidence interval 1.43 to 2.07) than in other ethnic groups. In conclusion, echocardiographic EAT thickness is significantly higher in patients with the MS than in those without, but differences exist by ethnicity.
Epicardial adipose tissue (EAT) can be visualized and measured by echocardiography, as first proposed and validated by Iacobellis et al. Although radiologic techniques can provide a volumetric and more accurate measurement, echocardiographic assessment of EAT certainly has the advantages of being inexpensive, noninvasive, and readily available but still accurate and reproducible. Echocardiographic EAT has been shown to nicely and independently reflect intra-abdominal fat and insulin resistance, which are considered key components of the metabolic syndrome (MS). The aim of this study was therefore to perform a meta-analysis of studies measuring echocardiographic EAT thickness in patients with and without the MS.
Methods
We conducted a search of published research using PubMed, MEDLINE, Scopus, and the ISI Web of Knowledge for studies that assessed EAT thickness in subjects with or without MS by using echocardiographic examination, from January 2003 to April 2012. The terms used to identify studies were “epicardial adipose tissue,” “epicardial fat,” “subepicardial adipose tissue,” “subepicardial fat,” “metabolic syndrome,” “echocardiography,” “coronary artery disease,” “carotid artery disease,” “peripheral arterial disease,” “coronary plaques,” “carotid plaques,” “peripheral vascular plaques,” and “atherosclerosis.” Reference lists of included reports were also examined for additional studies. If necessary, supplementary data were obtained through personal contact with the investigators of the selected studies.
Excluded from this meta-analysis were studies in children, in subjects with type 1 diabetes, and in patients with human immunodeficiency virus infection, because of too specific contexts. Moreover, we excluded studies performed with radiologic techniques alone. We included studies evaluating and reporting echocardiographic EAT thickness in adult patients with or without the MS, independently of the clinical context.
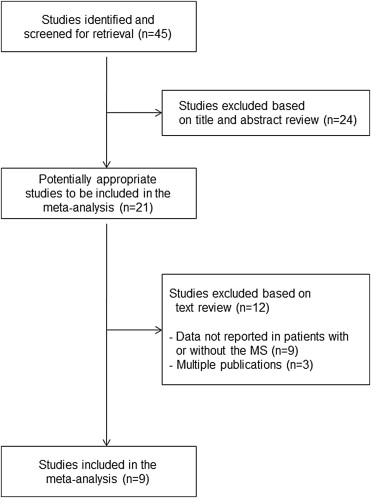
The first search identified 45 studies, but only 21 were eligible for the analysis. Of these, 9 studies were included in the present meta-analysis. Nine studies were excluded because they did not report data on EAT thickness in subjects with or without the MS. Three studies were excluded because they were multiple publications, including approximately the same patients. Selection of publications is summarized in Figure 1 . Main data from selected reports were independently extracted by 2 reviewers (S.D.P. and A.M.P.).
We calculated the standardized difference in means and the 95% confidence interval (CI) of echocardiographic EAT thickness between patients with and those without the MS. A fixed-effects or a random-effects model was used according to the absence or presence of heterogeneity among studies. A forest plot was used to display the results of each study and the overall result. We evaluated the heterogeneity of studies using Cochrane Q and I 2 statistics. Individual studies were removed 1 at a time to evaluate the influence of each on the pooled estimate. If the point estimate of the combined effect size with 1 study removed was outside the CI of the overall estimate with all available studies, that specific study was considered to have an excessive influence on the results. Subgroup meta-analysis, which is equivalent to meta-regression with categorical (or categorized) variables, was performed to analyze potential sources of heterogeneity. A funnel plot and Egger’s regression test for funnel plot asymmetry were used to examine the likely presence of publication bias and small-study effect. Potential adjustment for missing studies was approached by Duval and Tweedie’s trim-and-fill method. Statistical significance was defined as p <0.05 (2-tailed tests). Analyses were performed using Comprehensive Meta-Analysis version 2 (Biostat, Englewood, New Jersey).
Results
The 2 data extractors evaluated all studies and were in agreement. Main characteristics at baseline of the study populations are listed in Table 1 . Globally, selected studies included 2,027 subjects, of whom 1,030 had the MS. Patients with the MS tended to be older. The prevalence of men was similar in subjects with or without MS. Two studies used the International Diabetes Federation criteria to define the MS, whereas 7 studies used the National Cholesterol Education Program Adult Treatment Panel III criteria. Three studies investigated Caucasian subjects, 4 studies evaluated Turkish subjects, 1 study examined Asian subjects, and 1 study assessed Hispanic subjects.
| Study | Patients | Age (yrs) | Men/Women | MS Criteria | Ethnicity | |||
|---|---|---|---|---|---|---|---|---|
| No MS | MS | No MS | MS | No MS | MS | |||
| Iacobellis et al | 58 | 80 | 44 | 47 | 58/0 | 80/0 | NCEP ATP III | Caucasian |
| Iacobellis et al | 46 | 62 | 40 | 45 | 0/46 | 0/62 | NCEP ATP III | Caucasian |
| Okyay et al | 123 | 123 | 54 | 54 | 47/76 | 47/76 | IDF | Turkish |
| Sade et al | 39 | 26 | — | — | 0/39 | 0/26 | NCEP ATP III | Turkish |
| Park et al | 267 | 376 | — | — | — | — | NCEP ATP III | Asian |
| Sengul et al | 40 | 40 | 50 | 49 | 26/14 | 22/18 | NCEP ATP III | Turkish |
| Torres et al | 19 | 21 | 39 | 42 | 9/10 | 9/12 | IDF | Hispanic |
| Pierdomenico et al | 153 | 21 | 61 | 64 | 64/89 | 9/12 | NCEP ATP III | Caucasian |
| Pierdomenico et al | 203 | 210 | 62 | 63 | 115/88 | 105/105 | NCEP ATP III | Caucasian |
| Ege et al | 49 | 71 | 56 | 58 | 27/22 | 49/22 | NCEP ATP III | Turkish |
EAT thickness and methodologic aspects are listed in Table 2 . To achieve the final EAT value, 6 studies used data obtained from long- and short-axis approaches, 1 study used data obtained from the long- or short-axis approach, and 2 studies used data obtained from the long-axis approach alone. In 3 studies EAT was measured at end-systole, and in 6 studies it was measured at end-diastole.
| Study | EAT (mm) | Echocardiographic Approach | Time of Measurement | |
|---|---|---|---|---|
| No MS | MS | |||
| Iacobellis et al | 4.5 ± 2.0 | 9.4 ± 2.6 | Long and short axis | End-systole |
| Iacobellis et al | 3.5 ± 2.0 | 7.6 ± 2.2 | Long and short axis | End-systole |
| Okyay et al | 3.39 ± 1.6 | 5.09 ± 1.74 | Long and short axis | End-diastole |
| Sade et al | 4.4 ± 1.4 | 5.2 ± 1.7 | Long and short axis | End-diastole |
| Park et al | 2.4 ± 2.2 | 3.6 ± 2.4 | Long and short axis | End-diastole |
| Sengul et al | 5.7 ± 1.9 | 7.2 ± 2.0 | Long and short axis | End-diastole |
| Torres et al | 5.43 ± 0.96 | 8.45 ± 3.14 | Long or short axis | End-systole |
| Pierdomenico et al | 2.5 ± 0.9 | 4.0 ± 0.8 | Long axis | End-diastole |
| Pierdomenico et al | 3.7 ± 1.02 | 5.43 ± 1.35 | Long axis | End-diastole |
| Ege et al | 5.29 ± 1.9 | 6.15 ± 2.2 | Long and short axis | End-systole |
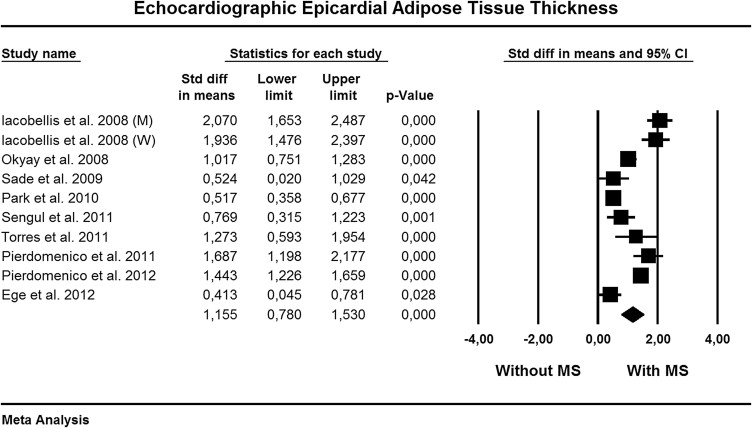
We found significant heterogeneity among studies (Q = 115, p = 0.0001, I 2 = 92%), and the random-effects model was used. Figure 2 shows the standardized difference in means and the 95% CI of echocardiographic EAT thickness between patients with and those without the MS. Compared to patients without the MS, those with the MS had significantly higher EAT thickness (standardized difference in means 1.15, 95% CI 0.78 to 1.53, p = 0.0001).
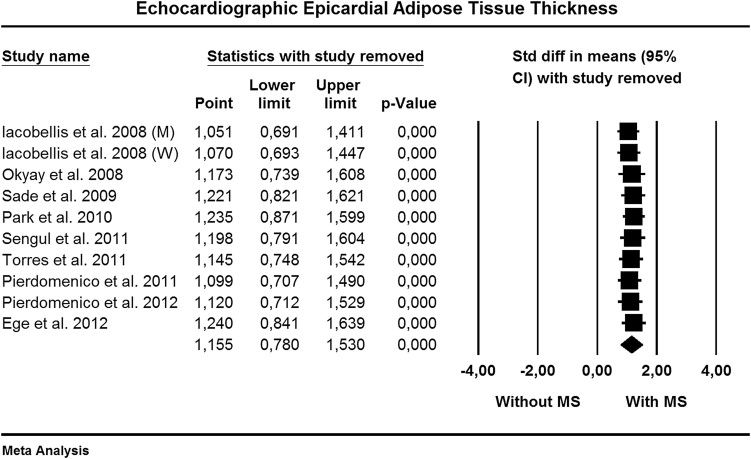
Sensitivity analysis ( Figure 3 ) indicated that none of the studies had a significant influential effect on the overall estimate.
When we explored publication bias and the small-study effect, the funnel plot appeared symmetric ( Figure 4 ), and Egger’s test was not significant (2-tailed p >0.20). When we applied Duval and Tweedie’s trim-and-fill method, no study appeared missing on the right or left side of the mean effect ( Figure 4 ).

Subgroup meta-analysis was performed in an attempt to find possible sources of differences. Random-effects meta-analysis, according to MS criteria, ethnicity, and cardiac cycle (i.e., end-systole or end-diastole) of echocardiographic measurement is listed in Table 3 . No significant difference was found among studies according to MS criteria used and cardiac cycle of measurement. In contrast, a significant difference (p = 0.0001) was observed when data were considered for ethnicity. Indeed, the difference in EAT thickness between subjects with or without the MS was more evident in Caucasian subjects, followed by Hispanic, Turkish, and Asian subjects.


