A high glycemic diet may increase cardiovascular risk, yet whether the risk differs by gender or adiposity is inconclusive. Our goal was to determine the associations between dietary glycemic load (GL) and glycemic index (GI), and coronary heart disease (CHD) risk by conducting a meta-analysis of prospective studies. We searched the PubMed and Embase databases in July 2011 to identify eligible studies. The random-effects model was used to calculate pooled relative risks (RRs) comparing the highest categories of exposure to the lowest. Prespecified subgroup analyses were performed by gender and body mass index. We identified 8 prospective studies for meta-analysis, consisting of 220,050 participants and 4,826 incident CHD cases. Pooled RRs of CHD in relation to dietary GL were 1.08 (95% confidence interval [CI] 0.92 to 1.27) for men, 1.69 (95% CI 1.32 to 2.16) for women, and 1.36 (95% CI 1.13 to 1.63) for men and women combined. For dietary GI, corresponding pooled RRs were 0.99 (95% CI 0.84 to 1.16), 1.26 (95% CI 1.12 to 1.43), and 1.13 (95% CI 1.00 to 1.28), respectively. Limited evidence suggested the associations appeared more evident in the overweight and obese. There was no indication of publication bias. In conclusion, high dietary GL and GI significantly increased the risk of CHD in women but not in men, and the unfavorable effects may be more pronounced in overweight and obese patients. Further studies are needed to verify these findings and elucidate the underlying mechanisms.
Glycemic load (GL) and glycemic index (GI) are used to quantify the glycemic burden of carbohydrate from foods. Prospective cohort studies that assessed the associations of dietary GL and GI with incident coronary heart disease (CHD) have produced mixed results, with positive associations observed in women only. In addition, previous studies have suggested a more harmful effect of high glycemic diets in overweight and obese populations, but these results also have been inconsistent. Results from a 2008 meta-analysis on this topic were inconclusive because only 2 studies were included. Therefore, the goal of this study was to assess the associations between dietary GL and GI and risk of CHD by conducting a meta-analysis of prospective studies, with an emphasis on gender and adiposity differences.
Methods
We searched for all published prospective studies that described the relations of GL or GI to incident CHD. A literature search was performed in July 2011 using the PubMed and Embase databases and was supplemented through the manual review of reference lists of obtained articles and recent reviews. Search terms included “glycemic index,” “glycaemic index,” “glycemic load,” “glycaemic load,” “cardiovascular disease,” “coronary heart disease,” “prospective study,” “cohort study,” and “follow-up study.” No language restrictions were imposed.
Studies were considered eligible for analysis if they met the following criteria: the study had a prospective design; the exposure was dietary GL or GI; the outcome was incident major CHD (nonfatal myocardial infarction or fatal CHD); and risk estimates of outcomes in relation to dietary GL or GI and associated 95% confidence intervals (CIs) were reported. If multiple articles were published from the same cohort, we included the article for which the primary focus was the associations of dietary GL and GI with CHD.
All data were abstracted with an electronic data-collection form. Study characteristics recorded were as follows: first author’s name, publication year, country of origin, characteristics of study population (sample size, age, and gender), measurements of outcome and exposure, reference food used for GI calculation, duration of follow-up, statistical adjustment for main confounding factors, and most fully adjusted risk estimates of CHD and corresponding CIs by comparing the highest and lowest categories of exposure (quartiles, quintiles, etc.). Risk estimates overall and in each subgroup stratified by gender and body mass index (BMI) were abstracted.
We calculated Q and I 2 statistics to examine statistical heterogeneity across studies. Fixed- and random-effects models were used to compute pooled risk estimates by comparing the highest and lowest categories of exposure. Results from random-effects model, which considered within- and between-study variations, were presented (in fact, the 2 models yielded similar results in this meta-analysis). In the prespecified stratified analyses, we examined associations between dietary GL and GI and CHD by gender and BMI. These differences were tested by the meta-regression approach using the residual maximum likelihood method.
Potential publication bias was assessed by visual inspection of Begg funnel plots in which the log relative risks (RRs) were plotted against their SEs. In addition, the Begg rank correlation test and Egger linear regression test were employed to quantify this bias. All analyses were performed using STATA 11.0 (STATA Corp., College Station, Texas). A 2-sided p value <0.05 was considered statistically significant.
Results
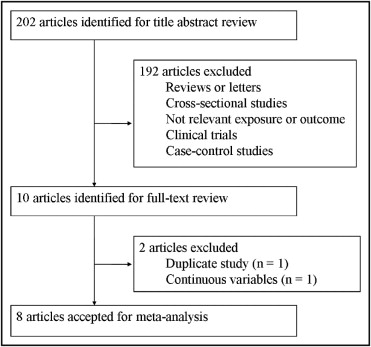
The results of the literature search are shown in Figure 1 . Briefly, we retrieved 202 citations from the initial search of electronic databases. Of these, most were excluded by title and abstract screening, leaving 10 articles for full-text assessment. Two studies were excluded because they reported overlapping data from the same study population or analyzed exposure as a continuous variable. Eventually 8 studies were included in this meta-analysis.

Characteristics of the selected prospective studies are presented in Table 1 . These studies were published from 2000 through 2011, with 7 conducted in European countries and 1 in the United States. Two studies enrolled men and women, 3 studies included men only, and 3 studies included women only. Median length of follow-up ranged from 6 to 18 years. Total number of subjects was 220,050 with 4,826 incident cases. All studies excluded participants with a history of CHD, of which 7 studies also excluded diabetic patients from the analysis. In the dietary assessment, 5 studies used validated food-frequency questionnaires and 3 studies used diet records or diet history interview. For GI calculation, 5 studies used white bread and 3 used glucose as reference food. Outcome assessments were from different sources including hospital discharge registries, death certificates, and medical records. All primary studies adjusted for age, BMI, smoking, physical activity, alcohol consumption, and total energy intake; other widely controlled confounding factors included hypertension, education, and intakes of dietary fiber and dietary fat ( Table 2 ).
| Study | Population | Duration (years) | Exposure Assessment | Reference Food | Outcome (cases) |
|---|---|---|---|---|---|
| Liu et al, 2000; United States | 75,521 women 38–63 years old without CVD or DM | 10 | Validated FFQ | White bread | CHD (761) |
| Van Dam et al, 2000; Netherlands | 646 men 64–84 years old without CHD or DM | 7 | Diet history interview | White bread | CHD (94) |
| Beulens et al, 2007; Netherlands | 15,714 women 49–70 years old without CVD or DM | 9 | Validated FFQ | Glucose | CHD (556) |
| Levitan et al, 2007; Sweden | 36,246 men 45–79 years old without CVD or DM | 6 | Validated FFQ | White bread | CHD (1,324) |
| Levitan et al, 2010; Sweden | 36,234 women 48–83 years old without CVD or DM | 9 | Validated FFQ | White bread | MI (1,138) |
| Sieri et al, 2010; Italy | 15,171 men and 32,578 women 35–74 years old without CVD or DM | 7.9 | Validated FFQ | Glucose | CHD (463) |
| Grau et al, 2011; Denmark | 1,885 men and 1,889 women 30–70 years old without CHD or DM | 6–25 | Diet records or diet history interview | White bread | CHD (−) |
| Mursu et al, 2011; Finland | 1,981 men 42–60 years old without CHD | 16.1 | Diet records | Glucose | MI (376) |
| Study | Adjustment |
|---|---|
| Liu et al, 2000 | Age, body mass index, smoking, physical activity, family history of myocardial infarction, history of hypertension, cholesterol, menopausal status, aspirin use, multiple-vitamin use, and intakes of alcohol, protein, fiber, vitamin E, folate, and total energy |
| Van Dam et al, 2000 | Age, body mass index, smoking, physical activity, prescribed diet, and intakes of total energy, saturated fat, polyunsaturated fat, carbohydrates, and alcohol |
| Beulens et al, 2007 | Age, body mass index, smoking, physical activity, hypertension, cholesterol, systolic blood pressure, menopausal status, hormone replacement therapy use, oral contraceptives use, and intakes of alcohol, total energy, vitamin E, protein, fiber, folate, and fat |
| Levitan et al, 2007 | Age, body mass index, smoking, physical activity, hypertension, family history of myocardial infarction, aspirin use, marital status, education, and intakes of total energy, carbohydrate, fat, alcohol, and cereal fiber |
| Levitan et al, 2010 | Age, body mass index, smoking, physical activity, education, marital status, postmenopausal hormone use, aspirin use, family history of myocardial infarction, hypertension, cholesterol, and intakes of total energy, alcohol, fiber, fat, protein, carbohydrate |
| Sieri et al, 2010 | Age, body mass index, smoking, physical activity, hypertension, education, and intakes of total energy, alcohol, fiber and saturated fat |
| Grau et al, 2011 | Age, body mass index, smoking, physical activity, education, cohort, and intakes of total energy, carbohydrate, fat, protein, fiber, and alcohol |
| Mursu et al, 2011 | Age, body mass index, smoking, physical activity, systolic blood pressure, hypertension medication, cholesterol, triglycerides, education, family history of cardiovascular disease, diabetes, and intakes of alcohol, total energy, folate, fiber, vitamin C, and fat |
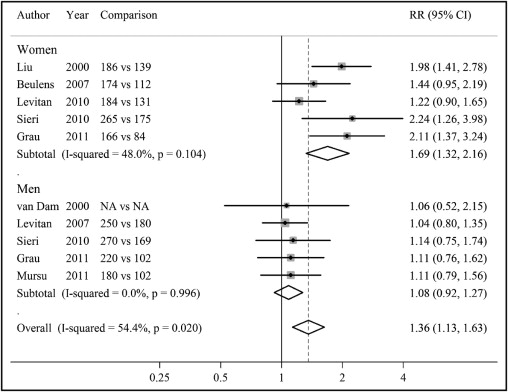
Risk estimates of CHD for highest versus lowest category of dietary GL in men and women and summary risk estimates are shown in Figure 2 . Among these studies, only 3 studies conducted in women detected a significant association between dietary GL and CHD. When women and men were combined, higher dietary GL was associated with a significant 36% increased risk of CHD (RR 1.36, 95% CI 1.13 to 1.63), but modest heterogeneity was present (p = 0.02). Dietary GL was not related to CHD incidence in men (RR 1.08, 95% CI 0.92 to 1.27). However, there was a significant, strong positive association of dietary GL with CHD risk in women (RR 1.69, 95% CI 1.32 to 2.16). No evidence of heterogeneity was observed within men or women (p >0.10 for the 2 comparisons). In addition, the association between dietary GL and CHD differed significantly by gender (p = 0.01 for interaction).

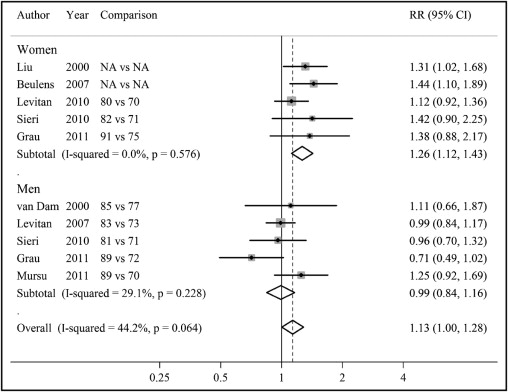
A similar pattern of associations was observed for dietary GI ( Figure 3 ) . When combined altogether, high versus low dietary GI was associated with a statistically significant 13% increased risk of CHD (RR 1.13, 95% CI 1.00 to 1.28). When stratified by gender, pooled RRs were 0.99 (95% CI 0.84 to 1.16) for men and 1.26 (95% CI 1.12 to 1.43) for women. The association between dietary GI and CHD also differed significantly between men and women (p = 0.03 for interaction). The p values for heterogeneity in results were 0.06 for men and women combined, 0.23 for men, and 0.58 for women.


Stay updated, free articles. Join our Telegram channel

Full access? Get Clinical Tree


