The aim of this study was to assess whether heart failure (HF) patients with narrow QRS durations have mechanical left ventricular (LV) dyssynchrony compared to those with wide QRS durations and with normal subjects. The strain dyssynchrony index with 3-dimensional area tracking (ASDI) was used, which represents mechanical LV dyssynchrony and residual endomyocardial function from circumferential as well as longitudinal directions. The study included 79 subjects: 32 HF patients with ejection fractions ≤35% and narrow QRS durations (<120 ms) and 22 with ejection fractions ≤35% and wide QRS durations (≥120 ms), all candidates for cardiac resynchronization therapy, and 25 normal controls. ASDI was calculated as the average difference between peak and end-systolic area strain of LV endocardium obtained using 3-dimensional speckle-tracking imaging using 16 LV segments (≥3.8% predefined as significant). ASDI in HF patients with narrow QRS durations was lower than in their counterparts with wide QRS durations (2.5 ± 1.3% vs 4.2 ± 1.2%, p <0.001) but higher than in normal controls (2.5 ± 1.3% vs 0.73 ± 0.53%, p <0.001). Furthermore, the prevalence of significant ASDI in HF patients with narrow QRS durations was significantly higher than in normal controls (22% vs 0%, p = 0.01) but significantly lower than in HF patients with wide QRS durations (22% vs 59%, p <0.01). In conclusion, HF patients with narrow QRS durations have LV dyssynchrony. These observations suggest that the use of 3-dimensional speckle area tracking strain might be extended to HF patients with narrow QRS durations who are being considered as potential candidates for cardiac resynchronization therapy.
Myocardial coordination related to heart failure (HF) with wide QRS duration, such as in left bundle branch block, which was found to be present in about 13.5% of 4,102 hospitalized HF patients, is fundamental for clinical assessment. Left bundle branch block is known to impair left ventricular (LV) function and is associated with increased mortality and morbidity. Cardiac resynchronization therapy (CRT) is an established treatment for advanced HF patients with reduced LV ejection fractions (EFs) and wide QRS durations. Previous single- and multicenter studies of HF patients with narrow QRS durations and mechanical dyssynchrony have indicated that CRT may have beneficial effects, although the results of the first randomized trial of the use of CRT for these patients were ambiguous, so the full potential of CRT for HF patients with narrow QRS durations remains currently unknown. It would be useful to investigate the factors, such as mechanical LV dyssynchrony, myocardial contractility, and LV lead position, that in combination may influence response to CRT. We recently reported that strain dyssynchrony index obtained with 2-dimensional speckle strains can predict response to CRT and that combining assessment of radial, circumferential, and longitudinal strain dyssynchrony indexes can further improve the prediction of responders. A newly developed 3-dimensional (3D) speckle-tracking system, when coupled with the factors of longitudinal and circumferential strain, can quantify endocardial area change ratio (area strain) from all 16 standard LV segments using complete 3D pyramidal data sets. More recently, we reported that strain dyssynchrony index with 3D area tracking (ASDI) ≥3.8% could predict response to CRT with sensitivity of 78%, specificity of 100%, and an area under the curve of 0.93. The objective of our study was to assess with the aid of 3D speckle-tracking strain whether HF patients with narrow QRS durations have mechanical LV dyssynchrony compared to HF patients with wide QRS durations and to normal subjects.
Methods
The study comprised 79 subjects, consisting of 32 HF patients with EFs ≤35% and narrow QRS durations (<120 ms) and 22 HF patients with EFs ≤35% and wide QRS durations (≥120 ms), all of whom were candidates for CRT, and 25 normal controls ( Table 1 ). The normal control group consisted of 25 volunteers with no histories of cardiovascular disease and completely normal electrocardiographic findings as well as 2-dimensional and Doppler echocardiographic results. Ischemic cardiomyopathy was defined as the presence of ≥75% stenosis of ≥1 major epicardial coronary artery and/or previous coronary revascularization. Written informed consent was obtained from all subjects.
| Variable | Normal Controls | HF With Narrow QRS Duration | HF With Wide QRS Duration |
|---|---|---|---|
| (n = 25) | (n = 32) | (n = 22) | |
| Age (years) | 63 ± 13 | 64 ± 11 | 68 ± 8 |
| Men/women | 16/9 | 25/7 | 19/3 |
| NYHA functional class II/III/IV | 0/0/0 | 17/14/1 ⁎ , † | 0/20/2 ⁎ |
| QRS duration (ms) | 92 ± 8 | 97 ± 10 † | 167 ± 28 ⁎ |
| SR/AF/paced | 25/0/0 | 30/2/0 ‡ | 15/1/6 § |
| End-diastolic volume (ml) | 112 ± 28 | 184 ± 69 ⁎ | 180 ± 60 ⁎ |
| End-systolic volume (ml) | 73 ± 15 | 130 ± 50 ⁎ | 134 ± 56 ⁎ |
| EF (%) | 65 ± 5 | 29 ± 5 ⁎ | 27 ± 7 ⁎ |
| Heart failure cause | |||
| Ischemic | 0 (0%) | 5 (16%) ⁎ | 7 (32%) ⁎ |
| Nonischemic | 0 (0%) | 27 (84%) ⁎ | 15 (68%) ⁎ |
| Medications | |||
| ACE inhibitors/ARBs | 0 (0%) | 29 (91%) ⁎ | 21 (95%) ⁎ |
| β blockers | 0 (0%) | 30 (94%) ⁎ | 19 (86%) ⁎ |
| Diuretics | 0 (0%) | 25 (78%) ⁎ | 17 (77%) ⁎ |
⁎ p <0.001 vs normal controls;
† p <0.001 vs wide QRS duration;
‡ p <0.01 vs wide QRS duration;
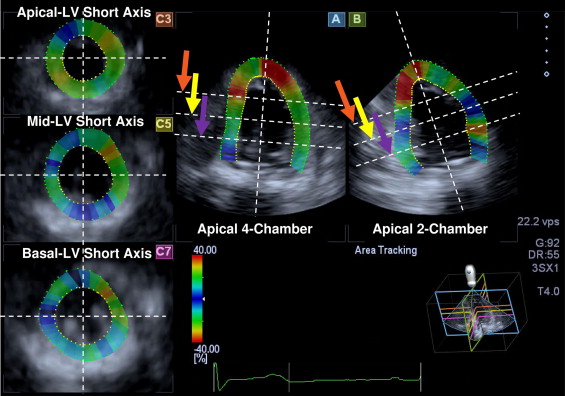
All echocardiographic studies were performed with a 2.5-MHz 3D matrix-array transducer and 3-MHz sector transducer using a commercially available echocardiographic system (Aplio Artida; Toshiba Medical Systems, Tochigi, Japan). Digital LV 3D volume data were obtained from the apical view using 4- or 6-beat electrocardiographically gated acquisition. Routine digital grayscale 2-dimensional cine loops, including standard apical views, were also obtained. Sector width was optimized to allow complete myocardial visualization while maximizing the frame rate. The mean volume rate was 22 ± 2 volumes/s in the apical views for grayscale imaging used for 3D speckle-tracking analysis. For patients with atrial fibrillation, measurements of standard echocardiographic and speckle-tracking parameters were obtained as the averages of ≥4 cardiac cycles, while LV end-diastolic volume, end-systolic volume, and EF were obtained using the modified biplane Simpson’s method.
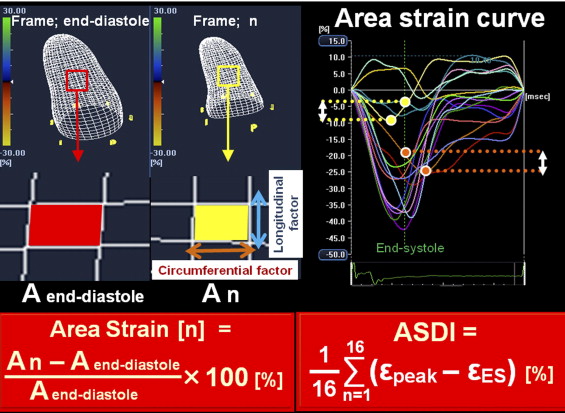
The assessment of ASDI using complete 3D pyramidal data sets was performed offline with dedicated software (Ultra Extend; Toshiba Medical Systems), as previously described in detail. Briefly, a region of interest was traced on the endocardial cavity with a point-and-click approach. A second larger concentric circle was then automatically generated and manually adjusted near the epicardium ( Figure 1 ), and the 3D area strain curve of the endocardium was calculated automatically ( Figure 2 ). ASDI was then calculated as the average difference between peak and end-systolic area strain derived from 16 segments ( Figure 2 ). The peak of the Q wave on the electrocardiogram was automatically used as the reference time point for end-diastole. The timing of minimum LV volume, determined by means of 3D speckle-tracking echocardiography, was used as the reference time point for end-systole. The wasted energy per segment of the endocardium because of dyssynchrony was expressed as the difference between peak strain (ε-peak) and end-systolic strain (ε-ES) ( Figure 2 ). This difference increases with an increase in the degree of dyssynchrony, which then leads to a decrease in ε-ES. ASDI was calculated as the average of the absolute differences between ε-peak and ε-ES derived from 16 segments. Three cardiac cycles were recorded and averaged for each measurement. If a segment showed a positive area strain during the entire cardiac cycle, the difference between ε-peak and ε-ES was assumed to be 0. On the basis of our previous observations of a group of patients who underwent CRT, an ASDI of ≥3.8% was predefined as significant. The SD of time to peak area strain from the onset of the QRS complex was also calculated as a parameter of the simple time-delay dyssynchrony index obtained from 16 LV segments.
Continuous variables are expressed as mean ± SD. Unpaired Student’s t tests were performed for comparison of group data for patients with narrow QRS and wide QRS durations, patients with narrow QRS durations and normal controls, and patients with wide QRS durations and normal controls. Proportional differences of the prevalence of ASDI ≥3.8% were evaluated using Fisher’s exact test. The intraclass correlation coefficient was used to determine inter- and intraobserver reproducibility of the measurements of ASDI and the SD of time to peak area strain for 10 randomly selected patients. For all tests, p values <0.05 were considered statistically significant. All the analyses were performed with commercially available software (SPSS version 15.0; SPSS, Inc., Chicago, Illinois).
Stay updated, free articles. Join our Telegram channel

Full access? Get Clinical Tree


