Fig. 5.1
Position of right ventricle in the chest. A transverse white-blood anatomical MR image. Note the anterior position of the right ventricle in the chest which explains why it is a difficult chamber to image with echocardiography. (LV Left Ventricle, RV Right Ventricle)
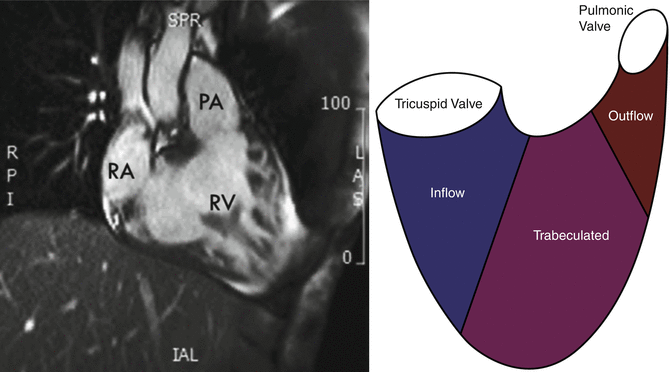
Fig. 5.2
The triangular shape of the right ventricle. The right ventricle has a triangular shape with an inflow portion, a mid trabeculated portion, and an outflow portion. It may be difficult even for 3D imaging techniques, such as CMR, to visualize the right ventricle in its entirety on a single plane (Modified and reproduced with permission from Fakhri et al. [1]) (PA Pulmonary Artery, RA Right Atrium, RV Right Ventricle)
5.3 How CMR Works
Magnetic resonance imaging (MRI) is typically based on the magnetic properties of the hydrogen nucleus, though other nuclei can also be used [3]. In an MRI examination, the patient is placed in a powerful magnetic field with which the protons in the body become aligned. Radio waves in the form of a radio frequency pulse transmitted into the patient cause the alignment of the protons to change (e.g. by 90°). When this radiofrequency pulse is turned off, the protons in the patient’s body return to their neutral position, emitting their own weak radio-wave signals, which are detected by receiver coils and used to produce an image. The phase and amplitude of each returning radio-wave signal can be determined using powerful computers and additional magnetic field gradients, and this information can be used to map the position of the excited protons. The resulting image reflects not only proton density but also the highly complex manner in which protons resonate in their local environment. Cardiovascular MRI (CMR) requires advanced technology, including a high-field magnet (typically 1.5 T, although recently, 3.0 T systems are increasingly being used), fast-switching gradient coils, and coils for transmission and signal reception. Compared to other imaging techniques, MRI has a unique ability to perform tissue characterisation. Image contrast is influenced by proton density and T1 and T2 relaxation times, which can vary substantially for different tissues. Another way to modify image contrast is by modulating the way the radio-frequency pulses are played out (the MR sequence). MRI scan subjects and operators are not exposed to ionising radiation, and there are no known detrimental biological side effects of MRI if safety guidelines are followed. However, ferromagnetic objects can be attracted by the scanner, becoming projectiles that could lead to significant patient or operator injury and also damage the scanner. The presence of certain medical implants and devices (e.g. conventional pacemakers, defibrillators, cochlear implants, cerebrovascular clips) is a contraindication for routine MR scanning, but nearly all prosthetic cardiac valves, coronary and vascular stents and orthopaedic implants are safe in a 3 T (or less) MR environment. Claustrophobia may be a problem in a small percentage of patients, and mild sedation usually helps to overcome this. Recently, gadolinium-containing contrast agents have been linked with the development of a rare systemic disorder called nephrogenic systemic fibrosis. The patients at risk for developing this disease are those with acute or chronic severe renal insufficiency (glomerular filtration rate < 30 mL/min/1.73 m2) or acute renal dysfunction of any severity due to the hepato-renal syndrome or in the perioperative liver transplantation period [4]. To date, there is no evidence that other patient groups are at risk. Many MR centres use gadolinium agents, which are tightly bound to a cyclic chelate, for which the incidence of nephrogenic systemic fibrosis is near zero. Moreover, it is unknown whether immediate haemodialysis protects against nephrogenic systemic fibrosis. Therefore, gadolinium-based contrast media should be avoided in high-risk patients unless the diagnostic information is essential and not available with non-contrast enhanced CMR or other imaging modalities.
5.4 Applications of CMR with a Focus on the Right Ventricle
5.4.1 Cardiovascular Anatomy
Black-blood or white-blood MRI techniques can be used to generate high–spatial resolution anatomical images. Cardiovascular anatomy can be assessed in conventional orthogonal (e.g. transverse, sagittal, coronal) and in CMR-specific double-angulated (e.g. oblique sagittal) planes. CMR has been widely utilised to characterize changes in morphology and anatomy for various cardiovascular disorders including complex congenital abnormalities [5]. More detailed description of the intra- and extracardiac anatomy can be achieved by three-dimensional rendering techniques, including contrast-enhanced MR angiography and whole-heart 3D steady-state free precession (SSFP).
5.4.2 Right Ventricular Function
CMR has been shown to be an excellent technique for assessing left and right ventricular volumes and systolic function. Cine images are obtained using SSFP sequences, resulting in images with excellent delineation of the blood–myocardium interface [6]. For ventricular volume assessment, a set of contiguous short-axis slices parallel to the atrioventricular ring (Fig. 5.3) that encompasses both ventricles from base to apex is required [7]. Left and right ventricular volumes are calculated by summing the endocardial areas multiplied by the inter-slice distance. Normal age- and gender-specific values for RV volumes and function have been published for the adult and paediatric population [8, 9]. It is important to note that additional experience and standardisation in the analysis of right ventricular function is needed for accurate estimation of right ventricular volumes and ejection fraction. For example, the basal slices of 2D short-axis images often include both atrial and ventricular cavities. Precise segmentation of the atrial and ventricular parts in these slices is crucial for accurate measurements of ventricular volumes (Fig. 5.4). To help discriminate the right ventricle from the right atrium, atrioventricular excursion should be estimated by cross-referencing short-axis slices against each long-axis acquisition. It has also been suggested that by orienting ventricular acquisition axially [11], the accuracy of volumetric measurements is further improved. Ventricular mass can also be determined from the end-diastolic images by multiplication of the myocardial volume by its specific weight of 1.05 g/cm3. With adequate standardisation, CMR RV measurements show high reproducibility with an inter-observer variability <7 % for the end-diastolic volume, <14 % for the end-systolic volume, <7 % for RV ejection fraction, and <20 % for RV mass [8, 9].
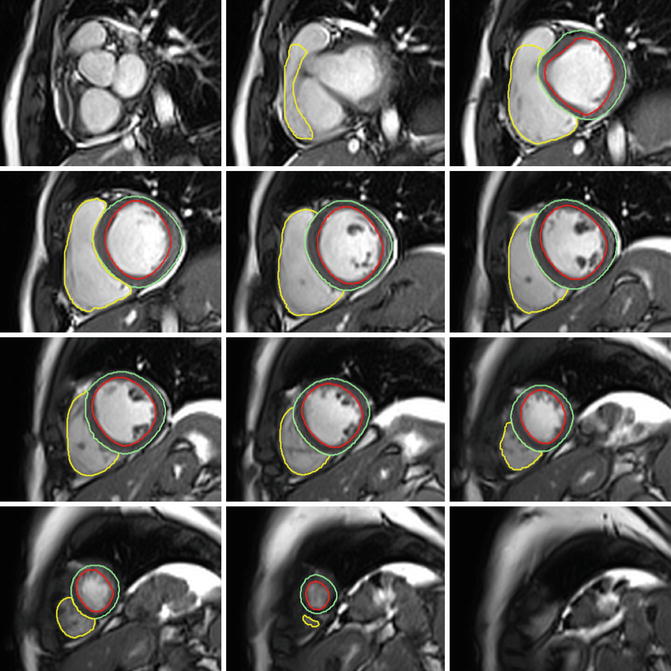
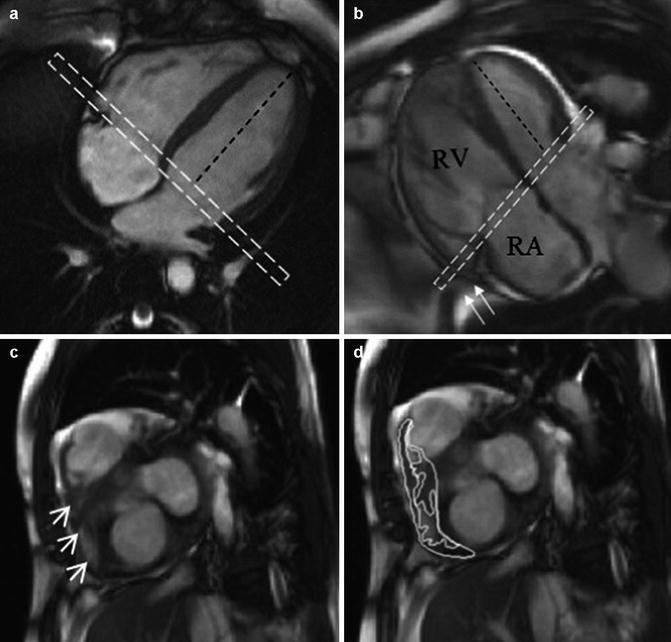

Fig. 5.3
Left and right ventricular contours. Left and right ventricular contours drawn on end-diastolic frames from short-axis cine images using cmr42® (Circle Cardiovascular Imaging Inc., Calgary, Alberta, Canada)

Fig. 5.4
Basal slice analysis. In the normal right ventricle (a) the angle between the left ventricular long axis (black dashed line) and basal slice (dashed white box) is approximately 90°. In pulmonary arterial hypertension patients (b), assuming the basal slice is prescribed as per recommendations; the angle becomes more obtuse as the right ventricle dilates. The basal slice will now include right atrium (seen centrally) with a shoulder of right ventricle seen laterally (c, arrow heads). The impact this interpretation has on delineation is shown in (d). Also in B note how the most basal part of the right ventricle ‘hoods’ beyond the TV plane (arrows) and is effectively ignored by the acquisition (Reproduced with permission from Bradlow et al. [10])
CMR is also an excellent technique for visualising regional wall motion abnormalities. It allows the identification of even subtle wall motion abnormalities at rest. Quantification of regional wall motion is usually performed by visual inspection of cine images. Another technique for quantitative analysis of regional systolic and diastolic function is MR tagging. Selective saturation pre-pulses are used to superimpose a grid across the field of view. These grid lines are deformed by myocardial contraction, strain, and torsion, allowing direct quantification of myocardial deformation and strain [12]. Similar information can be derived by CMR tissue velocity mapping, a technique analogous to tissue Doppler echocardiography, which can provide measurements of three-dimensional myocardial velocities, strains, and strain rates [13]. Although feasible in the right ventricle, these techniques are more often used on the left ventricle, due to the thin RV wall and extensive post-processing.
5.4.3 Blood Flow
Phase contrast mapping of velocities through planes transecting blood flow in the main pulmonary artery and the ascending aorta can provide accurate measurements of cardiac output, shunt flow, aortic or pulmonary regurgitation, and, indirectly, mitral and tricuspid regurgitation [14]. For stenotic jets, the peak velocity can be measured on in-plane or through-plane velocity-encoded images [15]. Peak pressure gradients can be estimated according to the modified Bernoulli’s equation. Valve morphology can be assessed with the use of SSFP cine images, although valve structure is generally better assessed by echocardiography.
Apart from the evaluation of patients with valve pathologies (Fig. 5.5), flow imaging by CMR is regularly used in assessing patients with congenital heart disease [14]. By measuring flow in the ascending aorta and main pulmonary artery with velocity-encoding CMR, the pulmonary-to-systemic flow ratio (Qp/Qs) can be determined [17]. This can also be estimated from the ventricular stroke volume comparison if no significant valvular regurgitation exists. Importantly, pulmonary-to-systemic flow ratios measured by velocity-encoding CMR show excellent correlation with calculations obtained from oximetry during haemodynamic catheterisation [17].
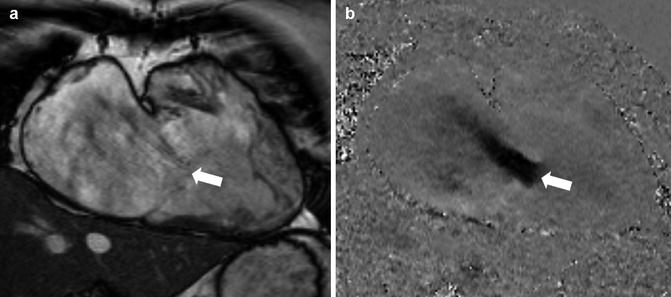

Fig. 5.5
Tricuspid regurgitation. A patient with severe tricuspid regurgitation. In the systolic frame of RV 2-chamber SSFP cine (left panel), there is little regurgitation seen due to the minimal turbulence from the jet (white arrow). Note the marked dilatation of the right atrium and ventricle. In-plane velocity mapping in the same position (right panel) demonstrates a wide jet of severe tricuspid regurgitation (white arrow) due to failure of leaflet coaptation (Reproduced with permission from Karamitsos and Myerson [16]) (SSFP steady-state free precession, RV Right Ventricular)
5.4.4 Tissue Characterisation
Tissue characterisation can be achieved with CMR using either contrast (i.e. post-administration of gadolinium-based contrast agents) or non-contrast techniques (e.g. T1- or T2-weighted imaging or mapping) [18].
With the use of contrast agents, late gadolinium enhancement imaging can be performed to identify areas of myocardial necrosis as a result of ischaemic injury or fibrosis in the context of non-ischaemic cardiomyopathies [3]. This technique has broad application in clinical CMR practice with several patterns of late gadolinium enhancement of the left ventricle being linked to specific diseases. Several technical issues, such as the thin right ventricular wall and the surrounding epicardial fat and pericardium, can make the interpretation of late gadolinium images of the right ventricle particularly challenging.
For non-contrast tissue characterisation, in so-called T1-weighted images, myocardial tissue is dark, whereas fat is bright. By applying special pre-pulses, signals from fat can be suppressed (fat saturation T1-weighted sequences). On the other hand, T2-weighted images highlight unbound water in the myocardium and are used to demonstrate myocardial oedema due to inflammation or acute ischaemia [19]. Recently, parametric T1- and T2-mapping techniques opened a new frontier for CMR to explore even better tissue characteristics [18, 20, 21]. Myocardial T1-mapping methods can be used for native (or non-contrast) T1 measurement, post-contrast T1 measurement, and extracellular volume fraction measurement. These newer mapping strategies offer the promise of standardising CMR assessment of myocardial tissue properties providing an absolute quantitative tissue characterisation measure rather than just a qualitative (visual) or semi-quantitative tool.
5.5 Clinical Application of CMR in Conditions Affecting the Right Ventricle
5.5.1 Ischaemic Heart Disease Affecting the Right Ventricle
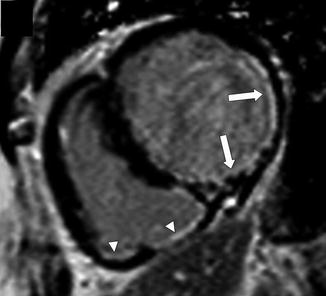
CMR is an excellent method to demonstrate RV myocardial infarction (Fig. 5.6). This is characterised by the presence of late gadolinium enhancement and functional abnormalities (regional RV hypokinesis or akinesis). Right ventricular injury is more common on inferior infarcts but can also occur on anterior infarcts. Right ventricular systolic function late after infarction is an important predictor of prognosis in patients with ischaemic heart disease [22].

