The associations of pulmonary function with cardiovascular disease (CVD) independent of diabetes mellitus (DM) and metabolic syndrome have not been examined in a population-based setting. We examined prevalence and incidence CVD in relation to lower pulmonary function in the Strong Heart Study second examination (1993 to 1995) in 352 CVD and 2,873 non-CVD adults free of overt lung disease (mean age 60 years). Lung function was assessed by standard spirometry. Participants with metabolic syndrome or DM with or without CVD had lower pulmonary function than participants without these conditions after adjustment for hypertension, age, gender, abdominal obesity, smoking, physical activity index, and study field center. CVD participants with DM had significantly lower forced vital capacity than participants with CVD alone. Significant associations were observed between reduced pulmonary function, preclinical CVD, and prevalent CVD after adjustment for multiple CVD risk factors. During follow-up (median 13.3 years), pulmonary function did not predict CVD incidence, it predicted CVD mortality. Among 3,225 participants, 412 (298 without baseline CVD) died from CVD by the end of 2008. In models adjusted for multiple CVD risk factors, DM, metabolic syndrome, and baseline CVD, compared with highest quartile of lung function, lower lung function predicted CVD mortality (relative risk up to 1.5, 95% confidence interval 1.1 to 2.0, p <0.05). In conclusion, a population with a high prevalence of DM and metabolic syndrome and lower lung function was independently associated with prevalent clinical and preclinical CVD, and its impairment predicted CVD mortality. Additional research is needed to identify mechanisms linking metabolic abnormalities, low lung function, and CVD.
Epidemiologic studies have shown that cardiovascular disease (CVD) is the leading cause of mortality and morbidity in American Indian population, which also has the highest prevalences of obesity and diabetes mellitus (DM). The aims of this study were to test the hypotheses that reduced lung function is independently associated with prevalent CVD and also predicts subsequent incident CVD and CVD mortality in this population.
Methods
The Strong Heart Study is a multicenter, population-based, prospective study of CVD and its risk factors in American Indian adults that enrolled 4,549 men and women 45- to 74-year old at the first examination in 1989 to 1992. The study design, survey methods, and laboratory techniques have been described previously. The study population comprises members of 13 tribes who reside in the study communities in Arizona, North and South Dakota, and Oklahoma. The present analysis used lung function assessment by standard spirometry at the second examination (1993 to 1995). Approval was obtained from relevant institutional review boards, and all participants gave written informed consent.
Incident CVD events included fatal and nonfatal CVD events that occurred between the second examination (1993 to 1995) and December 31, 2008. Fatal CVD events included fatal myocardial infarction, sudden death presumed because of coronary heart disease, fatal congestive heart failure, other fatal coronary heart disease, and fatal stroke. Deaths occurring between second examination and December 31, 2008, were confirmed through tribal and Indian Health Service hospital records and through direct contact with participants’ families or other informants by study personnel, as reported previously. Nonfatal CVD events included definite myocardial infarction, coronary heart disease, congestive heart failure, and stroke, either identified by participant contact and medical record review or electrocardiograms obtained at subsequent examinations.
Subjects were classified as having DM according to the 1997 American Diabetes Association criteria: fasting glucose level at least 7.0 mmol/L (126 mg/dl), current use of antidiabetes medication, or on renal dialysis/kidney transplant with a positive response to the question “Has a medical person ever told you that you had diabetes?.” This group included adults with DM—primarily type 2, but also some with type 1 DM.
Metabolic syndrome (MS) in participants without DM was defined according to the Third Report of the National Cholesterol Education Program Expert Panel on Detection, Evaluation, and Treatment of High Blood Cholesterol in Adults (Adult Treatment Panel III) guidelines as having at least 3 of the following 5 conditions: abdominal obesity (waist circumference >102 cm in men and >88 cm in women), increased triglycerides (≥150 mg/dl), reduced high-density lipoprotein (HDL) cholesterol (<40 mg/dl in men and <50 mg/dl in women), elevated blood pressure (≥130/≥85 mm Hg), and high fasting glucose (100 to 125 mg/dl).
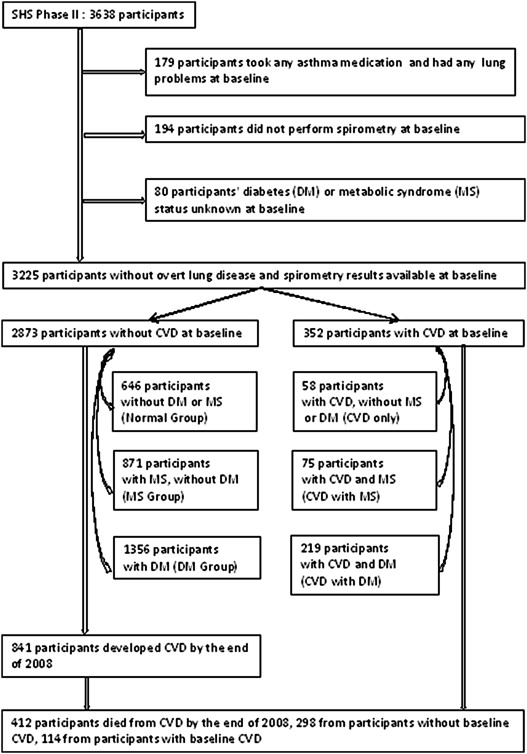
The following criteria were used to exclude participants from the analysis population: any self-reported lung problems and use of asthma medications (n = 179), missing pulmonary function results (n = 194), and missing data on DM or MS status (n = 80). The final study sample consisted of 3,225 adults, of which 352 had CVD at the second examination. The 2,873 without CVD (CVD free) included 646 without MS, DM, or CVD (normal group), 871 without DM or CVD but with MS (MS group), and 1,356 without CVD but with DM (DM group). The 352 with prevalent CVD included 58 CVD only, 75 CVD with MS, and 219 CVD with DM. These 6 groups of participants were mutually exclusive. CVD-free (n = 2,873) participants were used for the prediction of incident CVD ( Figure 1 ).
Spirometry was performed by centrally trained and certified nurses and technicians. The study-specific forced vital capacity (FVC) and forced expiratory volume in 1 second (FEV1) were predicted using the equations developed by Marion et al for healthy Strong Heart Study participants using age, gender, and height. Before the analysis, crude data on FVC and FEV1 were divided by predicted FVC and FEV1, respectively, to yield FVC% predicted and FEV1% predicted.
The ankle-brachial index (ABI) is the ratio of blood pressure in the lower legs to blood pressure in the arms. A higher ABI suggests calcification of the walls of the arteries and incompressible vessels, reflecting possible peripheral vascular disease. The method of measuring ABI in the Strong Heart Study has been previously published. At the study examination, right arm blood pressure and bilateral ankle blood pressure measured by handheld Doppler were taken by a trained certified nurse with the participants supine. The means of the 2 measurements for each leg and for the arm were used to calculate ABI, and the lower of the 2 values was used to define ABI for each subject. The aforementioned Strong Heart Study publication found a U-shaped association between peripheral arterial disease and mortality risk through the measurement of ABI. In this study, abnormal ABI was defined as ABI <0.90 or ABI >1.40.
The left ventricular (LV) ejection fraction represents the volumetric fraction of blood pumped out of ventricle with each heartbeat. The LV ejection fraction was calculated from LV linear dimensions, as shown to be prognostically relevant to cardiovascular mortality. Partition values were used to separate the Strong Heart Study participants with normal LV ejection fraction from those with LV dysfunction (ejection fraction < 54%).
LV hypertrophy, increased LV myocardial mass and most commonly a reaction to CVD or high blood pressure, is a strong marker for heart disease. The LV mass index was estimated by echocardiography using an anatomically validated formula and indexed by a method that detects both disease-related and obesity-related LV hypertrophy. LV hypertrophy was defined as an LV mass index >49.2 g/m 2.7 in men and >46.7 g/m 2.7 in women in the Strong Heart Study.
LV wall movement abnormalities have recognized prognostic significance in patients with CVD; echocardiographic LV wall movement abnormalities in Strong Heart Study participants without overt CVD are also associated with 2.4- to 3.4-fold higher risks of CVD morbidity and mortality. Segmental LV wall movement abnormalities were considered present if present in 2 contiguous segments in a coronary territory. All echocardiogram for the Strong Heart Study were evaluated at a central reading center (Weill Cornell Medical Center, New York, NY).
The definitions and methods used for other measurements (age, education level, physical activity index, height, body mass index, and hypertension) have been reported previously. Cigarette smokers were defined as persons who smoked at least 100 cigarettes during their lifetime. The homeostasis model assessment–estimated insulin resistance was calculated according to the following formula: (fasting insulin in μU/ml × fasting glucose in mg/dl)/405.
Characteristics of normal, MS, DM, and CVD (CVD alone, CVD with MS, and CVD with DM) groups were compared using general linear models for continuous variables and chi-square tests for categorical variables; p-values were calculated between MS versus normal, DM versus normal, and CVD versus normal. Kruskal-Wallis analysis of variance by ranks was used to compare total triglycerides and urine albumin/creatinine because of skewed distributions. Multiple linear regression models were used to describe the cross-sectional associations between lung function and MS, DM, or CVD after adjusting for potential demographic confounding variables including age, gender, abdominal obesity, height, physical activity index, education level, smoking status, Strong Heart Study Center, and CVD risk factors (hypertension, high non-HDL cholesterol, and albuminuria). High non-HDL cholesterol was defined as values ≥175 mg/dl, the highest quartile of this measurement; albuminuria was defined as urinary albumin/creatinine ratio ≥30 mg/g. The same models were also fitted to describe the cross-sectional associations between lung function and cardiovascular abnormalities with adjustment for potential confounding variables.
Cox proportional hazard models were used to analyze associations between incident CVD and pulmonary function, controlling for confounding variables. Because measurements of FVC and FEV1 as % predicted values were not affected by factors other than pulmonary function such as age and body size, these 2 measurements were used for the prediction of CVD incidence. For the incidence prediction, the 352 with prevalent CVD at baseline were excluded. The follow-up time for CVD incidence was the time between the second examination and the first episode of CVD events, fetal or nonfetal. For participants without a CVD event, the time was between the second examination (1993 to 1995) and December 31, 2008. In the CVD mortality analysis, the follow-up time for CVD/non-CVD death was from the second examination to death. Survivors were censored at the end of 2008. All tests of significance were 2 tailed, with an alpha level of 0.05. All analyses were performed using version 9.2 of the SAS statistical software package (SAS Institute, Cary, NC).
Results
The characteristics of the study cohort are display in Table 1 . Mean age of these 3,225 participants was 59.8 ± 7.9 years (61% women; 35% from Arizona, 33% from Oklahoma, and 32% from Dakotas), 70% were smokers (current smokers and ex-smokers). Prevalent hypertension and prevalent DM were present in 47% and 49% of the cohort, respectively. Mean body mass index and waist circumferences were 31.2 ± 0.1 kg/m 2 and 106.6 ± 14.5 cm, respectively. CVD participants with MS or DM had higher inflammatory marker (fibrinogen), and they were also more likely to be less active and more hypertensive and more likely to have albuminuria compared with participants with MS or DM alone ( Table 1 ). The clinical measurements of the excluded group because of missing DM, MS, or pulmonary function test status were similar to those of the study group, except they were older and had lower mean body mass index (data not shown).
| Variables | No CVD | CVD | ||||
|---|---|---|---|---|---|---|
| Normal (n = 646) | MS (n = 871) | DM (n = 1356) | No MS/DM (n = 58) | MS (n = 75) | DM (n = 219) | |
| Arizona | 110 | 247 | 659 | 13 | 12 | 84 |
| Oklahoma | 265 | 326 | 373 | 24 | 25 | 58 |
| Dakotas | 271 | 298 | 324 | 21 | 38 | 77 |
| Male | 341 | 300 | 441 | 19 | 35 | 122 |
| Female | 305 | 571 | 915 | 39 | 40 | 97 |
| Mean age (years) | 59.0 (8.0) | 59.5 (8.1) | 59.6 (7.6) | 63.9 (8.3) ∗ | 63.4 (8.7) ∗ | 62.4 (7.7) ∗ |
| High school graduate | 58% (54–62) | 60% (57–63) | 49% (46–52) ∗ | 47% (34–59) ∗ | 55% (43–66) ∗ | 38% (31–44) ∗ |
| Cigarette smoking | ||||||
| Current smoker | 47% (43–51) | 31% (28–34) ∗ | 24% (22–27) ∗ | 43% (30–56) | 30% (19–40) ∗ | 18% (13–23) ∗ |
| Ex-smoker | 29% | 38% | 42% | 36% | 48% | 54% |
| Never smoker | 24% | 31% | 34% | 21% | 23% | 28% |
| Leisure activity in the past year (MET, hours/week) | 31.8 (44.4) | 27.4 (43.1) | 22.2 (35.1) ∗ | 34.9 (48.5) | 21.5 (28.5) ∗ | 19.7 (30.9) ∗ |
| Waist circumference (cm) | 95.6 (12.5) | 109.0 (13.0) ∗ | 110.4 (14.0) ∗ | 97.3 (13.8) | 108.2 (12.5) ∗ | 107.9 (13.3) ∗ |
| Body mass index (kg/m 2 ) | 27.0 (5.0) | 32.5 (5.9) ∗ | 32.5 (6.4) ∗ | 27.6 (6.2) | 32.1 (5.9) ∗ | 31.3 (6.3) ∗ |
| Hypertension | 22% (18–25) | 44% (41–47) ∗ | 54% (52–57) ∗ | 43% (30–56) ∗ | 73% (63–83) ∗ | 74% (69–80) ∗ |
| HDL † cholesterol (mg/dl) | 50.5 (15.7) | 39.0 (11.3) ∗ | 38.7 (11.6) ∗ | 47.1 (13.5) | 39.4 (11.3) ∗ | 35.8 (11.2) ∗ |
| Total triglyceride ‡ (mg/dl) | 92.5 (66, 120) | 145 (103, 195) † | 148 (104, 214) † | 93 (68, 123) | 128 (96, 175) † | 153 (101, 253) † |
| % Hemoglobin A1C | 5.2 (0.9) | 5.4 (0.9) | 8.6 (2.4) ∗ | 5.5 (1.2) | 5.6 (1.1) | 8.3 (2.3) ∗ |
| Albuminuria | ||||||
| Macroalbuminuria | 2% (1–3) | 3% (2–4) | 24% (21–26) | 9% (2–16) | 7% (1–13) | 35% (29–42) |
| Microalbuminuria | 11% | 11% | 34% | 13% | 23% | 31% |
| No albuminuria | 87% | 86% | 42% ∗ | 79% | 70% ∗ | 34% ∗ |
| Fibrinogen (mg/dl) | 333.6 (64.1) | 345.0 (66.0) ∗ | 384.1 (92.5) ∗ | 362.9 (62.0) ∗ | 364.0 (84.6) ∗ | 395.0 (87.6) ∗ |
| HOMA-IR § | 2.6 (2.6) | 5.3 (3.8) ∗ | 14.1 (12.9) ∗ | 3.0 (2.4) | 5.4 (4.3) ∗ | 13.5 (13.0) ∗ |
∗ For continuous variables, general linear models were used; for categorical variables, chi-square tests were used to test significant difference for MS, DM or CVD vs normal.
† HDL, high-density lipoprotein.
‡ Median, first quartile, and third quartile; Kruskal-Wallis tests were used to test differences.
§ Homeostasis model assessment–estimated insulin resistance.
Participants with MS or DM with or without CVD had lower pulmonary function than participants without these conditions after adjustment for hypertension, age, gender, abdominal obesity, education level, physical activity index, height, smoking status, and study field center. Within CVD participants, CVD participants with DM had significantly lower FVC than participants with CVD alone (p <0.05; Table 2 ). The effect modifications for MS, DM, CVD, and smoking in relation to pulmonary function were tested. The results indicated that there were no interactions among these groups (p >0.05).
| Variables | FVC (ml) | FEV1 (ml) | FVC% Predicted | FEV1% Predicted |
|---|---|---|---|---|
| Normal, MS, DM, CVD: unadjusted models | ||||
| Normal (n = 646) | 3,724 (3,651–3,797) | 2,732 (2,676–2,787) | 99.1 (97.7–100.4) | 95.2 (93.9–96.6) |
| MS, no CVD (n = 871) | 3,326 (3,263–3,388) | 2,513 (2,466–2,561) | 94.1 (92.9–95.2) | 92.9 (91.7–94.1) |
| DM, no CVD (n = 1356) | 3,117 (3,067–3,167) | 2,381 (2,343–2,419) | 90.3 (89.4–91.3) | 90.0 (89.1–91.0) |
| CVD only (n = 58) | 3,451 (3,208–3,693) | 2,489 (2,304–2,673) | 92.5 (88.0–97.1) | 90.0 (85.4–94.6) |
| CVD, MS (n = 75) | 3,275 (3,062–3,488) | 2,439 (2,277–2,601) | 90.5 (86.5–94.5) | 89.6 (85.5–93.6) |
| CVD, DM (n = 219) | 2,995 (2,870–3,119) | 2,255 (2,160–2,350) | 85.5 (83.1–87.8) | 85.0 (82.6–87.3) |
| MS: adjusted models † | ||||
| MS, no CVD vs normal | −108 (−202 to −14) ∗ | −55 (−133 to 22) | −2.9 (−5.3 to −0.4) ∗ | −1.9 (−4.5 to 0.7) |
| MS, CVD vs normal | −283 (−490 to −76) ∗ | −157 (−326 to 13) | −6.1 (−11.6 to −0.6) ∗ | −4.0 (−9.7 to 1.8) |
| DM: adjusted models † | ||||
| DM, no CVD vs normal | −190 (−277 to −103) ∗ | −97 (−167 to −28) ∗ | −4.7 (−7.1 to −2.2) ∗ | −3.1 (−5.4 to −0.7) ∗ |
| DM, CVD vs normal | −396 (−531 to −261) ∗ | −240 (−348 to −132) ∗ | −10.6 (−14.3 to −6.8) ∗ | −8.6 (−12.3 to −4.9) ∗ |
| CVD: adjusted models † | ||||
| CVD only vs normal | −234 (−489 to 21) | −169 (−373 to 35) | −4.4 (−10.9 to 2.1) | −2.8 (−9.5 to 3.8) |
| CVD, MS vs normal | −284 (−534 to −34) ∗ | −171 (−372 to 29) | −5.9 (−12.3 to 0.4) | −4.4 (−10.9 to 2.2) |
| CVD, DM vs normal | −360 (−536 to −185) ∗ | −227 (−368 to −86) ∗ | −9.8 (−14.3 to −5.4) ∗ | −8.6 (−13.2 to −4.0) ∗ |
| Within CVD group: unadjusted models | ||||
| CVD, MS vs CVD only | −176 (−550 to 199) | −50 (−339 to 240) | −2.0 (−9.9 to 5.9) | −0.4 (−8.6 to 7.7) |
| CVD, DM vs CVD only | −456 (−772 to −139) ∗ | −234 (−478 to 11) | −7.1 (−13.7 to −0.4) ∗ | −5.0 (−12.0 to 1.9) |
∗ Indicates the difference was statistically significant between 2 groups.
† Models were adjusted for hypertension, and demographic factors include age, sex, abdominal obesity, height, physical activity index, education level, smoking status, and Strong Heart Study Center.
The prevalence of preclinical CVD among study participants was measured. Participants with CVD were more likely to have cardiovascular abnormalities; participants with DM, with or without CVD were more likely to have an abnormal ABI and higher LV mass index compared with their normal counterparts ( Supplementary Table 1 ).
There was a significant reduction in FVC and FEV1% predicted in participants with markers of cardiovascular abnormality measured by ABI, LV ejection fraction, or by LV mass index after adjustment for MS, DM, hypertension, and demographic factors ( Table 3 ); the results for ejection fraction remained significant after additional adjustment for CVD risk factors (data not shown). LV wall movement abnormality was significantly related to FEV1 reduction after adjustment for MS, DM, hypertension, and demographic factors. The effect modifications for preclinical CVD, MS, DM, and smoking in relation to pulmonary function were also tested. The results indicated that there were no interactions among these groups (p >0.05).
| Variables | FVC (ml) | FEV1 (ml) | FVC% Predicted | FEV1% Predicted |
|---|---|---|---|---|
| Measured by ankle brachial index (ABI) | ||||
| Unadjusted model | ||||
| Normal ABI | 3,366 (3,329–3,402) | 2,535 (2,508–2,562) | 94.1 (93.4–94.7) | 92.6 (91.9–93.3) |
| Abnormal ABI † | 2,955 (2,837–3,074) | 2,208 (2,119–2,297) | 87.5 (85.3–89.7) | 86.8 (84.6–89.0) |
| Adjusted model | ||||
| Abnormal ABI vs normal ABI | −106 (−201 to −11) ∗ | −58 (−134 to 17) | −4.0 (−6.6 to −1.4) ∗ | −2.9 (−5.5 to −0.3) ∗ |
| Measured by LV ejection fraction (EF) | ||||
| Unadjusted model | ||||
| Normal EF | 3,280 (3,242–3,318) | 2,482 (2,454–2,511) | 93.8 (93.1–94.6) | 92.8 (92.1–93.5) |
| Reduced EF ‡ | 3,391 (3,296–3,485) | 2,507 (2,436–2,578) | 88.7 (87.0–90.5) | 86.6 (84.9–88.3) |
| Adjusted model | ||||
| Reduced EF vs normal EF | −107 (−182 to −32) ∗ | −106 (−164 to −48) ∗ | −3.2 (−5.3 to −1.2) ∗ | −4.1 (−6.1 to −2.1) ∗ |
| Measured by LV mass index | ||||
| Unadjusted model | ||||
| No LV hypertrophy | 3,447 (3,408–3,487) | 2,598 (2,568–2,628) | 94.3 (93.6–95.1) | 93.0 (92.2–93.7) |
| LV hypertrophy § | 2,844 (2,777–2,912) | 2,151 (2,100–2,202) | 89.5 (88.2–90.8) | 88.7 (87.4–90.0) |
| Adjusted model | ||||
| LV hypertrophy vs no LV hypertrophy | −121 (−184 to −58) ∗ | −83 (−132 to −34) ∗ | −2.5 (−4.2 to −0.7) ∗ | −1.9 (−3.6 to −0.2) ∗ |
| Measured by LVWM abnormality ¶ (ABN) | ||||
| Unadjusted model | ||||
| No LVWM ABN | 3,280 (3,245–3,315) | 2,478 (2,452–2,505) | 92.8 (92.2–93.5) | 91.8 (91.1–92.4) |
| LVWM ABN | 3,430 (3,280–3,580) | 2,461 (2,348–2,574) | 93.0 (90.2–95.7) | 88.0 (85.3–90.8) |
| Adjusted model | ||||
| WMABN vs no WMABN | −4 (−118 to 111) | −101 (−191 to −11) ∗ | 0.7 (−2.4 to 3.8) | −3.1 (−6.2 to 0.0) ∗ |
Stay updated, free articles. Join our Telegram channel

Full access? Get Clinical Tree


