Higher left ventricular (LV) mass, wall thickness, and internal dimension are associated with increased heart failure (HF) risk. Whether different LV hypertrophy patterns vary with respect to rates and types of HF incidence is unclear. In this study, 4,768 Framingham Heart Study participants (mean age 50 years, 56% women) were classified into 4 mutually exclusive LV hypertrophy pattern groups (normal, concentric remodeling, concentric hypertrophy, and eccentric hypertrophy) using American Society of Echocardiography–recommended thresholds of echocardiographic LV mass indexed to body surface area and relative wall thickness, and these groups were related to HF incidence. Whether risk for HF types (HF with reduced ejection fraction [<45%] vs preserved ejection fraction [≥45%]) varied by hypertrophy pattern was then evaluated. On follow-up (mean 21 years), 458 participants (9.6%, 250 women) developed new-onset HF. The age- and gender-adjusted 20-year HF incidence increased from 6.96% in the normal left ventricle group to 8.67%, 13.38%, and 15.27% in the concentric remodeling, concentric hypertrophy, and eccentric hypertrophy groups, respectively. After adjustment for co-morbidities and incident myocardial infarction, LV hypertrophy patterns were associated with higher HF incidence relative to the normal left ventricle group (p = 0.0002); eccentric hypertrophy carried the greatest risk (hazard ratio [HR] 1.89, 95% confidence interval [CI] 1.41 to 2.54), followed by concentric hypertrophy (HR 1.40, 95% CI 1.04 to 1.87). Participants with eccentric hypertrophy had a higher propensity for HF with reduced ejection fraction (HR 2.23, 95% CI 1.48 to 3.37), whereas those with concentric hypertrophy were more prone to HF with preserved ejection fraction (HR 1.66, 95% CI 1.09 to 2.51). In conclusion, in this large community-based sample, HF risk varied by LV hypertrophy pattern, with eccentric and concentric hypertrophy predisposing to HF with reduced and preserved ejection fraction, respectively.
We evaluated the long-term prognosis of left ventricular (LV) hypertrophy patterns with respect to heart failure (HF) risk. We hypothesized an increased risk for HF in patients with LV hypertrophy patterns (i.e., concentric remodeling, concentric hypertrophy, and eccentric hypertrophy) compared with those with normal left ventricles. Furthermore, we postulated an increasing gradient of HF risk across LV remodeling patterns that varies by type of HF, that is, risk for HF with reduced ejection fraction (HFREF) will increase from concentric remodeling to eccentric hypertrophy (intermediate incidence rates in those with concentric hypertrophy), whereas risk for HF with preserved ejection fraction (HFPEF) will increase from concentric remodeling to concentric hypertrophy (intermediate incidence rates in those with eccentric hypertrophy).
Methods
Attendees of the 16th examination cycle of the Framingham Heart Study Original Cohort (1978 to 1980) and the 2nd examination cycle of the Offspring Cohort (1979 to 1982) were eligible for our investigation (n = 6,214). After excluding participants with prevalent myocardial infarction (MI) or HF (n = 319), those missing follow-up (n = 14), and those with missing or unavailable echocardiographic data (n = 1,113), 4,768 subjects remained eligible. All participants were white of European descent and provided written informed consent, and the study protocol was approved by the institutional review board of Boston University Medical Center.
At the baseline examinations, study participants underwent 2-dimensionally guided M-mode echocardiography. LV end-diastolic dimension (LVEDD) and the end-diastolic thicknesses of the interventricular septum and LV posterior wall were measured according to American Society of Echocardiography recommendations. LV mass (LVM) and relative wall thickness (RWT) were calculated using the following formulae LVM (g) = 0.8[1.04 (LVEDD + interventricular septal thickness + LV posterior wall thickness) 3 − (LVEDD) 3 ] + 0.6, and RWT = (interventricular septal thickness + LV posterior wall thickness)/LVEDD.
We calculated fractional shortening (FS; [LVEDD − LV systolic dimension]/LVEDD), and a value of ≤0.29 (corresponding to an ejection fraction of 50%) indicated decreased LV systolic function.
We used American Society of Echocardiography–recommended thresholds for identifying normal and elevated LVM (indexed to body surface area; ≤115 vs >115 g/m 2 for men and ≤95 vs >95 g/m 2 for women) and RWT (≤0.42 vs >0.42) to classify participants into 4 mutually exclusive LV hypertrophy patterns: normal (LVM and RWT normal), concentric remodeling (LVM normal but RWT elevated), eccentric hypertrophy (LVM elevated but RWT normal), and concentric hypertrophy (LVM and RWT elevated).
Covariates were defined at the baseline examination. Body mass index was calculated as weight in kilograms divided by the square of height in meters. During the Framingham Heart Study clinic visit, a physician measured blood pressure twice in the left arm of the seated participant using a mercury-column sphygmomanometer and a cuff of appropriate size; the average of these 2 readings indicated the examination blood pressure. Serum lipids were measured using standardized assays. Diabetes mellitus was defined as fasting plasma glucose ≥126 mg/dl, random plasma glucose ≥200 mg/dl, or use of insulin or other hypoglycemic therapy. Cardiac valve disease was defined as presence of a systolic murmur of grade ≥3 or any diastolic murmur at the Framingham Heart Study examination.
An end points committee reviews Framingham Heart Study clinic charts and hospitalization and physician office records for all suspected cardiovascular events, including HF, and adjudicates incident events using prespecified criteria. We used Framingham criteria ( Supplementary Table 1 ) to determine HF occurrence. We defined HF as HFREF if the ejection fraction (at the time of HF event) was <45% and as HFPEF if the ejection fraction was ≥45%.
We estimated the age- and gender-adjusted 10-year cumulative and 20-year cumulative HF incidence for each LV pattern. We used Cox regression to compare HF hazards in each LV group (with the normal group serving as the referent), after confirming that the assumption of proportionality of hazards was met. We constructed a multivariable model adjusting for age, gender, body mass index, systolic blood pressure, hypertension treatment, diabetes, total cholesterol/high-density lipoprotein ratio, smoking, valve disease, reduced baseline FS (≤0.29 vs >0.29), and MI occurrence on follow-up; all variables were entered simultaneously into the Cox models. Because values of covariates (such as blood pressure) and proportions of participants who receive therapy that modifies HF risk (such as antihypertensive therapy) change over time, we updated the covariate profile at each subsequent examination attended by each participant (i.e., all variables, except for age, gender, and LV hypertrophy patterns, were entered as time-dependent covariates in the Cox regression models).
To control for potential confounding in the relations of hypertrophy patterns to HF risk, we performed the following secondary analyses. Because LV hypertrophy patterns may be associated with low FS, we repeated analyses excluding subjects with reduced FS at the baseline examination. To eliminate potential confounding by prevalent valve disease, we repeated our analysis excluding participants with clinical valve disease. To evaluate the impact of gender and age on the relations of hypertrophy patterns to HF risk, we repeated the analyses including appropriate interaction terms (hypertrophy pattern × gender and hypertrophy pattern × age dichotomized at the median).
To evaluate if a differential gradient of HF risk existed across the LV hypertrophy patterns and if this gradient varied by type of HF, we related LV hypertrophy patterns to HFREF and HFPEF in separate Cox regression analyses using the statistical model described previously. All analyses were performed using SAS version 9.2 (SAS Institute Inc., Cary, North Carolina), and p values <0.05 were considered statistically significant.
Results
The baseline clinical and echocardiographic characteristics of participants are listed in Tables 1 and 2 . Participants excluded for unavailable echocardiographic data were older, had higher mean systolic blood pressures, had higher total/high-density lipoprotein cholesterol ratios, and had a higher prevalence of diabetes and hypertension treatment, compared with the study sample as a whole. In the study sample, mean LVM, LV dimensions, and wall thicknesses were higher in men than in women.
| Variable | All Participants (n = 4,768) | Normal Left Ventricle (n = 3,384) | Concentric Remodeling (n = 686) | Concentric Hypertrophy (n = 373) | Eccentric Hypertrophy (n = 325) |
|---|---|---|---|---|---|
| Age (yrs) | 50 ± 14 | 47 ± 13 | 59 ± 13 | 64 ± 14 | 55 ± 15 |
| Women | 56% | 57% | 50% | 57% | 58% |
| Body mass index (kg/m 2 ) | 25.7 ± 4.3 | 25.2 ± 4.1 | 26.7 ± 4.5 | 27.8 ± 4.4 | 26.4 ± 4.6 |
| Systolic blood pressure (mm Hg) | 126 ± 19 | 122 ± 17 | 134 ± 19 | 142 ± 21 | 134 ± 21 |
| Total cholesterol (mg/dl) | 210 ± 41 | 205 ± 41 | 223 ± 41 | 234 ± 8.9 | 213 ± 39 |
| High-density lipoprotein cholesterol (mg/dl) | 50 ± 14 | 50 ± 14 | 48 ± 14 | 47 ± 15 | 50 ± 14 |
| Diabetes mellitus | 3.9% | 2.5% | 6.0% | 11.5% | 5.7% |
| Lung disease | 11.9% | 5.4% | 7.1% | 8.0% | 10.2% |
| Kidney disease | 6.1% | 6.4% | 5.3% | 5.4% | 5.3% |
| Hypertension treatment | 15.6% | 10.4% | 24.6% | 39.7% | 23.7% |
| Valve disease | 1.4% | 0.5% | 0.6% | 8.7% | 4.0% |
| Smoking | 33% | 34% | 30% | 28% | 34% |
| Interim MI ∗ | 9.7% | 8.0% | 14.6% | 13.4% | 13.5% |
| Stroke | 7.8% | 6.2% | 11.8% | 14.3% | 8.7% |
∗ MI occurrence between baseline examination and diagnosis of HF or end of follow-up (whichever occurred earlier).
| Variable | Men (n = 2,098) | Women (n = 2,670) | ||||||
|---|---|---|---|---|---|---|---|---|
| Normal Left Ventricle | Concentric Remodeling | Concentric Hypertrophy | Eccentric Hypertrophy | Normal Left Ventricle | Concentric Remodeling | Concentric Hypertrophy | Eccentric Hypertrophy | |
| LV mass/body surface area (g/m 2 ) | 88 ± 13 | 96 ± 12 | 141 ± 34 | 130 ± 18 | 73 ± 11 | 79 ± 10 | 117 ± 26 | 109 ± 18 |
| Interventricular septal thickness (cm) | 0.92 ± 0.08 | 1.10 ± 0.10 | 1.31 ± 0.18 | 1.06 ± 0.08 | 0.81 ± 0.08 | 0.97 ± 0.09 | 1.23 ± 0.22 | 0.94 ± 0.07 |
| LV posterior wall thickness (cm) | 0.91 ± 0.08 | 1.09 ± 0.09 | 1.27 ± 0.16 | 1.06 ± 0.08 | 0.80 ± 0.08 | 0.97 ± 0.08 | 1.17 ± 0.16 | 0.93 ± 0.07 |
| LV wall thickness (cm) | 1.83 ± 0.16 | 2.19 ± 0.18 | 2.58 ± 0.32 | 2.12 ± 0.15 | 1.61 ± 0.16 | 1.94 ± 0.17 | 2.41 ± 0.34 | 1.87 ± 0.14 |
| LVEDD (cm) | 5.10 ± 0.35 | 4.74 ± 0.32 | 5.15 ± 0.44 | 5.79 ± 0.39 | 4.60 ± 0.30 | 4.15 ± 0.29 | 4.46 ± 0.45 | 5.14 ± 0.39 |
| RWT | 0.36 ± 0.04 | 0.46 ± 0.05 | 0.51 ± 0.09 | 0.37 ± 0.04 | 0.35 ± 0.04 | 0.47 ± 0.05 | 0.55 ± 0.11 | 0.37 ± 0.04 |
| FS | 0.36 ± 0.04 | 0.38 ± 0.04 | 0.37 ± 0.04 | 0.35 ± 0.05 | 0.38 ± 0.04 | 0.41 ± 0.04 | 0.40 ± 0.05 | 0.37 ± 0.05 |
| FS ≤0.29 | 2.0% | 0.9% | 4.3% | 7.3% | 0.4% | 0.3% | 2.4% | 3.2% |
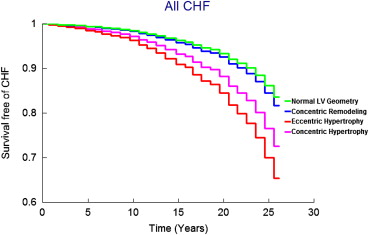
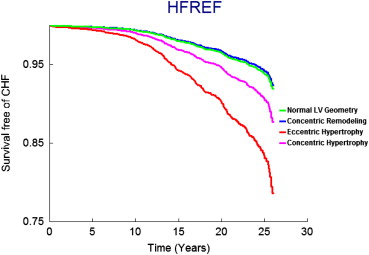
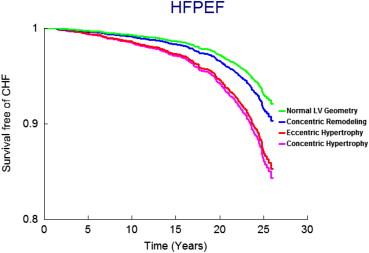
On follow-up (mean 21 years, maximum 28 years), 458 participants (9.6%, 250 women) developed new-onset HF. Figure 1 displays age- and gender-adjusted survival free of HF in the 4 groups and demonstrates the highest incidence of HF in those with eccentric hypertrophy, followed by concentric hypertrophy, with participants with concentric remodeling having a risk intermediate between the normal group and these groups; Figures 2 and 3 display analogous data for the HFREF and HFPEF. Age- and gender-adjusted incidence was highest for those with eccentric hypertrophy ( Table 3 ).
| Variable | Normal Left Ventricle | Concentric Remodeling | Concentric Hypertrophy | Eccentric Hypertrophy |
|---|---|---|---|---|
| No. of events/no. at risk | 216/3,384 | 97/686 | 81/373 | 64/325 |
| Age- and gender-adjusted 10-yr incidence ∗ | 1.58 (0.98–2.17) | 1.99 (1.08–2.86) | 3.91 (2.45–5.28) | 5.19 (3.00–7.20) |
| Age- and gender-adjusted 20-yr incidence ∗ | 6.96 (5.45–8.36) | 8.67 (6.45–10.70) | 13.38 (9.90–16.43) | 15.27 (11.01–18.90) |
∗ HF incidence are age and gender adjusted per 100 patients; values in parentheses are 95% confidence intervals.
In multivariate-adjusted Cox regression models, LV hypertrophy patterns were associated with increased HF incidence compared with the normal left ventricle group ( Table 4 ). Eccentric hypertrophy and concentric hypertrophy were associated with increased risk, whereas concentric remodeling was not independently associated with HF risk. Qualitatively similar results were obtained when analyses were repeated in the subgroup of participants with normal FS (>0.29) ( Table 4 ) and in analyses excluding participants with valve disease ( Table 4 ). We did not observe any statistically significant gender interaction (p for interaction term = 0.53). The interaction term for age was statistically significant (p = 0.02), suggesting that the relations of hypertrophy patterns to HF risk may vary by age. However, when our main multivariate model relating hypertrophy pattern to HF risk was repeated separately in participants older and younger than the median age, the results were similar (data not shown). Of note, most of the covariates were also statistically significantly associated with incident HF, and the results are provided in Supplementary Table 2 .
| Adjusted Hazard Ratio ∗ for HF (95% Confidence Interval) | ||||
|---|---|---|---|---|
| Normal Left Ventricle | Concentric Remodeling | Concentric Hypertrophy | Eccentric Hypertrophy | p Value † |
| All participants (n = 4,768) | ||||
| Referent | 1.09 (0.85–1.40) | 1.40 (1.04–1.87) | 1.89 (1.41–2.54) | 0.0002 |
| Participants with normal FS (>0.29) (n = 4,700) | ||||
| Referent | 1.21 (0.94–1.57) | 1.52 (1.13–2.05) | 1.78 (1.31–2.41) | 0.0009 |
| Participants without clinical valve disease (n = 4,678) | ||||
| Referent | 1.16 (0.90–1.50) | 1.38 (1.02–1.87) | 1.70 (1.25–2.32) | 0.005 |
∗ HRs indicate HF risk associated with individual hypertrophy patterns compared with the group with normal left ventricles (referent) and adjusted for the following covariates: age, gender, body mass index, systolic blood pressure, valve disease, hypertension treatment, diabetes, total cholesterol/high-density lipoprotein cholesterol ratio, smoking status, FS, and interim MI.
† Statistical significance (p <0.05) for the global test for differences among the 4 LV patterns with respect to HF risk.
Stay updated, free articles. Join our Telegram channel

Full access? Get Clinical Tree


